
Figures & data
Figure 1. Reassortment between A(H7N9) and genetically divergent A(H9N2) viruses might occur in eggs. The parental A(H7N9) virus HK1772 is shown in orange. The parental A(H9N2) viruses: G1 (a), YU335 (b), HJ (c), and BJ16 (d) are shown in purple, red, blue, and cyan, respectively. HA(4), NA(6), PB2(1), PB1(2), PA(3), NP(5), M(7), and NS(8) of plaques are shown. # represents the number of plaques with the same genotype. In the pie charts, N indicates the total number of plaques examined in this combination. The mean ± standard deviation (SD) percent of genotype frequency is shown. New genotypes are shown in different shades of grey. (e) Genotype diversity index is the number of different genotypes divided by the total number of plaques screened in the egg. Statistical analyses were performed by Kruskal-Wallis test followed by Dunn’s multiple comparison test. The minimum P values are shown.
Figure 2. The onward transmission of reassortants in chickens co-infected with A(H7N9) and A(H9N2) viruses varied with strains in chickens. (a) Experimental scheme. Three chickens (designated as donors) were inoculated intranasally with a mixture of A(H7N9) and A(H9N2) viruses. At 1-day post-infection (D1), three donors were housed with three naïve contacts (designated as 1st contacts) in three cages. At D3, three 1st contacts were co-housed with three naïve chickens (designated as 2nd contact) in three cages. At D5, all chickens were single-housed. Oropharyngeal and cloacal swabs and sera were collected at these indicated time points; HI, hemagglutinin inhibition; (b) Viral loads detected in oropharyngeal swabs. The lines represent the average viral M gene copies of three chickens (dots). Black horizontal dashed lines represent the limit of detection. (c, d, and e) The area under the curve (AUC) of viral loads in oropharyngeal swabs. Statistical analyses were performed by Kruskal-Wallis test followed by Dunn’s multiple comparison test. The P < .05 values are shown.
Figure 3. Robust reassortment could be detected in chickens co-infected with A(H7N9) and different A(H9N2) viruses. The parental A(H7N9) virus HK1772 is shown in orange. The parental A(H9N2) viruses: G1 (a), YU335 (b), HJ (c), and BJ16 (d) are shown in purple, red, blue, and cyan, respectively. HA(4), NA(6), PB2(1), PB1(2), PA(3), NP(5), M(7), and NS(8) of individual plaques are shown. # represents the number of plaques with the same genotype. In the pie charts, N indicates the total number of plaques examined in this combination. The mean ± SD percent of genotype frequency is shown. New genotypes are shown in different shades of grey.
Figure 4. Pairwise comparison of genotyped segments showed various reassortment preferences between A(H7N9) and A(H9N2) viruses in eggs (a), and in oropharyngeal swabs collected at 1 dpi (b) and 3 dpi (c). Segments are shown with different symbols and colours. The means ± SD of homologous frequency from three independent co-infections are shown.
Figure 5. Viruses were transmitted to contact chickens. The parental A(H7N9) virus HK1772 is shown in orange. The parental A(H9N2) viruses :YU335 (a), and BJ16 (b) are shown in red and cyan, respectively. HA(4), NA(6), PB2(1), PB1(2), PA(3), NP(5), M(7), and NS(8) of individual plaques are shown. # represents the number of plaques with the same genotype. In the pie charts, N indicates the total number of plaques. The mean ± SD percent of genotype frequency is shown. New genotypes are shown in different shades of grey.
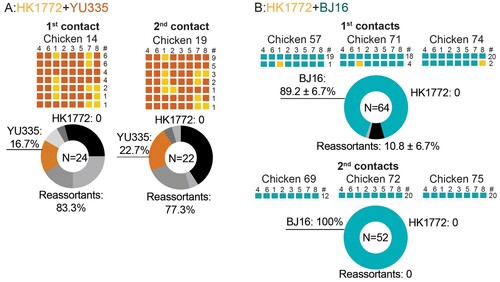
Table 1. Genotype diversity index (%) detected in chickens. Genotype diversity index was determined by plaques isolated from oropharyngeal swabs of donors at 1 and 3 days post-infection (dpi), 1st contacts at 3 dpi and 2nd contacts at 5 dpi.
Reassortment_supplemental-v13.docx
Download MS Word (13.9 MB)Data availability statement
Sequences of Sanger sequencing validated in the study were deposited to the public database GISAID under the following accession numbers: HK1772, GISAID accession # EPI_ISL_4882548; G1, GISAID accession # EPI_ISL_3144464; YU335, GISAID accession # EPI_ISL_3144467; HJ, GISAID accession # EPI_ISL_3144489; BJ16, GISAID accession # EPI_ISL_3144854. NGS samples have been deposited in the Sequence Read Archive of the NCBI under project accession number PRJNA768344 and PRJNA769384.