Figures & data
Figure 1. Use of VSV-EBOV model to assess therapeutics that target the EBOV-GP. P3 C57BL/6 mice were infected with 1000 TCID50 of VSV-EBOV and treated with human IgG isotype controls (IgG control; 100 mg/kg) or SAB-139 (100 mg/kg) prophylactically (−1 dpi), or therapeutically (3 or 5 dpi) (n = 6–7/group). Controls include uninfected and control Ab-treated animals (n = 28 and n = 17, respectively). Mice were monitored for weight changes (a), survival (b) and neurological symptoms (c). Symptom scores are 1 (staggering, broadened stance), 2 (moderate ataxia), 3 (severe ataxia/paralysis), and 4 (unresponsive/moribund). Data are shown as mean ± S.E.M. and represent 2–6 independent experiments. Statistical significance was determined using mixed-effects analysis with Dunnett’s multiple comparisons (a and c) and the log-rank test (b), respectively. *P < .05, **P < .01, ***P < .001 compared to uninfected mice.
Figure 2. Viral burden and lesions in the brain of VSV-EBOV-infected mice. (a) VSV-EBOV-infected mice were treated with SAB-139 or IgG control (100 mg/kg) at 3 dpi. Viral loads were evaluated by TCID50 in the brain, spinal cord and blood of 3 (pre-treatment), 6 and 9 dpi mice treated with SAB-139 or IgG control (n = 4–6/group). Data are shown as mean ± S.D. and represent 2–3 independent experiments. (b) Viral antigen and apoptotic cell markers in the brains of VSV-EBOV-infected mice treated with IgG control (VSV-EBOV + IgG; n = 4) or SAB-139 (VSV-EBOV + SAB; n = 4) at 3 dpi, and sacrificed at 9 dpi. The images show representative immunofluorescence staining for EBOV-GP antigen (red), TUNEL (green) and DAPI (blue) in brain sections. Scale bar: 1 mm. (c) Histopathology of the cerebellum of uninfected mice (n = 2), and VSV-EBOV-infected mice treated with IgG control (VSV-EBOV + IgG; n = 4) or SAB-139 (VSV-EBOV + SAB; n = 4). The upper images show representative H&E staining of cerebellum (40×). The bottom close-up images show representative brain lesions observed in cerebellum. EGCL, the external granular cell layer; IGCL, the internal granular cell layer.
Table 1. Summarized pathology of the brain.
Figure 3. Microglial loss and immune cell infiltration in the brains of VSV-EBOV-infected mice. (a) VSV-EBOV-infected mice were treated with IgG control (VSV-EBOV + IgG; n = 4) or SAB-139 (VSV-EBOV + SAB; n = 4) at 3 dpi, and then sacrificed at 9 dpi. The images show representative immunofluorescence staining for IBA (green), CD45 (red) and DAPI (blue) in brain sections. Inset: Close-up images of microglia. Scale bar: 1 mm (in whole brain images) or 25 μm (in the bottom images). (b–d) Flow cytometry analysis of cells isolated from the brain at 9 dpi. Representative plots showing the population of microglia in the brain (b, left; 1 of 3-5 mice with similar results). The graphs show the percentage of microglia (CD45intCD11b+) (b, right) and CD45hi infiltrating cells (c) in total live cells, respectively. The percentage of macrophages (CD45hiCD11b+F4/80+), DCs (CD45hiCD11c+F4/80-Ly6G-), neutrophils (CD45hiCD11b+Ly6G+F4/80-), T cells (CD45hiCD3+NK1.1-) and NK cells (CD45hi NK1.1+CD3+) in total live cells at 9 dpi (d). (e) IFNγ and CD69 expression in T cells (CD45hiCD3+NK1.1-) and NK cells (CD45hiNK1.1+CD3-) from the brains at 9 dpi. The cells were incubated with brefeldin A (10 μg/mL) for 3.5 h to measure IFNγ. Data are representative of two independent experiments. Data shown as means ± S.D. (n=3-6). *P<0.05, **<0.01.
Figure 4. Gene expression in the brains of VSV-EBOV-infected mice treated with IgG control or SAB-139. Heat map of mRNA expression in the brain of VSV-EBOV-infected mice treated with IgG control (VSV-EBOV + IgG; n = 4) or SAB-139 (VSV-EBOV + SAB; n = 4) at 9 dpi. RNA was assessed by NanoString. Genes selected based on significant changes by SAB-139 treatment from a panel of 596 genes and organized by gene function. A total of 596 gene expression is available in Figure S4.
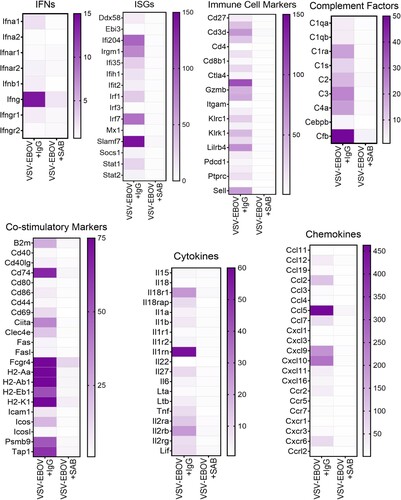
Figure 5. Use of low-challenge VSV-EBOV model to assess the impact of treatment on long-term neurological sequelae. P3 mice were s.c. infected with 500 TCID50 of VSV-EBOV and monitored for survival (a) for 60 days. Statistical significance was determined using the log-rank test. ***P<.001 compared to uninfected mice. (b) Comparison of viral load in the brain and peripheral blood from mice challenged with 500 TCID50 or 1000 TCID50 of VSV-EBOV at 6 dpi by TCID50 analysis. Data are shown as mean ± S.D. and represent 2–3 independent experiments. (c) Behavior tests in uninfected (n = 20), VSV-EBOV-infected mice (VSV-EBOV; n = 14) or VSV-EBOV-infected mice treated with SAB-139 (VSV-EBOV + SAB; n = 11) at six months post-infection. Open Field Test (OFT) shows total distance travelled, total time spent moving and occurrence of mouse rotation as well as time within the center 50%, marginal and corner area of the OFT maze. (d) Elevated Plus Maze (EPM) shows total distance travelled in the closed and open arm as well as time spent in the center, closed and open arm of the maze. (e) Rotarod test shows average latency to fall (mean of 3 test/mouse) balancing on a rotating rod of gradually increasing speed over 180 s. *P < .05, *P < .01.