Figures & data
Figure 1. Sample profiles in each specimen type. Number of samples and viral RNA concentration are compared among the three specimen types. A. Total number of samples and proportion recorded in different periods after hospitalization. The percentage of samples collected during the first 7 days was higher in O/N swab than anal swab and saliva, while after the second 7 days the percentage was lower in O/N swab. B. Viral levels were compared among anal swab, O/N swab and saliva. Percentage of samples with higher viral level (Ct≤35), low viral level (35 < Ct≤40) and negative results (40 < Ct) are presented for the first 7 days, the second 7 days and the period after the second 7 days of hospitalization.
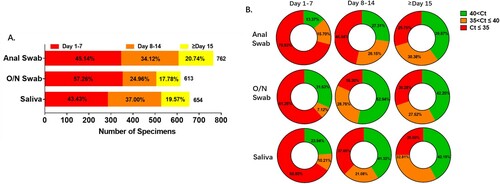
Table 1. Demographic characteristics of the patients.
Figure 2. Detection profiles according to specimen type. Sensitivity and trend of viral RNA concentration are compared among anal swab, O/N swab and saliva. A. Number of patients detected (positive), undetected (negative) and with excluded results (X) in each specimen type. B. Number of patients with positive result in each specimen type each day after hospitalization. C. Viral RNA concentration in all detected patients by each specimen each day after the first positive result of each patient. D. The kinetics of anti-COVID-19 IgM and IgG in serum after onset of symptoms. RLU: the detected signals relative light units.
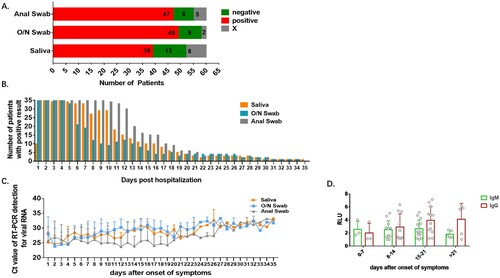
Table 2. Profiles of RT-PCR results using different specimens.
Table 3. Difference and concordance of saliva and O/N swab with anal swab as reference.
Figure 3. Analyses of Conversion Days comparing pairs of specimens. Conversion Days was calculated as days from hospitalization to the last positive viral RNA result. The Pearson correlation coefficient was used to measure the strength of the correlation between conversion days of each two specimens. Correlation of Conversion Days between anal swab and saliva(A), O/N swab and saliva (B), and O/N swab and anal swab (C). D. Comparison of Conversion Days between each pair of saliva, O/N swab and anal swab (Paired t test).
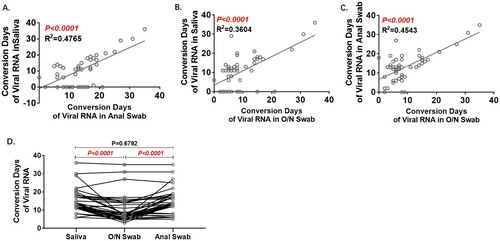
Figure 4. Analyses of Conversion Days of CT scanning and hs-CRP. A. Correlation of Conversion Days between CT scanning and hs-CRP. B. Comparison of Conversion Days between CT scanning and hs-CRP (Paired t test). C. Correlation of Conversion Days between CT scanning and RT-PCR with each of the three specimen types. D. Correlation of Conversion Days between hs-CRP and RT-PCR with each of the three specimen types. The Pearson correlation coefficient was used to measure the strength of the correlation.
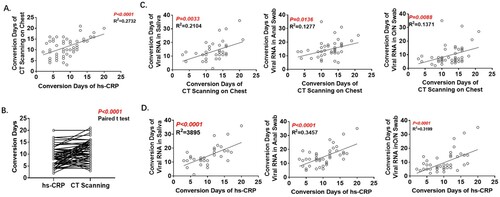
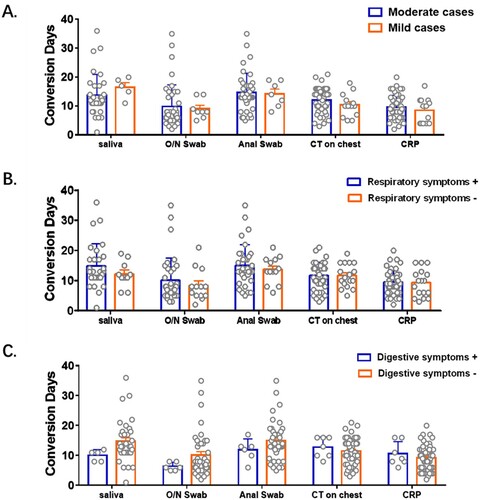
Figure 5. Impact of symptoms on conversion days of viral RNA and other clinical test. Patients were grouped according to their severity of symptoms (A), respiratory symptoms (B) and digestive symptoms (C) respectively. Conversion Days were compared. Difference between each two subgroup were determined by Student's t test.