Figures & data
Table 1. Primers used for pBD cDNA construction and for introducing mutations into the HA genes of the mutant viruses.
Table 2. Replication and lethality of H5N6 viruses in miceTable Footnotea.
Figure 1. Amino acid differences between the two H5N6 avian influenza viruses. The amino acid differences between GD/330 and FJ/160 are shown as single letters at the indicated positions. Each amino acid of GD/330 is shown before the number of the position, and each amino acid of FJ/160 is shown after the number of the position. The amino acid positions in HA1 for H3 numbering are shown in brackets.
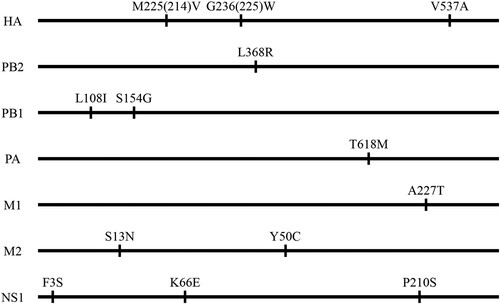
Figure 2. Replication and lethality of H5N6 avian influenza viruses in BALB/c mice. (a) Virus titers in organs of mice inoculated intranasally with 106.0 EID50 of different H5N6 viruses. Organs were collected on day 3 post-inoculation for virus titration in eggs. Data are means ± standard deviations (SD). The dashed lines indicate the lower limit of virus detection. The statistical analysis was conducted by using multiple t tests with GraphPad Prism 8 software. *, P<0.05 compared with the virus titers in the corresponding organs of rGD/330 virus-infected mice. **, P<0.01 compared with the virus titers in the corresponding organs of rGD/330 virus-infected mice. (b–g) MLD50 for mice infected with each indicated virus.
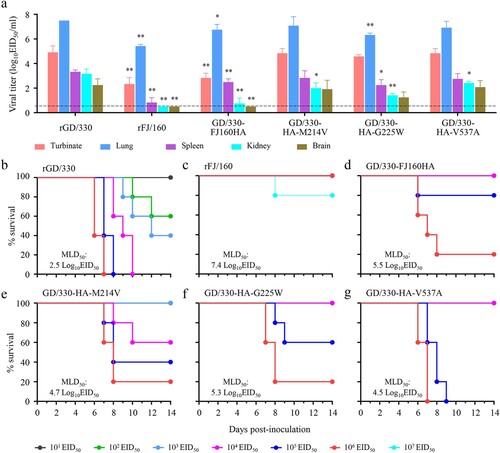
Figure 3. Multicycle replication of H5N6 avian influenza viruses in A549 cells. A549 cells were infected with three viruses at an MOI of 0.01, and the supernatants were collected at the indicated times and titrated in eggs. The data shown are the means of three replicates; the error bars indicate standard deviations. The statistical analysis was conducted by using multiple t tests. *, P<0.05 compared with the virus titers of rGD/330 virus-infected cells. **, P<0.01 compared with the virus titers of rGD/330 virus-infected cells.
Figure 4. The effect of pH on HA activation of different H5N6 viruses. Vero cells infected with (a) rGD/30, (b) rFJ/160, or (c) GD/330-HA-G225W at an MOI of 3 were incubated with pH-adjusted PBS (4.8–6.2). The highest pH at which syncytia formed (arrow) above 50% was defined as the pH threshold.
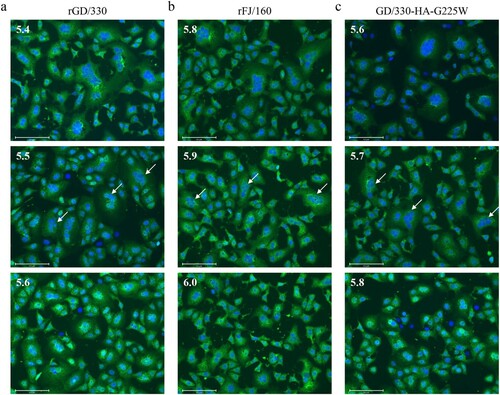
Figure 5. The stability of H5N6 avian influenza viruses. (a) Acid stability of three H5N6 viruses. 106.0 EID50 of each virus was diluted in PBS adjusted to the indicated pH and incubated at 37°C for 1 h. Virus titers were then determined in eggs. (b) Heat stability of three H5N6 viruses. 106.0 EID50 of each virus was incubated at 50°C for 6 h, and virus titers were then determined in eggs hourly. The statistical analysis was conducted by using multiple t tests with GraphPad Prism 8 software. *, P<0.05 compared with the titers of rGD/330 virus. **, P<0.01 compared with the titers of rGD/330 virus.
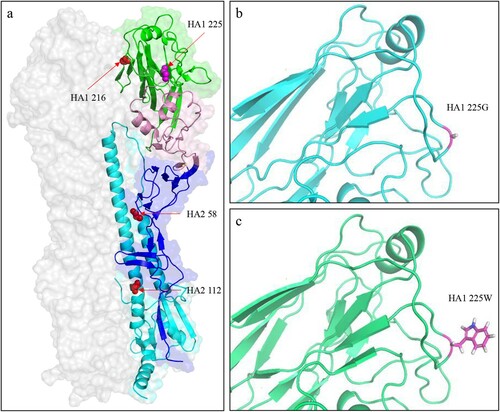
Figure 6. Three-dimensional (3D) structures and analysis of the HA protein of H5N6 viruses. (a) Positions affecting the pH of HA activation are displayed in the structure (PDB ID: 5HUF). The domains of the HA monomer are marked with different colours: receptor-binding domain (green), vestigial esterase subdomain (pink), and N- and C-terminal segments of HA1 (F′ fusion subdomain, blue), and HA2 (cyan). The positions of residues that affect the pH activation are shown as spheres. The 3D structures of HA of GD330 (b) and GD330-HA-G225W (c) were predicted by using I-TASSER algorithm, and the amino acid at position 225 was shown as stick in the structural illustration.