Figures & data
Figure 1. Prevalence of different subtypes of avian influenza viruses detected in wild birds in the Yellow River Delta wetland in eastern China, 2017–2021. (A) Sampling sites; (B) sampling size and number of isolates for each year; (C) sampling frequency, sampling numbers, AIV isolation numbers, and AIV isolation rates at each collection date; (D) subtypes identified.
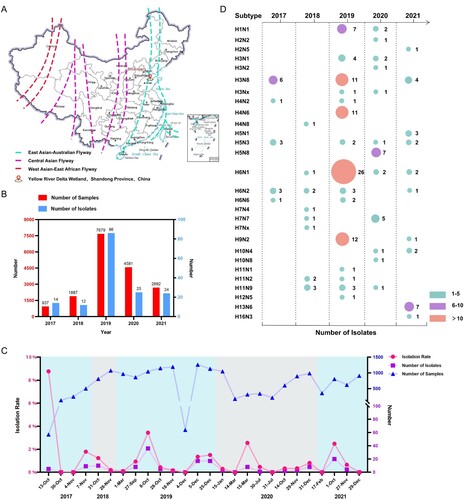
Figure 2. Global prevalence of H3N8 influenza A viruses. (A) HA and NA combinations of animal H3Nx strains in the database. (B) Summarized analysis of the animal hosts of H3N8 viruses. (C) Number of H3N8 viruses detected in wild birds from 1963 to 2022. (D) H3N8 viruses in migratory wild birds. The host species of the wild bird H3N8 viruses in the databases were classified and summarized according to their isolation information. Unidentified species indicate the H3N8 viral sequences in the databases without specific host information. (E) Distribution of H3N8 avian influenza viruses detected in China. All the public data in GenBank and GISAID used in this study were up to date as of November 25, 2022.
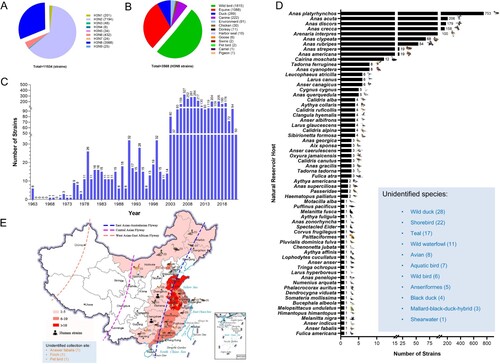
Figure 3. HA phylogenies of H3N8 viruses in all hosts (A), avian hosts (B) or wild bird hosts (C). Data for the time-scaled MCC tree inferred for the HA segment of the viruses in panel A were collected from all H3N8 hosts for which sequence data were available in GenBank and GISAID. The colour of each branch indicates the host, while the colour of each tip is the posterior time for that node. The colour of each branch in panel B indicates the location of the available avian H3Nx viruses. H3N8 viruses sequenced in this study are shown in red.

Figure 4. Phylogenetic analysis of the NA gene of the H3N8 virus. The sequences in purple, green, and blue represent the H3N8 viruses detected in this study.
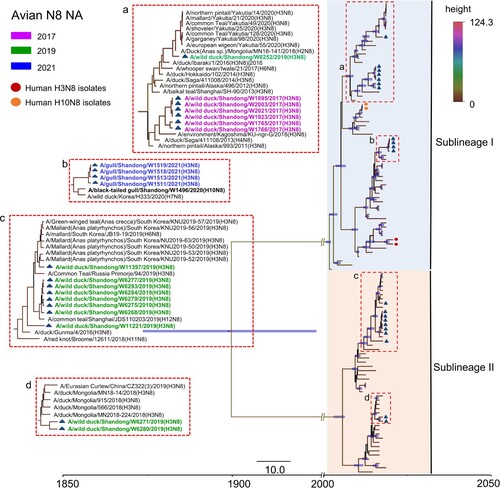
Figure 5. Genotypes of the H3N8 virus and replication of the representative viruses in mice. (A) Twelve genotypes of the 21 H3N8 viruses. (B) Replication of the representative H3N8 viruses in mice. The mice were inoculated with the representative viruses, and viral titers were detected in eggs. Data on the viral titers in the brain, spleen and kidney were negative and are not shown. The dashed line indicates the lower limit of detection. (C, D) Body weight change in the mice inoculated with the representative H3N8 viruses.

Figure 6. Receptor binding preferences of the representative wild bird H3N8 viruses. Two specific glycopolymers (α-2,3-siaylglycopolymer and α-2,6-siaylglycopolymer) were used to test the receptor binding properties of the representative H3N8 viruses. The data shown are the means of three replicates; the error bars indicate the standard deviation.
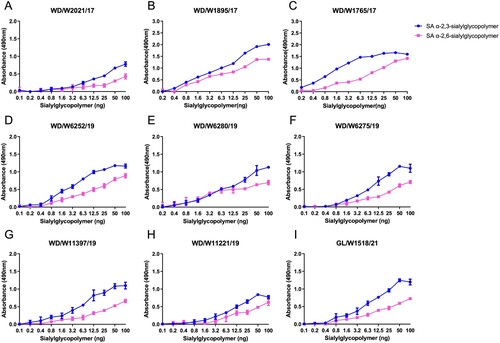
Figure 7. Replication and transmission of the representative H3N8 viruses in ducks. (A) Replication of the representative H3N8 viruses in ducks. SPF ducks were inoculated with the representative viruses; the organs were sampled at 3 dpi, and viruses were titrated in eggs. (B-D) Transmission of the representative H3N8 viruses in ducks. Oropharyngeal and cloacal swabs were collected from the ducks at the indicated time points, and the viruses were titrated in eggs. (E-F) Serum samples from inoculated and contact ducks were collected at 10, 15, and 21 dpi to detect HI antibodies. OP: oropharyngeal swab; CL: cloacal swab. The dashed lines indicate the lower limit of virus detection in panels A-D and the lower limit of HI antibody detection in panels E-G.
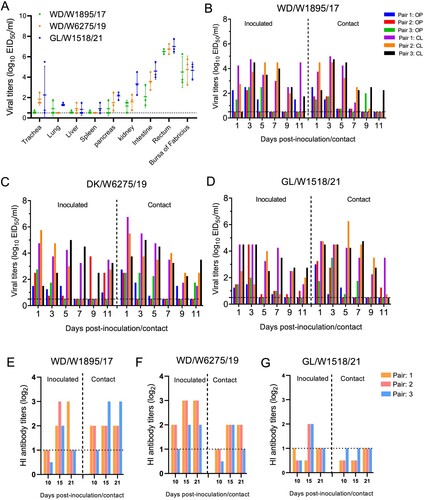
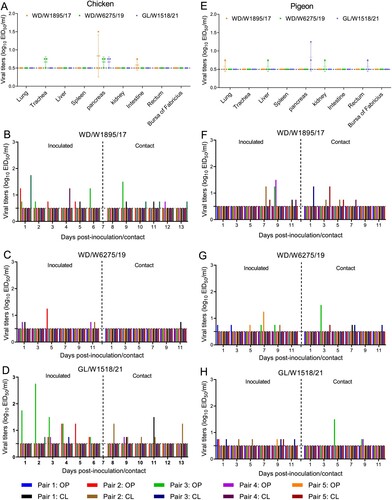
Figure 8. Replication and transmission of representative H3N8 viruses in chickens and pigeons. (A) Replication of the representative H3N8 viruses in chickens. Three commercial chickens were inoculated with the representative viruses, and viruses from the samples were titrated in eggs at 3 dpi. (B–D) Transmission of the representative H3N8 viruses in chickens. Oropharyngeal and cloacal swabs were collected from chickens at the indicated times, and viruses were titrated in eggs. (E) Replication of the representative H3N8 viruses in pigeons. Three pigeons were infected with the representative viruses; organ samples were collected, and the viruses were titrated in eggs at 3 dpi. (F-H) Transmission study of representative H3N8 viruses in pigeons. Swabs were collected, and the viruses were titrated in eggs. OP: oropharyngeal swab; CL: cloacal swab. The dashed line in each panel indicates the lower limit of detection.