Figures & data
Table 1. Clinical characteristics of COVID-19 admission patients.
Figure 1. Immunophenotype of COVID-19 admission patients. Green dots and boxes, healthy control; blue dots and boxes, mild or moderate COVID-19 admission patients; purple dots and boxes, severe COVID-19 admission patients; red dots and boxes, critical COVID-19 admission patients. The number of samples in the M/M, S, and C groups was 27, 17, and 24, respectively (details in supplement table 1). Significance was determined by the Wilcoxon rank-sum test: ***, < 0.001; **, < 0.01; *, < 0.05. M/M, mild or moderate illness; S, severe illness; C, critical illness.
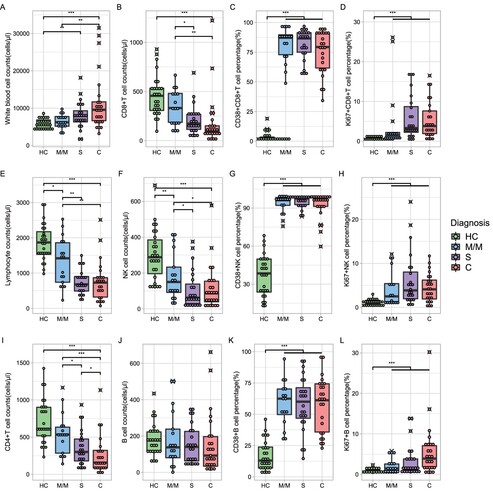
Figure 2. Immunophenotype changes of COVID-19 admission patients following 7 days of hospitalization. Orange boxes, baseline immunophenotype; cyan boxes, after 7 days of therapy. The black farks represent outliers. The number of samples in the M/M, S, and C groups was 8, 9, and 13, respectively. Paired Wilcoxon’s rank-sum test was used to assess for a difference before and after 7 days of hospitalization. No significant differences were found except lymphocyte cell counts and CD38+ NK cell percentage in the S group. Significance: ***, <0.001; **, <0.01; *, <0.05. M/M, mild or moderate illness; S, severe illness; C, critical illness.
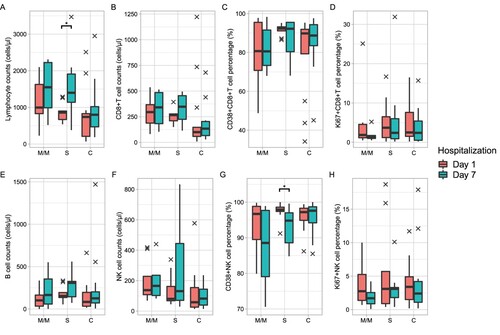
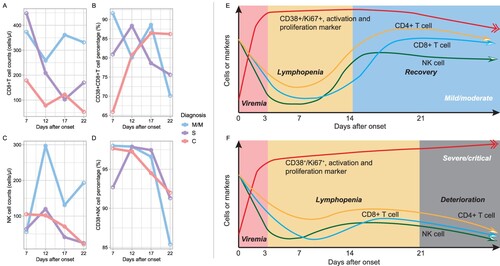
Figure 3. Dynamics of immunophenotype at early stages of COVID-19. Figures A–D refer to the dynamics of counts and activations of CD8+ T cell and natural killer cells based on 66 individual lymphocyte subset data. Each time point was a median of data of 2 days before and after. Figures E-F were hypothesis models describing distinct immunopathology among mild, moderate, severe, and critical illnesses. M/M, mild or moderate illness; S, severe illness; C, critical illness.