
Figures & data
Figure 1. Tumorous and non-tumorous liver CT images dataset.
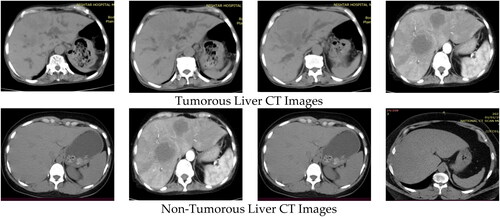
Figure 2. Histogram Equalization (a) Liver image before HE. (b) Pre HE graph, (c) Liver image after HE, (d) Post HE graph (Ciecholewski, Citation2007).
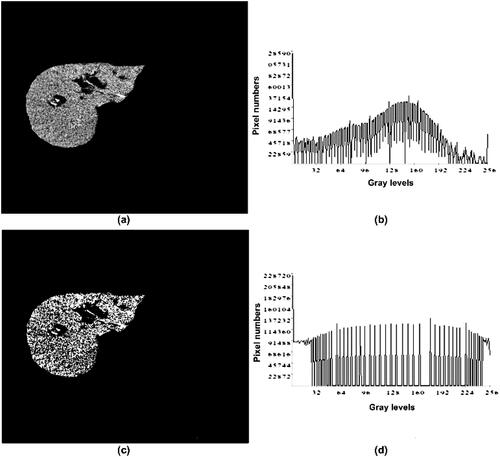
Figure 3. EMLTI liver tumor classification framework.
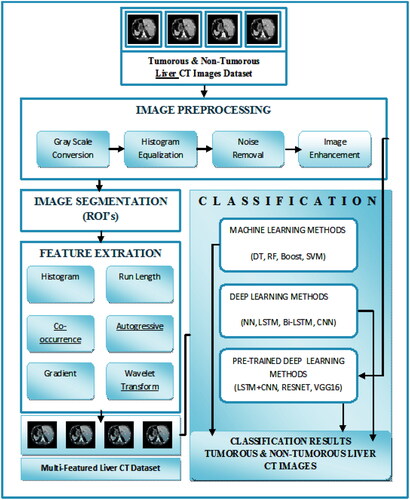
Table 1. Accuracy of ML and DL classifiers using all features.
Figure 4. Accuracy chart of ML and DL with complete feature list.
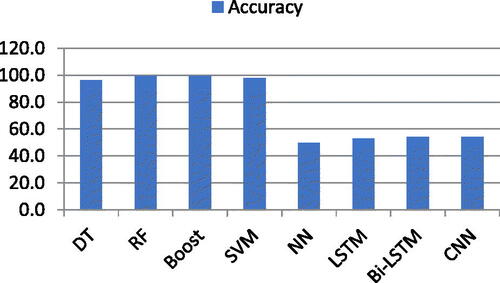
Table 2. Accuracy of ML and DL classifiers using co-occurrence.
Figure 5. Accuracy chart of ML and DL with co-occurrence feature list.
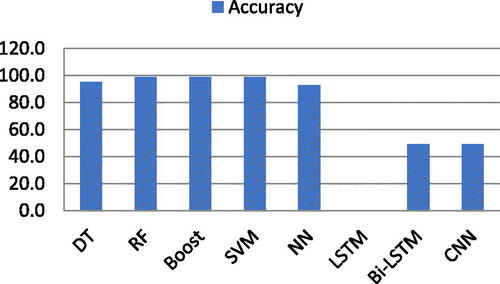
Table 3. Accuracy of ML and DL classifiers using wavelet transform features.
Figure 6. Accuracy chart of ML and DL with wavelet transform feature list.
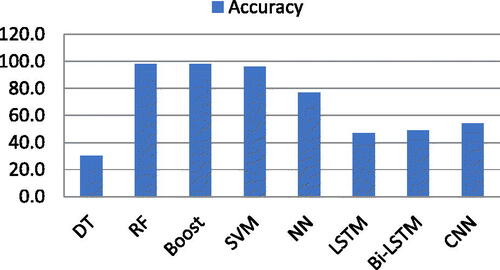
Table 4. Accuracy of ML and DL classifiers using gradient features.
Figure 7. Accuracy chart of ML and DL with gradient feature list.
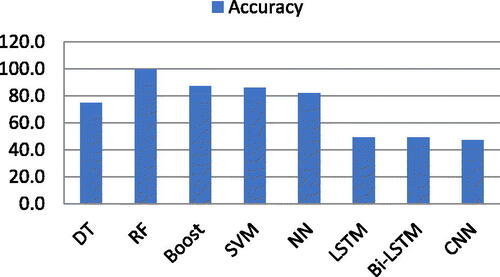
Table 5. Accuracy of ML and DL classifiers using autogressive features.
Figure 8. Accuracy chart of ML and DL with autogressive feature list.
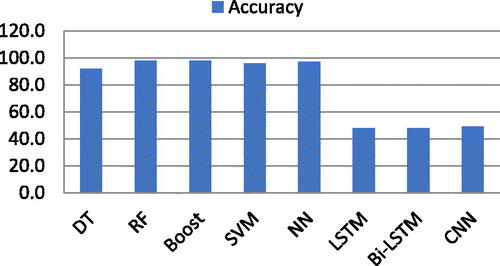
Table 6. Accuracy chart of ML and DL with complete and separate feature list.
Figure 9. Frequency table achieved by ML and DL on different feature sets.
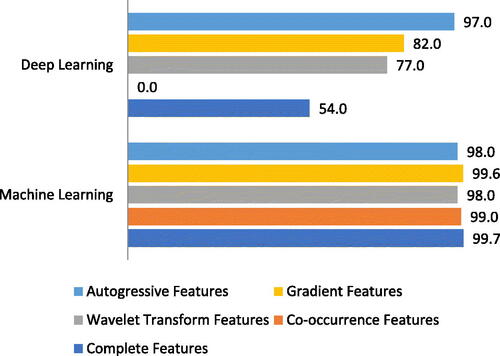
Table 7. Accuracy of pre-trained DL models.
Figure 10. Accuracy chart of pre-trained DL models.
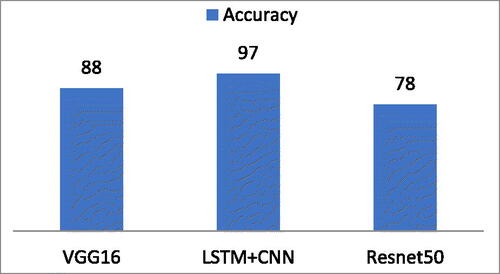
Table 8. State-of-the-art advancement in liver tumor classification.
Code availability
The code will be available upon request to the corresponding author.
Data availability
The data will be available upon request to the corresponding author.