
Figures & data
Figure 1. Typical representation of an apple tree along with a schematic depiction of carbon pools.
Source (Lakso et al., Citation1999).
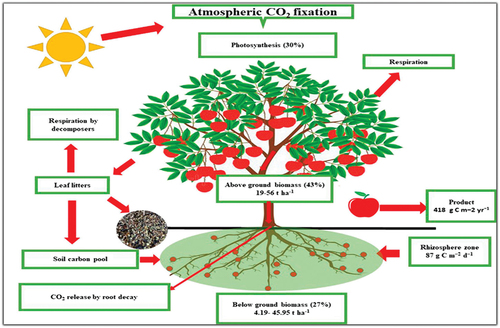
Table 1. The average carbon footprint values of a few fruits cultivated worldwide
Table 2. Carbon stock potential of fruit trees in different carbon pools
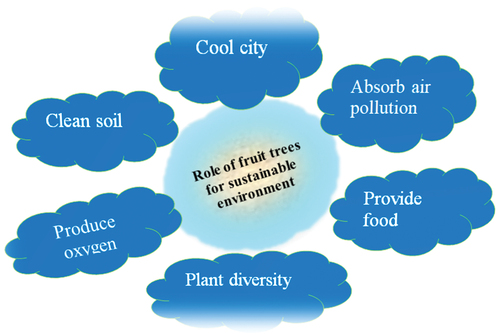
Figure 2. Contributions of fruit trees to the sustainable environment (short summary).
Supplemental material