
Figures & data
Figure 1. Map of study districts (a) Bako Tibe district (b) Walmara district (c) Tiyo district (d) Adama district, ONRS, Ethiopia.
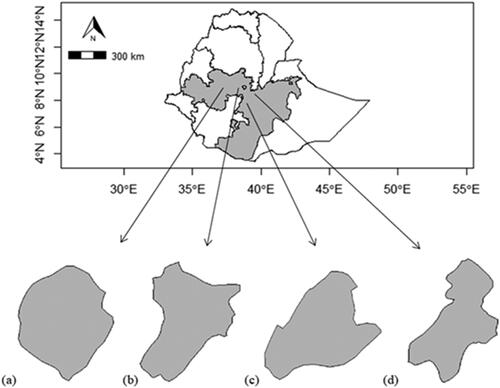
Figure 2. Flow chart of the study design (a) survey on the practices of boiled dry maize (nifro) and roasted dry maize (qollo) processing in the study areas (b) laboratory experiment procedure onto Aspergillus flavus inoculated maize viz. soaking in sterilized distilled water and then boiling in sterilized distilled water or soaking in sterilized distilled water and then roasting based on the study areas practice.
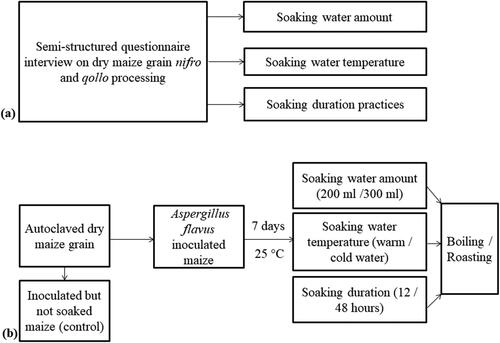
Figure 3. Percentage of the dry maize grain soaking practice while varying the amount of water used (ml), soaking water temperature and time (hours (h)) before boiling or roasting (n = 150). Means followed by the same letter are not significantly different (p > .05).
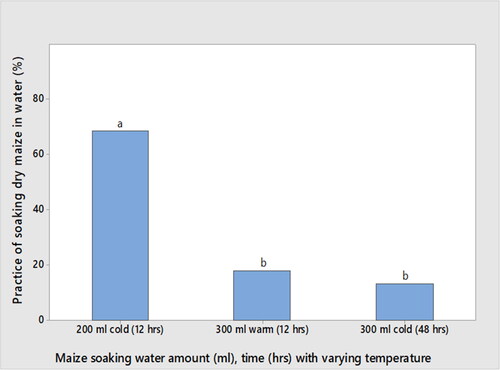
Figure 4. Mean (±SD) of total aflatoxin percentage remained in boiled maize (nifro) compared to the control. Means displayed with different letters are significantly different (p < .05). T5: inoculated and soaked maize with 200 ml of cold water for 48 h and then boiled; T7: inoculated and soaked maize with 300 ml of warm water for 48 h and then boiled; T9: inoculated and soaked maize with 300 ml of cold water for 12 h and then boiled.
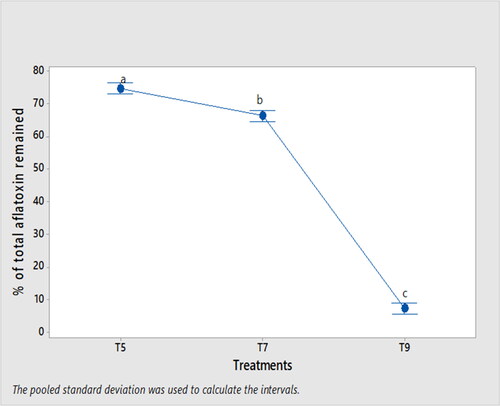
Figure 5. Mean (±SD) of total aflatoxin percentage remained in roasted maize (qollo). Means displayed with different letters are significantly different (p < .05). T4: inoculated and soaked maize with 200 ml of warm water for 12 h and then roasted; T8: inoculated and soaked maize with 300 ml of warm water for 48 h and then roasted; T10: inoculated and soaked maize with 300 ml of cold water for 12 h and then roasted.
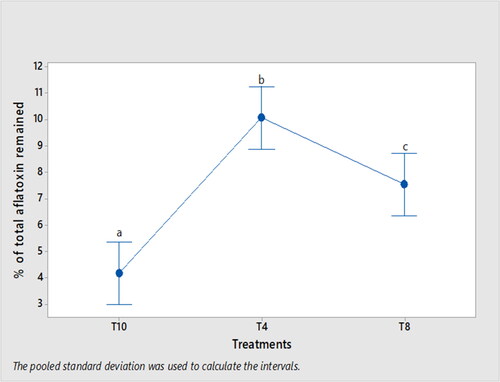
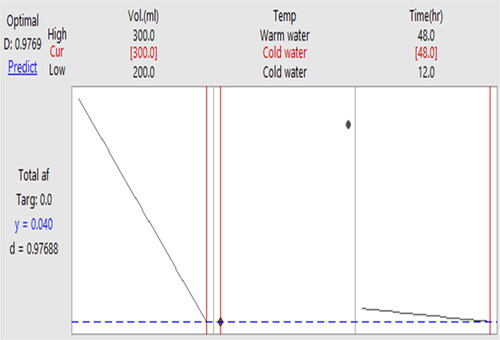
Figure 6. Response Optimizer plot for total aflatoxin reduction in boiled maize (nifro) while varying soaking water volume, soaking water temperature and soaking time.
Data availability statement
Data will be made available on request.