
Figures & data
Table 1. Socio-demographic characteristics of surveyed participants (n = 240).
Figure 1. Primary choice reasons for goat meat’s overall quality mentioned by consumers satisfied with the quality of goat meat (n = 202).
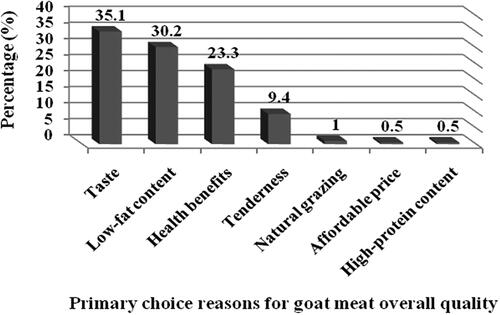
Figure 2. Primary barrier reasons for goat meat’s overall quality mentioned by consumers dissatisfied with the quality of goat meat (n = 38).
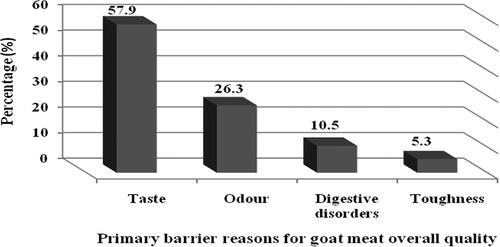
Table 2. Relationship between consumers habits and goat meat consumption willingness.
Table 3. Relationship between consumers’ awareness and goat meat consumption willingness.
Table A1. Questions and responses proposed for the participants in the questionnaire regarding their perceptions and willingness to consume goat meat.