
Figures & data
Table 1. Comparison of SRI recommendations to traditional rice-growing practices observed in study area, with color coding to reflect gender roles (yellow for women’s, blue for men’s) associated with various steps in the Madagascar context (Achandi et al., Citation2018).
Figure 1. Integrated TPB-TAM framework.
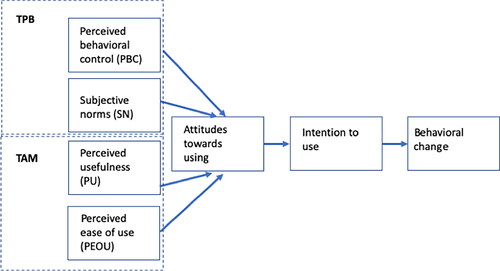
Figure 2. Map of study area. Note: Stars indicate SRI demonstration sites. Blue lines demarcate Manombo Special Reserve. Yellow line is RN12 (paved national road).
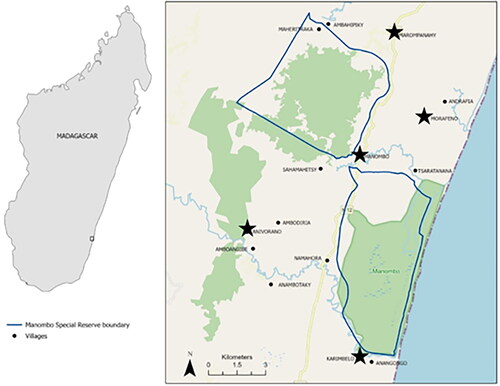
Figure 3. Agreement with statements to measure a) Perceived Usefulness (PU) of SRI, b) Perceived Behavior Control (PBC), and c) subjective norms.
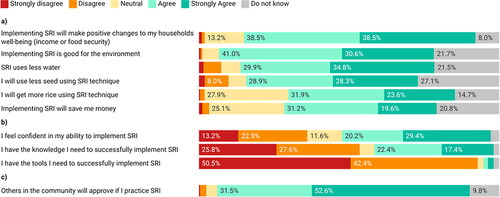
Figure 4. Number of farmers (gender-disaggregated) that stated intention to practice in 2021 compared with those that responded affirmatively to practicing SRI in 2022.
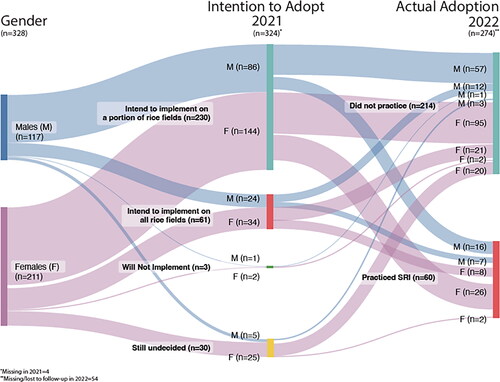
Table 2. Percentage of respondents belonging to SRI adopting and non-adopting households in 2022.
Figure 5. Percentage of rice fields on which SRI adopters trialed the technique.
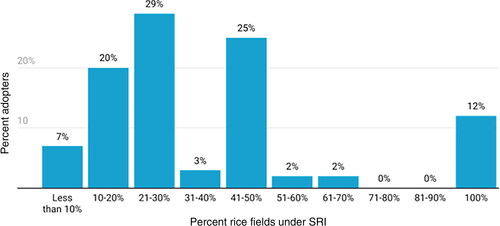
Table 3. Summary table of SRI steps implemented among respondents from SRI adopting households.
Table 4. Focus group (FG) participant explanations for not implementing particular SRI steps.
Figure 6. Median scores on a five-point Likert scale (1 = strongly disagree; 5 = strongly agree) for subjective norm and perceived behavioral control (confidence, tools, knowledge) among adopters before (2021) and after (2022) practicing SRI.
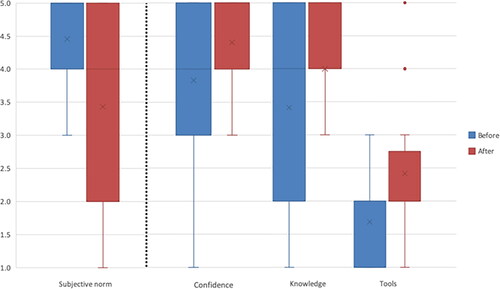
Table 5. Structural equation model results using latent constructs of perceived usefulness (PU) and perceived behavioral control (PBC) as predictors of intention and actual adoption of SRI.
Figure S3_revised.png
Download PNG Image (97.8 KB)
Figure S1.png
Download PNG Image (30.1 KB)
Figure S2.png
Download PNG Image (30.6 KB)
Manuscript_Supplemental Tables.docx
Download MS Word (27.1 KB)Data availability statement
The data that support the findings of this study are openly available in Figshare at http://doi.org/10.6084/m9.figshare.23732466