
Figures & data
Figure 1. Research model.
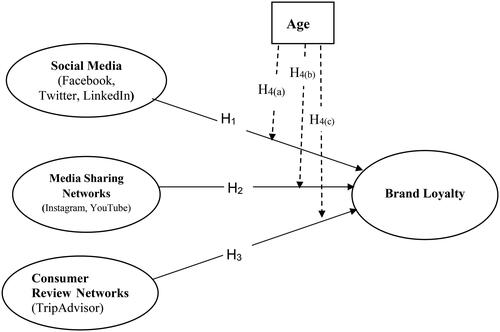
Table 1. The study demography.
Table 2. λ, IIR, CR, α and CRel.
Table 3. Mean (M), standard deviation (SD), AVEs and SICCs.
Table 4. Hypotheses tests results.
Table 5. Coefficients of moderated regression model.
Supplemental material
