
Figures & data
Figure 1. Conceptual framework.
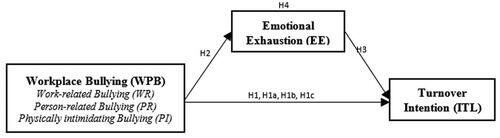
Table 1. Demographic profile of the respondents.
Table 2. Descriptive statistics related to workplace Bullying.
Table 3. Descriptive statistics of variables under study.
Table 4. Reliability, convergent validity.
Table 5. Fornell–Larcker criterion.
Table 6. Heterotrait-Monotrait ratio.
Figure 2. PLS model of study.
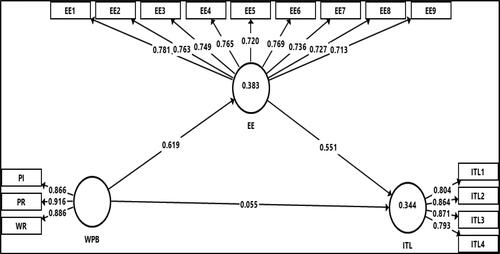
Table 7. Reliability and convergent validity second-order model.
Table 8. Fornell and Larcker criterion – higher-order discriminant validity.
Table 9. HTMT – higher-order discriminant validity.
Table 10. SEM path analysis.
Table 11. Summary of total, direct and indirect effect.
Table 12. Hypothesis testing result.
Table 13. Predictive capability of the model.
Table 14. Effect size.
