
Figures & data
Figure 1. The proposed research model.
Source: Developed by author.
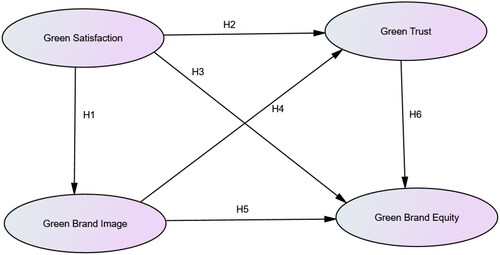
Table 1. Confirmatory Factor Analysis (CFA) model fit.
Table 2. Psychometric properties of the measurement model.
Table 3. Assessment of discriminant validity.
Figure 2. The structural model.
Notes: *** denotes p < 0.001; *denotes p < 0.05; Gr = Green.
Source: AMOS Graphics (survey data).
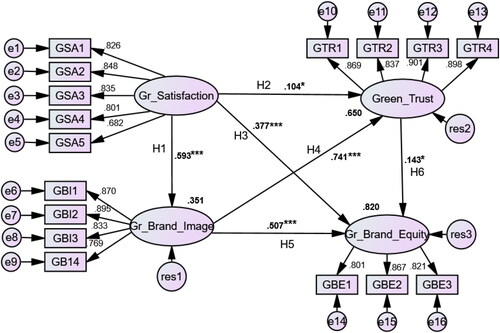
Table 4. Outcomes of hypothesis testing.
Data availability statement
The data used in this research is available at: https://doi.org/10.17632/hmwsrp22yk.1
