
Figures & data
Table 1. Classifications of dimension sensing (S).
Figure 1. Conceptual research model.
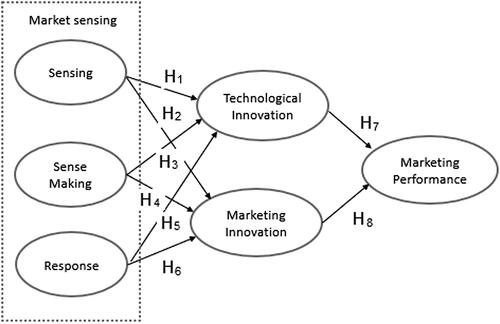
Table 2. Location or area of fashion industry.
Table 3. Result test of instrument.
Figure 2. Outer model.
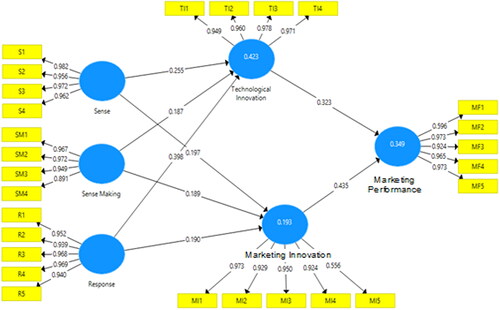
Table 4. Evaluation of the PLS-SEM model.
Table 5. Outer loadings.
Table 6. The average variance extracted (AVE).
Table 7. Cross loadings.
Table 8. Fornell-Larcker.
Table 9. Composite Reliability and Cronbach’s Alpha.
Table 10. R square.
Figure 3. Inner model.
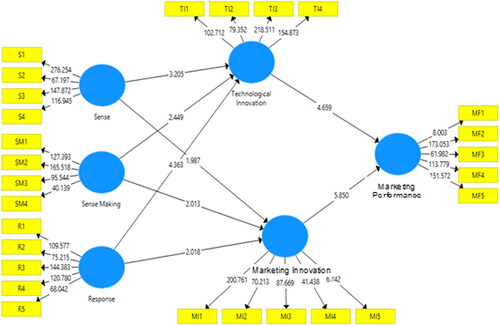
Table 11. Path coefficients.
