
Figures & data
Figure 1. Map showing Tanzania National Parks, game reserves, and conservation areas.
Source: Tanzania National Parks Website.
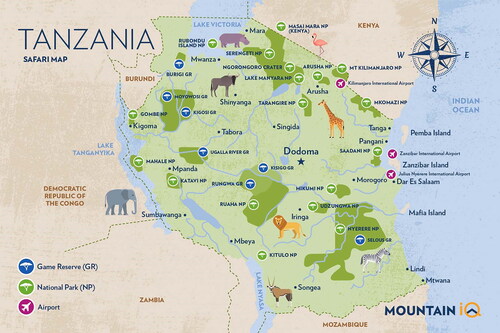
Table 1. Multiple binary logistic regression model with the Box-Tidwell transformation.
Table 2. Collinearity statistics.
Table 3. Residuals statistics.
Table 4. Findings of Hosmer-Lemeshow test for goodness-of-fit.
Table 5. Findings from the multiple binary logistic regression model regarding the demographic characteristics influencing the selection of wildlife attractions.
Table 6. Cross tabulation between tourists’ choices and family size tourists.
Table 7. Cross tabulation between tourists’ choices and income level.
Table 8. Cross tabulation between tourists’ choices and occupation.
Table 9. Choice of wildlife attraction among international repeat tourists residing with only small families (i.e. those tourists residing with <3 family members) and possess lower (<60,000 USD) and higher earning income (adjusted logit).
Data availability statement
This study utilized a dataset, and it can be provided upon request.
