Figures & data
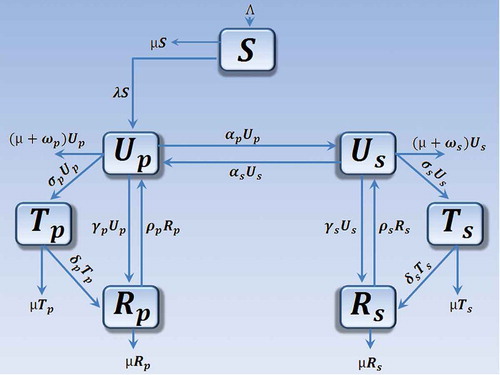
Figure 1. Model flow diagram
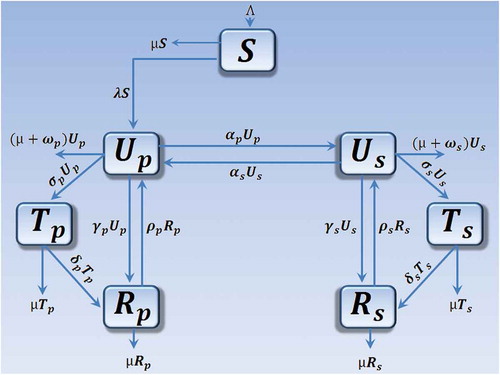
Table 1. Polysubstance use in the Western Cape Province of South Africa for the period a to
a
. Letter “a” represents the first 6 months of the year and “b” represents the last 6 months of the year
Table 2. Parameter values and ranges obtained from data fitting using data for primary substance abusers in Cape Town
Figure 2. (a) System (2.2) fitted to data for primary substance abusers in Cape Town. The blue circles indicate the actual data and the solid red line indicates the model fit to the data. (b) Estimated incidence of primary substance abusers in Cape Town
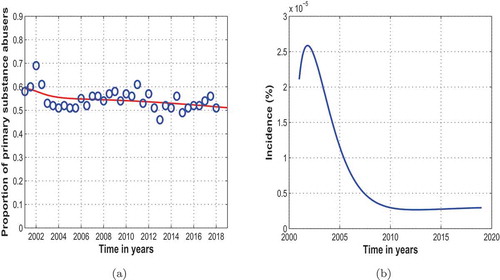
Figure 3. (a) System (2.2) fitted to data for primary substance abusers in Cape Town and projected up to the year 2030. The blue circles indicate the actual data and the solid red line indicates the model fit to the data. (b) Estimated incidence of primary substance abusers in Cape Town and projected up to the year 2030
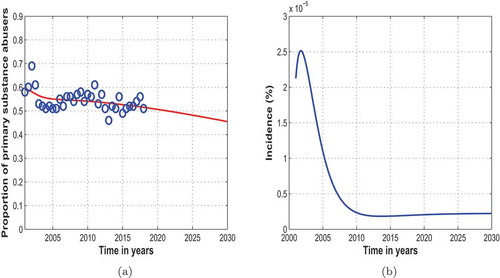
Figure 4. System (2.2) fitted to data for secondary substance abusers and projected up to the year
in Cape Town. The blue circles indicate the actual data and the solid red line indicates the model fit to the data
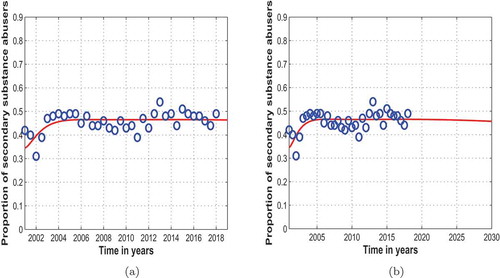
Figure 5. General population trajectory of individuals in class , (a); class
, (b) and class
, (c)
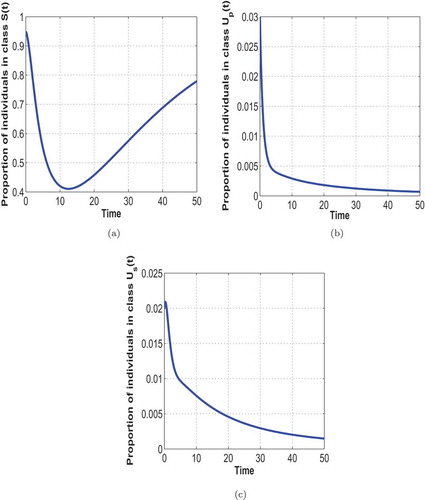
Figure 6. General population trajectory of individuals in class , (a); class
, (b); class
, (c) and class
, (d)
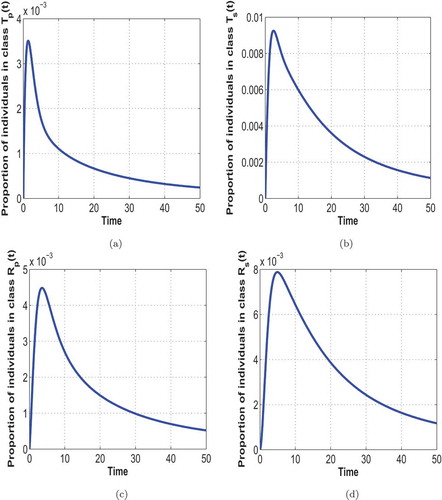
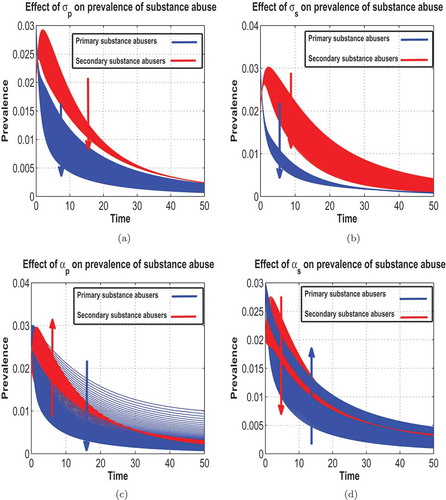
Figure 7. Effects of varying ,
,
,
,
,
and
,
on the prevalence of substance abuse, starting from
up to
with a step size of
across all the parameters