Figures & data
Figure 1. Antagonistic activity of SANA20 toward B. cinerea hyphal growth. (a) SANA20 colony on PSA. (b) Hyphae, conidiophores, and conidia of SANA20 on PSA. Bars, 30 μm. (c) Antagonistic activity of SANA20 toward B. cinerea in in vitro bioassay. B. cinerea was co-incubated with SANA20 using the dual culture technique. (d) Morphology of B. cinerea hyphae in in vitro bioassay. Hyphal tips were ruptured by dual culture with SANA20 (top). Morphology of normal B. cinerea hyphae (bottom). Bar, 200 μm
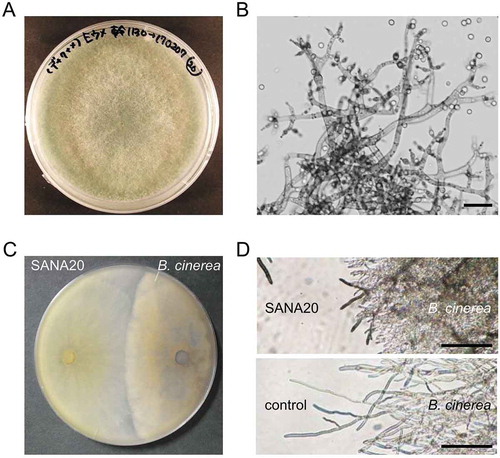
Figure 2. Antagonistic activity of SANA20 toward B. cinerea on cucumber seedlings. (a) Representative symptoms of B. cinerea on leaves treated with SANA20 or sterilized water (control) on days 3, 5, and 7 after incubation. (b) Disease severity index. (c) Disease severity. Bars indicate means ± standard deviations of triplicate experiments (n = 9). Mean values that are statistically different from control (P < 0.01) are indicated by an asterisk
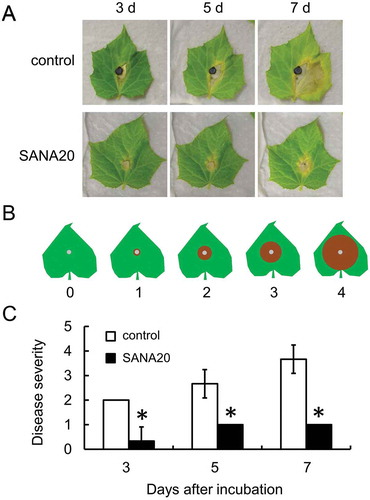
Figure 3. Antagonistic activity of SANA20 culture supernatant toward B. cinerea on detached leaves of cucumber. (a) Representative symptoms of B. cinerea on leaves treated with SANA20 culture supernatant or non-inoculated PSB (control) on days 3, 5, and 7 after incubation. (b) Disease severity. Bars indicate means ± standard deviations of triplicate experiments (n = 9). Mean values that are statistically different from control (P < 0.01) are indicated by an asterisk
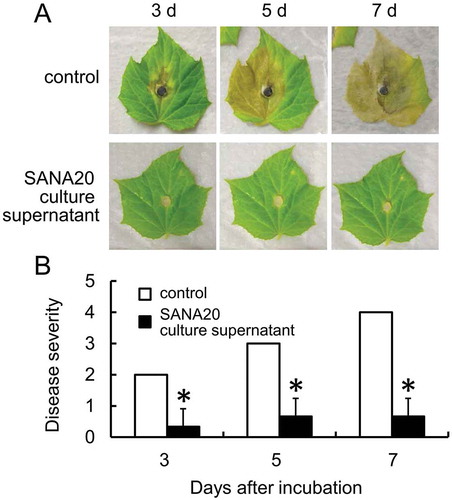
Figure 4. Chitinase production by SANA20. Bars indicate means ± standard deviations of five culture media at the indicated incubation periods (n = 5)
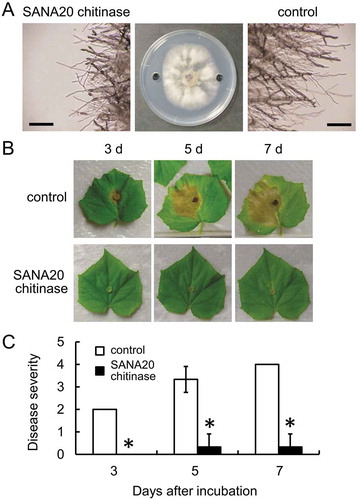
Figure 5. Antagonistic activity of chitinase produced by SANA20 toward B. cinerea on detached leaves of cucumber. (a) Inhibition of B. cinerea hyphal growth by chitinase produced by SANA20. Sterilized water was used as a control. Morphological alteration of B. cinerea hyphae was observed under a light microscope. Bar, 200 μm. (b) Representative symptoms of B. cinerea on leaves treated with chitinase produced by SANA20 or sterilized water (control) on days 3, 5, and 7 after incubation. (c) Disease severity. Bars indicate means ± standard deviations of triplicate experiments (n = 9). Mean values that are statistically different from control (P < 0.01) are indicated by an asterisk