
Figures & data
Figure 1. The pathological features for HER2-positive breast cancer patients. (a) Immunohistopathological staining of HER2 of the breast cancer sections (scale bar, 100 μm). (b) H&E staining of the breast cancer sections (scale bar, 100 μm). (c) Immunohistopathological staining of ki-67 of the breast cancer sections (scale bar, 100 μm). n = 11; data were presented as the representative images.
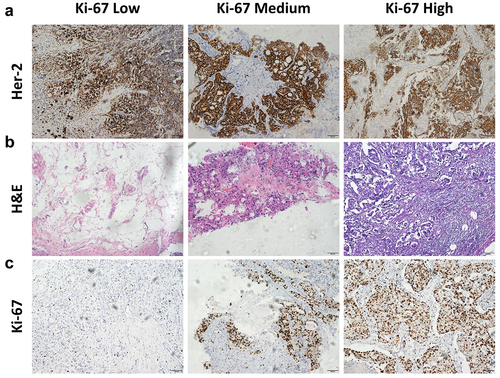
Figure 2. Macrophage hypofunction was closely associated with the efficacy of herceptin on breast cancer. (a) Protein level of inflammatory mediators in the tissue homogenates of breast cancer biopsies, including cytokines, chemokines, and adhesive molecules. (b) The correlation between the percentage of ki-67 and the protein level of MCP-1. (c) The correlation between the percentage of ki-67 and the protein level of IP-10 and IL-8. (d) The correlation between the percentage of ki-67 and the protein level of IL-10. (e) The correlation between the percentage of ki-67 and the protein level of IL-1α. (f) The correlation between the percentage of ki-67 and the protein level of IL-6. (g) The correlation between the percentage of ki-67 and the protein level of MIP-1α. Pearson correlation was performed using GraphPad prism. n = 11; p < .05 was considered statistically significant.
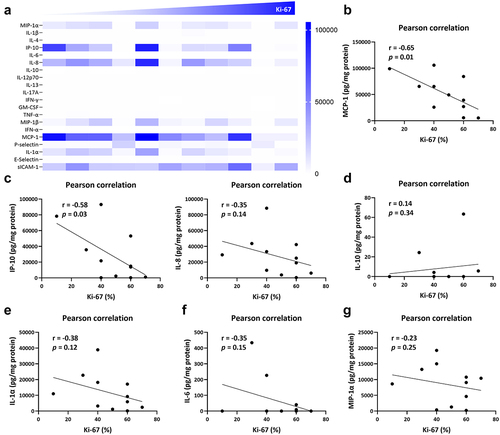
Figure 3. The relationship between macrophages and the survival rate of breast cancer patients. (a) The survival analysis of CD68 in the database of breast cancer in TCGA. (b) The correlation between the CD68 and CXCL-10 (IP-10). (c) The correlation between the CD68 and CCL2 (MCP1). (d) The correlation between the CD68 and IL-6.
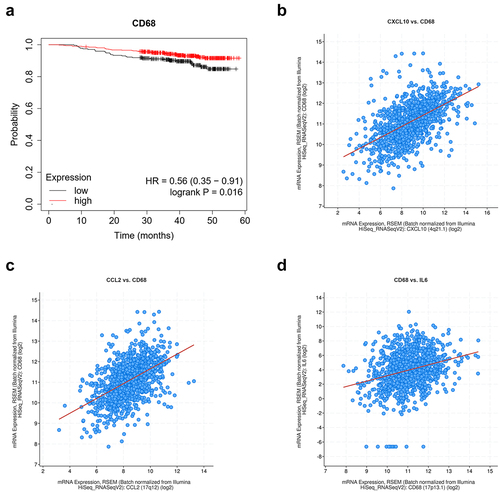
Figure 4. The population and function of macrophages was closely associated with the effects of herceptin on breast cancer. (a) Immunofluorescent staining of macrophages on the tissue sections of breast cancers (scale bar, 50 μm). (b) Immunofluorescent staining of IP-10 on the tissue sections of breast cancers (scale bar, 50 μm). (c) Immunofluorescent staining of IL-6 on the tissue sections of breast cancers (scale bar, 50 μm). Data were presented as the representative images of immunofluorescent staining.
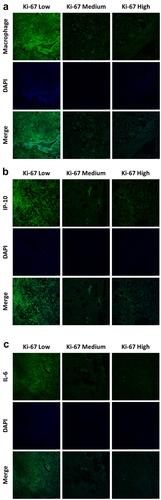
Figure 5. The population of immune cells in peripheral blood merely contributed to the efficacy of herceptin on breast cancer. (a) The correlation between the percentage of ki-67 and the population of leukocytes. (b) The correlation between the percentage of ki-67 and the population of monocytes. (c) The correlation between the percentage of ki-67 and the population of lymphocytes. (d) The correlation between the percentage of ki-67 and the population of neutrophils. (e) The correlation between the percentage of ki-67 and the population of basophils. (f) The correlation between the percentage of ki-67 and the population of eosinophils. Pearson correlation was performed using GraphPad prism. n = 11; p < .05 was considered statistically significant.
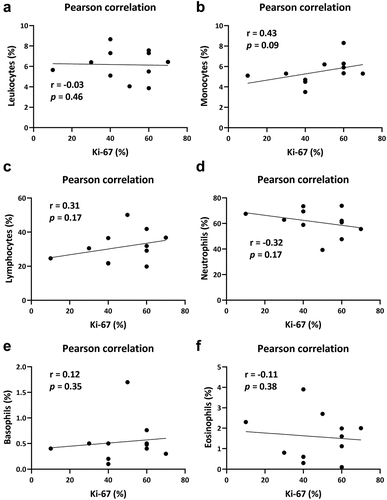
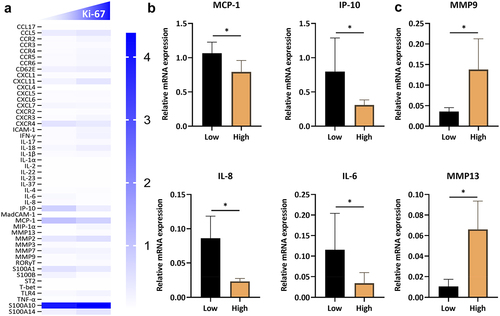
Figure 6. The mRNA expression of several inflammatory mediators in herceptin-defective HER2-positive breast cancer. (c) The mRNA expression profile of inflammatory mediators in the tissue homogenates of breast cancers. (b) The mRNA expression level of MCP-1, IP-10, IL-8, and IL-6 in the ki-67 low and high expression pattern of breast cancer patients. (c) The mRNA expression level of MMP9 and MMP13 in the ki-67 low and high expression pattern of breast cancer patients. Data are presented as mean ± SEM. p < .05 was considered statistically significant.
Revised Supplementary Information.docx
Download MS Word (1.7 MB)Data availability statement
The data sets used and analyzed during the current study are available from the corresponding author on reasonable request.