
Figures & data
Table 1. The thermophysical properties of some phase change material and phase change composite [Citation47–50].
Figure 1. Schematic representation of several different nucleation theories (a) schematic diagram of heterogeneous nucleation on a planar substrate (b) Step-function change of the free-energy density through the interfacial region between the liquid and solid (c) schematic comparison of one-step versus two-step nucleation. Reprinted with permission from ref [Citation61]. Copyright 2016 from American Chemical Society.
![Figure 1. Schematic representation of several different nucleation theories (a) schematic diagram of heterogeneous nucleation on a planar substrate (b) Step-function change of the free-energy density through the interfacial region between the liquid and solid (c) schematic comparison of one-step versus two-step nucleation. Reprinted with permission from ref [Citation61]. Copyright 2016 from American Chemical Society.](/cms/asset/d48670fb-8a3b-4163-82fc-5fcab8a77655/tapx_a_2324910_f0001_oc.jpg)
Table 2. Critical nucleation radius and nucleation potential barrier of five typical phase change materials at a supercooling of 10°C [Citation49,Citation51].
Figure 2. Theoretical explanation and experimental results of the thermal history effect. (a) Retention of embryos on conical cavity and cylindrical cavity [Citation55]. (b) DSC curves with different scanning ranges at a scanning rate of 15°C/min [Citation62]. (c) The relationship of the maximum temperature Tmax and supercooling ΔT [Citation62].
![Figure 2. Theoretical explanation and experimental results of the thermal history effect. (a) Retention of embryos on conical cavity and cylindrical cavity [Citation55]. (b) DSC curves with different scanning ranges at a scanning rate of 15°C/min [Citation62]. (c) The relationship of the maximum temperature Tmax and supercooling ΔT [Citation62].](/cms/asset/6a3f9efc-3398-4199-9ea7-fd6e2f045fdc/tapx_a_2324910_f0002_oc.jpg)
Figure 3. (a) Crystallization process of supercooled gallium of supercooled gallium liquid metal (LM) after a solid gallium seed was placed on the surface of the LM gallium [Citation82]. (b) Freezing point of liquid Ga without nucleating agent (red region) or with nucleating agent [Citation83]. (c) Relationship between supercooling of Ga and equilibration temperature [Citation84]. (d) Evolution of the supercooling reduction for different proportion and types of nucleating agents [Citation62].
![Figure 3. (a) Crystallization process of supercooled gallium of supercooled gallium liquid metal (LM) after a solid gallium seed was placed on the surface of the LM gallium [Citation82]. (b) Freezing point of liquid Ga without nucleating agent (red region) or with nucleating agent [Citation83]. (c) Relationship between supercooling of Ga and equilibration temperature [Citation84]. (d) Evolution of the supercooling reduction for different proportion and types of nucleating agents [Citation62].](/cms/asset/e38431ef-9259-426a-aace-b4b14df049b7/tapx_a_2324910_f0003_oc.jpg)
Figure 4. Schematics of solid–liquid phase change problem.
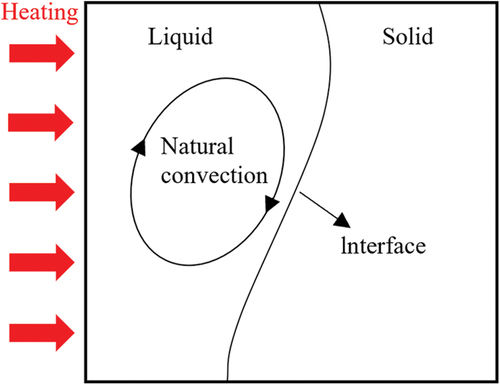
Figure 5. Potential application scenarios of LMPCM in the field of thermal management of electronic equipment.
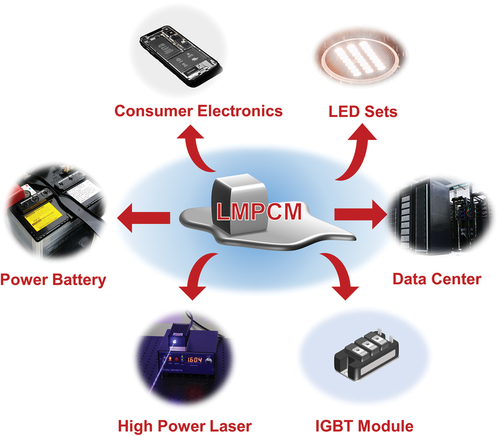
Figure 6. Properties of single liquid metal phase change materials (LMPCMs). (a) Performance comparison of LMPCMs and SA, as well as SA/copper foam phase change composite (PCC) [Citation121] (b) performance comparison of LMPCMs and paraffin/copper PCC [Citation122] (c) performance comparison of LMPCMs and octadecane [Citation123] (d) performance comparison of LMPCMs and octadecanol [Citation124].
![Figure 6. Properties of single liquid metal phase change materials (LMPCMs). (a) Performance comparison of LMPCMs and SA, as well as SA/copper foam phase change composite (PCC) [Citation121] (b) performance comparison of LMPCMs and paraffin/copper PCC [Citation122] (c) performance comparison of LMPCMs and octadecane [Citation123] (d) performance comparison of LMPCMs and octadecanol [Citation124].](/cms/asset/21d47650-521e-47c9-81ed-8ab4ca6002c9/tapx_a_2324910_f0006_oc.jpg)
Figure 7. The effect of combination of LMPCMs with other PCM. (a) Performance range of gallium/octadecane PCC [Citation132]. (b) Comparison of the average bottom surface temperature of paraffin heat sink (PHS), wood alloy heat sink (WHS) and dual-PCM heat sink (DHS) [Citation133]. (c) Temperature variation of solid gallium and PCM [Citation134]. (d) Temperature rising under different gallium filling ratios in the 2-stage phase change heat sink [Citation135].
![Figure 7. The effect of combination of LMPCMs with other PCM. (a) Performance range of gallium/octadecane PCC [Citation132]. (b) Comparison of the average bottom surface temperature of paraffin heat sink (PHS), wood alloy heat sink (WHS) and dual-PCM heat sink (DHS) [Citation133]. (c) Temperature variation of solid gallium and PCM [Citation134]. (d) Temperature rising under different gallium filling ratios in the 2-stage phase change heat sink [Citation135].](/cms/asset/73cf4d2c-9ce1-4214-a96b-90e1a861d07f/tapx_a_2324910_f0007_oc.jpg)
Figure 8. Effect of fins on performance of LMPCM heat sink. (a) The effect of the size of plate fins, cross fins and pin fins on the heat sink performance [Citation11]. (b) The effect of the size of the cross fins on the heat sink desirability [Citation24].
![Figure 8. Effect of fins on performance of LMPCM heat sink. (a) The effect of the size of plate fins, cross fins and pin fins on the heat sink performance [Citation11]. (b) The effect of the size of the cross fins on the heat sink desirability [Citation24].](/cms/asset/4a7729af-a901-4897-9fea-8b161b8e3f3b/tapx_a_2324910_f0008_oc.jpg)
Figure 9. Effect of thermal conductivity enhancing porous matrix on the performance of LMPCM heat sinks. (a) Temperature variations with time for different composite PCM at the heat flux of 7000 W/m2 [Citation25]. (b) Thermal conductivity and latent heat storage density of the composite material with different mass percentage of Wood’s alloy and compacting density [Citation138]. (c) IR images of the thermal buffer [Citation4]. (d) Top-cooled and bottom-cooled GaN device junction temperatures [Citation22]. (e) Velocity distribution of copper foam/47 alloy and temperature curves of different PCM [Citation139].
![Figure 9. Effect of thermal conductivity enhancing porous matrix on the performance of LMPCM heat sinks. (a) Temperature variations with time for different composite PCM at the heat flux of 7000 W/m2 [Citation25]. (b) Thermal conductivity and latent heat storage density of the composite material with different mass percentage of Wood’s alloy and compacting density [Citation138]. (c) IR images of the thermal buffer [Citation4]. (d) Top-cooled and bottom-cooled GaN device junction temperatures [Citation22]. (e) Velocity distribution of copper foam/47 alloy and temperature curves of different PCM [Citation139].](/cms/asset/cd556d1b-3ceb-4ff6-9b77-aa2c3d091e27/tapx_a_2324910_f0009_oc.jpg)
Figure 10. Encapsulation of LMPCMs (a) the schematic diagram of preparation process of the spherical PCM microcapsule and thermal conductivities of the silicone composites with different mass fraction of EBiInSn [Citation26]. (b) Schematic diagram of self-assembly mechanisms with images showing the state transition and mechanical testing and DSC measurement results of EGaIn@Cu. Reprinted with permission from ref [Citation140]. Copyright 2021 American Chemical Society. (c) Nano-encapsulation of liquid gallium-indium eutectic metal alloy with in-situ polymerization method [Citation141]. (d) Experimental procedure for Ga-based micro capsules synthesis [Citation142]. (e) Forming schematic diagram of LM micro capsules [Citation143]. (f) The preparation process of the spherical LMPM-PCM macro-capsules and the effect of spherical LMPM-PCM macrocapsules on the temperature response of convective cooling heat sink [Citation144].
![Figure 10. Encapsulation of LMPCMs (a) the schematic diagram of preparation process of the spherical PCM microcapsule and thermal conductivities of the silicone composites with different mass fraction of EBiInSn [Citation26]. (b) Schematic diagram of self-assembly mechanisms with images showing the state transition and mechanical testing and DSC measurement results of EGaIn@Cu. Reprinted with permission from ref [Citation140]. Copyright 2021 American Chemical Society. (c) Nano-encapsulation of liquid gallium-indium eutectic metal alloy with in-situ polymerization method [Citation141]. (d) Experimental procedure for Ga-based micro capsules synthesis [Citation142]. (e) Forming schematic diagram of LM micro capsules [Citation143]. (f) The preparation process of the spherical LMPM-PCM macro-capsules and the effect of spherical LMPM-PCM macrocapsules on the temperature response of convective cooling heat sink [Citation144].](/cms/asset/57a9ef38-3836-443c-9c55-89b0415905e6/tapx_a_2324910_f0010_oc.jpg)
Figure 11. LMPCM combined series and parallel cooling system and application. (a) LMPM PCM as primary heat sink in series cooling system [Citation151]. (b) LMPM PCM as secondary heat sink in series cooling system [Citation151]. (c) Parallel cooling system [Citation151]. (d) Thermal responses of the low melting point metal/finned heat pipe module under 200 W heating power [Citation152]. (e) Module temperatures as a function of time at 3.65 W [Citation153].
![Figure 11. LMPCM combined series and parallel cooling system and application. (a) LMPM PCM as primary heat sink in series cooling system [Citation151]. (b) LMPM PCM as secondary heat sink in series cooling system [Citation151]. (c) Parallel cooling system [Citation151]. (d) Thermal responses of the low melting point metal/finned heat pipe module under 200 W heating power [Citation152]. (e) Module temperatures as a function of time at 3.65 W [Citation153].](/cms/asset/7fd245e3-4d4e-424e-a67f-b472bd16f9b5/tapx_a_2324910_f0011_oc.jpg)
Figure 12. Liquid metal phase change slurry. (a) Schematic of synthesis process of nanoparticles and HFE7100 jet impingement (56–68°C) heat flux at the flow rate of 7.15 cc/s [Citation155]. (b) DSC curves of bulk Field’s alloy pellets and corresponding nanoparticles with or without surfactant of ethyl carbamate synthesized at 180°C for 3 h [Citation156]. (c) Ga–in nanoparticles with a schematic representation of a core/shell particle fabricated through ultrasonication process and the cumulative stored thermal energy starting at −40°C, including the increased energy from phase change [Citation27].
![Figure 12. Liquid metal phase change slurry. (a) Schematic of synthesis process of nanoparticles and HFE7100 jet impingement (56–68°C) heat flux at the flow rate of 7.15 cc/s [Citation155]. (b) DSC curves of bulk Field’s alloy pellets and corresponding nanoparticles with or without surfactant of ethyl carbamate synthesized at 180°C for 3 h [Citation156]. (c) Ga–in nanoparticles with a schematic representation of a core/shell particle fabricated through ultrasonication process and the cumulative stored thermal energy starting at −40°C, including the increased energy from phase change [Citation27].](/cms/asset/9c0fbad4-4c2b-4382-9eaf-5e6f6f8df925/tapx_a_2324910_f0012_oc.jpg)