Figures & data
Figure 1. Two handover policies to govern the collaborative robot’s behavior. The arrows indicate the Object Transfer Point (OTP) from one handover to the next, as well as the intended motion of the human subject’s center of mass (CoM) around their base of support (BoS).
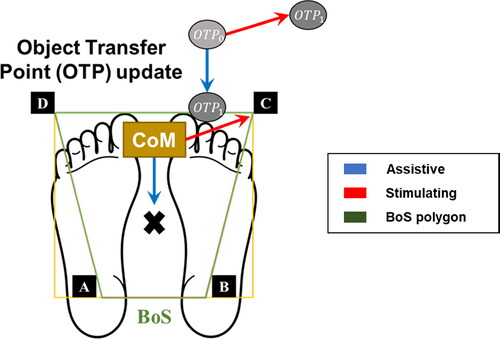
Figure 3. Experimental setup. Top: an overview of how the collaborative robot exchanges packages with a user while human posture is tracked by an external camera. Bottom: a top-down perspective of the experiment workspace.
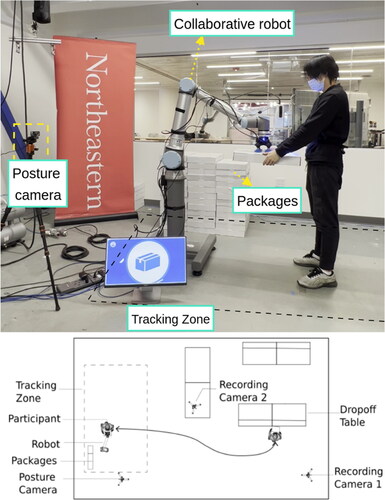
Table 1. Demographic information of the robot-to-human handover study participants. Entries are means (SD).
Figure 4. Box plots of the mean squared velocity and jerk values of participants’ Center of Mass (CoM) per handover.
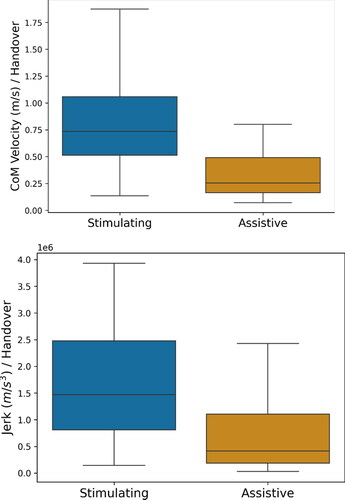
Table 2. Aggregate statistics per handover of participants’ center of mass (CoM) velocities, torso rotation angles, and jerk in movement.
Figure 5. Box plot of the balance stability margins averaged across participant handovers. Larger values signify a more stable posture configuration.
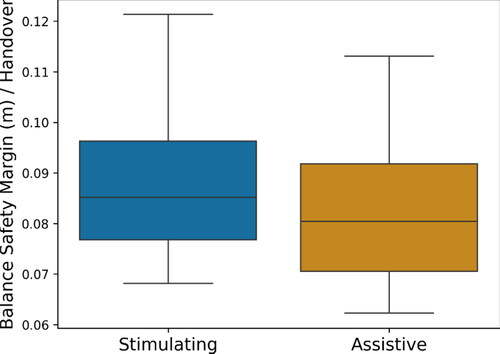
Table 3. Mean and standard deviations per handover of Rapid Entire Body Assessment (REBA) scores for all samples collected across the three experimental conditions.
Table 4. Subjective questionnaire responses, with total NASA-TLX scores (Hart & Staveland, Citation1988), preference, alertness, and frustration choices indicated by experiment mode.
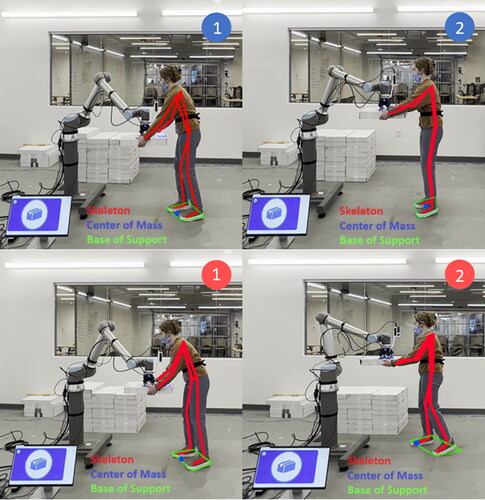
Figure 6. Illustration of the difference between two consecutive handover exchanges using the Assistive mode (top row) and Stimulating mode (bottom row). Less constrained motion is depicted when using the Stimulating mode, where the center of mass displacement is clearly of greater magnitude across the two selected handovers.
