Figures & data
Figure 1. External stimuli induce the secretion of ALVs in B cells (A) Equal numbers of primary B cells were stimulated with the indicated stimuli for 4 days prior to isolation of the exosomes and MVs from supernatants. Whole-cell lysate (WCE), isolated exosomes, and MVs were analyzed by immunoblotting using antibodies (Abs) against ALIX, CD81, CNX, p62, LC3, and β-Actin. (B) Equal numbers of primary cells were stimulated with various cytokines combined with anti-CD40 Ab for 4 days. WCE, isolated exosomes, and MVs were analyzed by immunoblotting using Abs against ALIX, CD81, CD63, CNX, MHC II, p62, LC3, and β-Actin. (C) GFP-LC3+ primary B cells were co-cultured with Th1 cells or Th2 cells at a ratio of 1:1. MVs and exosomes from indicated culture condition were analyzed by immunoblotting using Abs against ALIX, CD81, TSG101, CNX, p62, and LC3. (D) Equal numbers of GFP-LC3–A20 B cells were stimulated with the indicated stimuli for 24 h prior to the isolation of exosomes and MVs from supernatants. Isolated exosomes and MVs were analyzed by immunoblotting using Abs against ALIX, CD63, and LC3. (E) Representative TEM images of MVs and exosomes from GFP-LC3+ primary B cells stimulated with IL-4:LPS or IL-4:CD40. EVs were prepared as in (A) and (B). GFP-LC3 was probed with anti-GFP Abs and labeled with 10-nm nanogold-conjugated secondary Abs. EVs from GFP-LC3− primary B cells were used as staining control. Scale bars, 100 nm. All experiments were repeated at least twice and showed similar results.
Figure 2. Fused-type ALVs circulate in the bloodstream (A) Proposed types of ALVs during plasma membrane shedding or budding. Left, autophagosome is engulfed by the plasma membrane. Right, the outer membrane of autophagosome is fused with plasma membrane. (B) Exosomes and MVs from IL-4:CD40-stimulated B cells were incubated with anti-mouse (αMo) IgG-conjugated beads or control beads. Washed beads bound to EVs and supernatants obtained after capturing were analyzed by immunoblotting using Abs against LC3, ALIX, CD81, and TSG101. Anti-rabbit (αRbt) IgG-conjugated beads were used as capturing control beads. (C, D) MVs from IL-4:CD40-stimulated B cells were incubated with anti-MHC class II-conjugated beads (C) or anti-LC3-conjugated beads (D). Washed beads bound to EVs and supernatants obtained after capturing were analyzed by immunoblotting using Abs against p62, LC3, ALIX, CD81, and TSG101. Isotype Abs-conjugated beads were used as capturing control beads. (E) EVs from sera of mice bearing GFP-LC3–A20 tumors were captured by αMo IgG beads, and both beads and supernatants were analyzed by immunoblotting using Abs against LC3 and ALIX. Ctrl.: control mice; P: pooled sera from three tumor-bearing mice; Mo.: individual tumor-bearing mouse; Ex: individual experiment. (F) EVs were purified from equal plasma volumes of four healthy human donors and analyzed by immunoblotting using Abs against ALIX, TSG101, and LC3.
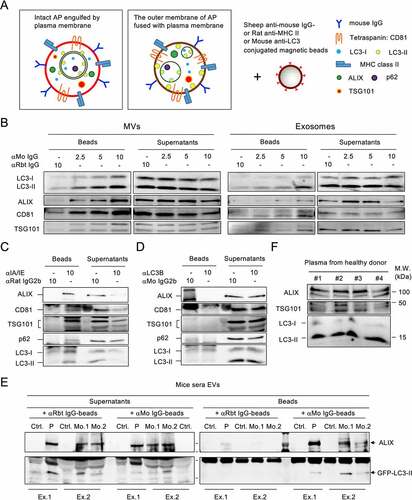
Figure 3. Fusion activity between autophagosome and lysosome contributes to ALV secretion (A) Representative confocal images of GFP-LC3+ dots (green) and lysotracker-labeled lysosomes (red) at different time points in GFP-LC3+ primary B cells stimulated with IL-4:LPS or IL-4:CD40 for 3 days. The white arrowheads indicate colocalization of GFP-LC3+ (green) and lysotracker+ (red) dots. Scale bar, 5 µm. Similar results were observed from two independent experiments. (B) The colocalization analysis in (A). Pearson’s correlation coefficient was used for quantifying the colocalization between GFP-LC3 and lysotracker at each time points. n = 5 GFP-LC3+lysotracker+ cells. (C) Representative fluorescence images from GFP-LC3+ primary B cells stained with lysotracker and anti-EEA1 Ab after 4 days of IL-4:LPS or IL-4:CD40 co-stimulation. Similar results were observed from two independent experiments. The white arrows indicate colocalization of GFP-LC3+ and lysotracker+ dots or EEA1+ dots in IL-4:LPS-stimulated or IL-4:CD40-stimulated cells, respectively. Scale bars, 5 μm. (D) The colocalization analysis in (C). Pearson’s correlation coefficient was used for quantifying the colocalization. (E) Representative TEM images of primary B cells stimulated with IL-4:LPS or IL-4:CD40 for 4 days. 7-AAD− B cells were sorted using a cell sorter and analyzed by TEM. AL: autophagosome; L: lysosome; AP: autophagosome. Scale bars, 1 μm. Similar results were observed from two independent experiments. (F) Quantification of AP and AL numbers in (E). (G) Primary B cells were stimulated with indicated stimuli for 4 days. Then, cells were harvested and equal cell numbers were treated with 200 nM Baf A1 for another 4 to 5 h prior to the isolation of exosomes and MVs. WCE, isolated exosomes, and MVs were analyzed by immunoblotting using Abs against ALIX, CD81, SQSTM1/p62, LC3, and β-Actin. (H) Quantification of autophagic flux in (G). Autophagic flux was calculated by subtracting the densitometric value of LC3-II normalized with loading control in DMSO-treated samples from that of Baf A1-treated samples. Data were pooled from five independent experiments. (I) Fold increases in the densitometric values of LC3-II normalized with ALIX in the MV fractions of (G). Data were pooled from three independent experiments. Data are presented as mean ± SEM (B, D, F, and I) or before-after with symbols and lines (H). Two-tailed unpaired t-tests (B and I). Two-way ANOVA plus Šídák’s multiple comparisons test (D). Mann-Whitney test (F). Two-tailed paired t-tests (H). ns: not significant, *p < 0.05, **p < 0.01, ***p < 0.001.
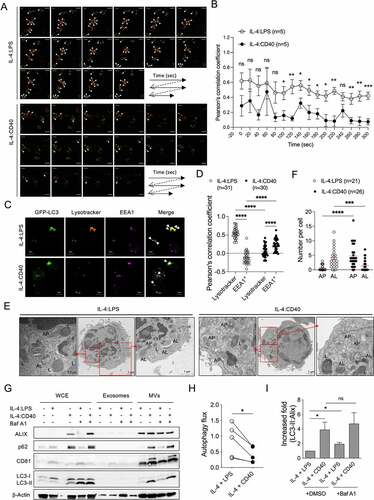
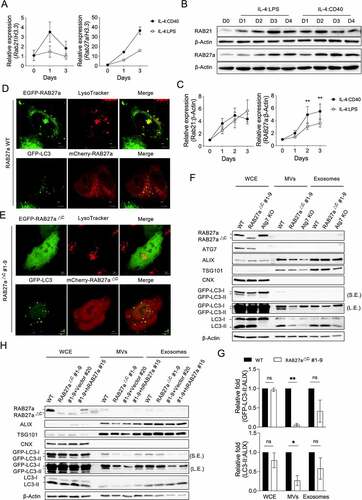
Figure 4. RAB27a mediates ALV secretion (A) RT-qPCR analysis of Rab21 and Rab27a from primary B cells stimulated with IL-4:LPS or IL-4:CD40 for the indicated times. The quantitative data are presented as mean ± SD from three technical repeats. Similar results were observed from four independent experiments. (B) Representative immunoblotting of RAB21 and RAB27a proteins in primary B cells stimulated with IL-4:LPS and IL-4:CD40 for the indicated times. The numbers below indicate the protein levels normalized with loading control β-Actin. (C) Densitometric quantification of RAB21 and RAB27a expression in (B). Data were pooled from six independent experiments. (D) EGFP-RAB27a or mCherry-RAB27a plasmid was transfected into either WT or GFP-LC3+ Hela cells for 24 h. Lysosomes were labeled by lysotracker 30 min prior to live-cell observation using a confocal microscope. Scale bar, 5 μm. (E) EGFP- or mCherry-RAB27a∆C #1-9 plasmids were transfected into either WT or GFP-LC3+ Hela cells for 24 h. Lysosomes were labeled by lysotracker 30 min prior to live-cell observation using a confocal microscope. (F) Equal numbers of WT, RAB27a∆C, or ATG7 KO GFP-LC3–A20 cells were cultured for 72 h prior to isolation of the exosomes and MVs from supernatants. WCE, isolated exosomes, and MVs were analyzed by immunoblotting using Abs against ATG7, ALIX, TSG101, CNX, LC3, and β-Actin. S.E. and L.E. indicate short and long exposure, respectively. (G) Fold changes of the densitometric values of GFP-LC3 and LC3-II normalized with ALIX in the WCE, exosomes, and MV panels of (F). Data were pooled from three independent experiments. (H) RAB27a∆C #1-9 A20 cells were reconstituted with human WT RAB27A. Equal numbers of the indicated cells were cultured for 72 h prior to isolation of the exosomes and MVs from supernatants. WCE, isolated exosomes, and MVs were analyzed by immunoblotting using Abs against ALIX, TSG101, CNX, LC3, and β-Actin, respectively. Data are presented as mean ± SEM (C, G). Both factors-matched two-way repeated measurement ANOVA with Šídák’s multiple comparisons test (C). Two-tailed paired t-tests (G). ns: not significant, *p < 0.05, **p < 0.01.