
Figures & data
Figure 1. Locations of the 17 CMAs included in the analysis.
Note: Moncton, Fredericton, and Saint John were combined into one CMA for sampling purposes.
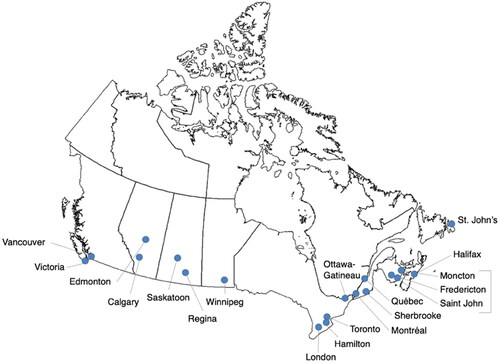
Table 1. Hypothesized explanatory variables of acceptability that were included in statistical models.
Table 2. Descriptive statistics of THEPA survey participants by CMA and individual- and neighbourhood-level characteristics, compared to distributions from the 2016 Canadian census.
Figure 2. Level of agreement with five built environment interventions examined THEPA survey, weighted n = 26,534, fall 2020.
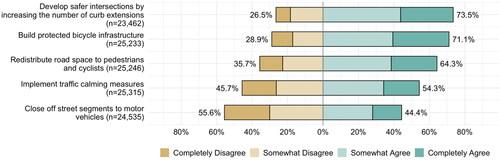
Table 3. Weighted counts and percentages of agreement with five built environment interventions examined in the THEPA survey, weighted n = 26,534, fall of 2020.
Figure 3. Weighted Likert plots showing level of agreement with five built environment interventions across 17 CMAs in Canada.
Note: CMAs are ordered from east to west.
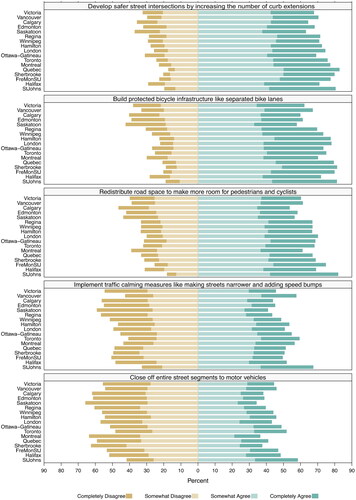
Table 4. Final multilevel logistic regression models with imputed data showing odds ratios and 95% confidence intervals for expressing agreement (somewhat or completely) with the implementation of five built environment interventions.
Table A1. Final multilevel logistic regression models with imputed data showing odds ratios and 95% confidence intervals for expressing complete agreement with the implementation of five built environment interventions.
Table A2. Final multilevel logistic regression models with imputed data showing odds ratios and 95% confidence intervals for expressing complete disagreement with the implementation of five built environment interventions.