
Figures & data
Figure 1 (A) Non cuspal coverage and (B) cuspal coverage cavity design.
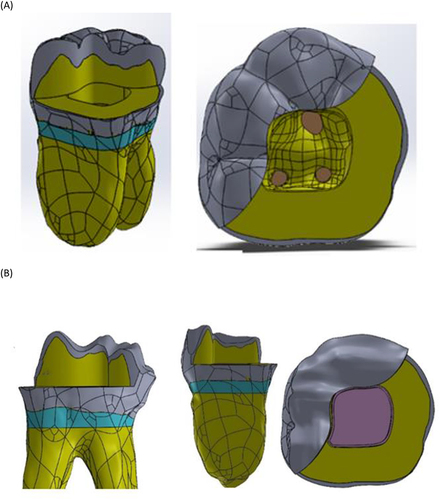
Figure 2 Components of 3D direct restoration reinforced fiber composite (A) non-cuspal coverage and (B) cuspal coverage.
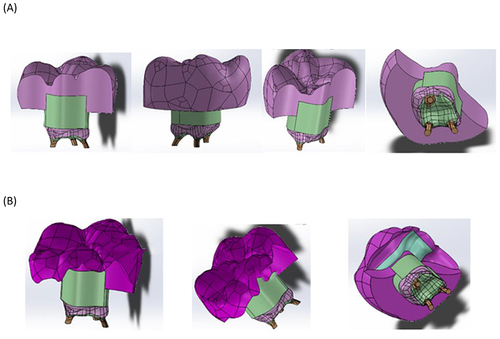
Table 1 The Criteria of Cavity Design
Table 2 Placement of the Restoration Materials on the Molar Cavity Without Mesiolingual Walls
Table 3 Mechanical Properties of Tooth and Materials Restoration
Table 4 The Strength Properties of Adhesive Material
Figure 3 The loading zone (A) vertical force and (B) oblique force are represented by the red region.
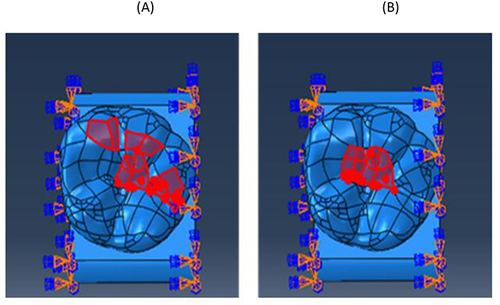
Table 5 Maximum and Minimum Principal Stress on Non-Cuspal Coverage Restoration Used Polyethylene Fiber
Table 6 Maximum and Minimum Principal Stress on Non-Cuspal Coverage Restoration Using e-Glass Fiber
Table 7 Maximum and Minimum Principal Stress on Cuspal Coverage Restoration Used Polyethylene Fiber
Table 8 Maximum and Minimum Principal Stress on Cuspal Coverage Restoration Using e-Glass Fiber
Figure 4 The black dashed circles is the location of high-stress concentration on a fiber-reinforced composite of polyethylene non-cuspal coverage (PNCC). The red area is the maximum principal stress on the surface of the restoration when a vertical force (above) and an oblique force (below). The blue area is the minimum principal stress on the surface of the restoration when a vertical (above) and an oblique force (below).
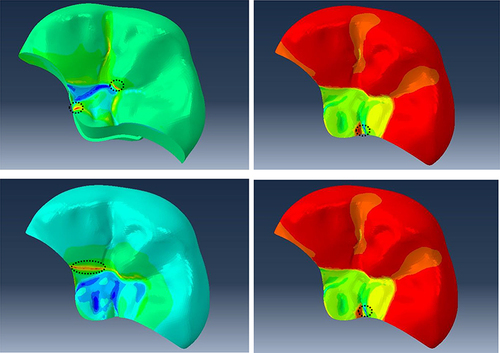
Figure 5 The black dashed circles is the location of high-stress concentration on a fiber-reinforced composite of e-glass fiber non-cuspal coverage (ENCC). The red area is the maximum principal stress on the surface of the restoration when a vertical force (above) and an oblique force (below). The blue area is the minimum principal stress on the surface of the restoration when a vertical (above) and an oblique force (below).
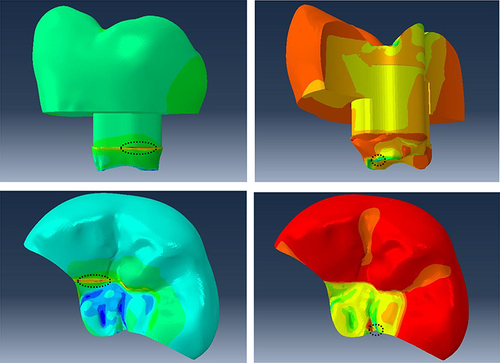
Figure 6 The black dashed circles is the location of high-stress concentration on a fiber-reinforced composite of polyethylene cuspal coverage (PCC). The red area is the maximum principal stress on the surface of the restoration when a vertical force (above) and an oblique force (below). The blue area is the minimum principal stress on the surface of the restoration when a vertical (above) and an oblique force (below).
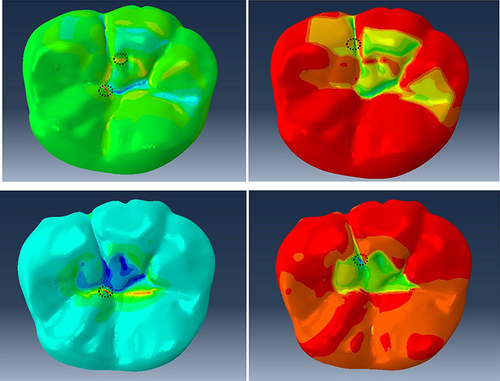
Figure 7 The black dashed circles is the location of high-stress concentration on a fiber reinforced composite of e-glass fiber cuspal coverage (ECC). The red area is the maximum principal stress on the surface of the restoration when a vertical force (above) and an oblique force (below). The blue area is the minimum principal stress on the surface of the restoration when a vertical (above) and an oblique force (below).
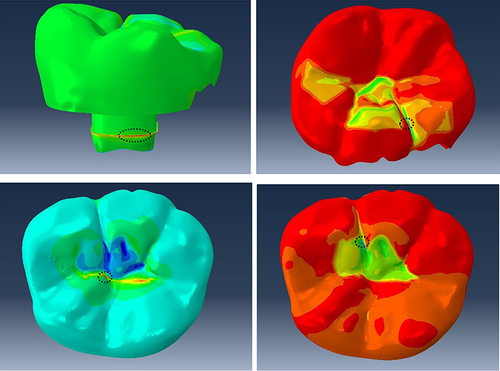
Figure 8 Shows where high-stress concentrations are found on the PNCC interfacial surface. The restoration underwent a debonding initiation, as indicated by the dashed black circle, wherein the contact stress ratio reached a value of 1 at the enamel fissure.
Figure 9 Shows where high-stress concentrations are found on the ENCC interfacial surface. The restoration underwent a debonding initiation, as indicated with the dashed black circle, wherein the contact stress ratio reached a value of 1 at the distal region on the base fiber.
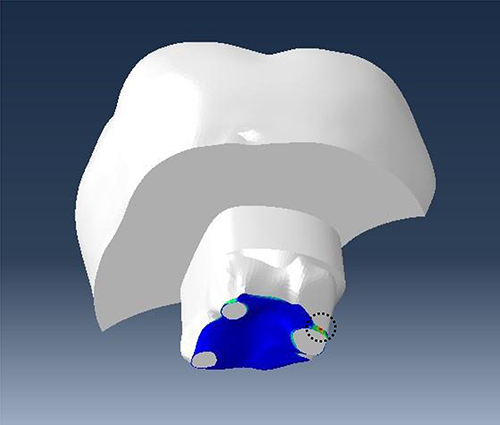
Figure 10 Shows where high-stress concentrations are found on the PCC interfacial surface. The restoration underwent a debonding initiation, as indicated with the dashed black circle, wherein the contact stress ratio reached a value of 1 at the fiber occlusal between the enamel and the restoration.
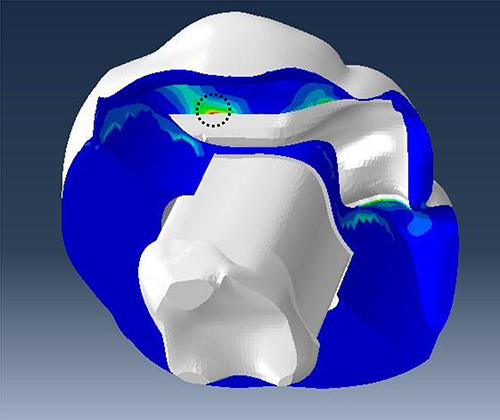
Figure 11 Shows where high-stress concentrations are found on the ECC interfacial surface. The restoration underwent a debonding initiation, as indicated with the dashed black circle, wherein the contact stress ratio reached a value of 1 at the distal region on the base fiber.
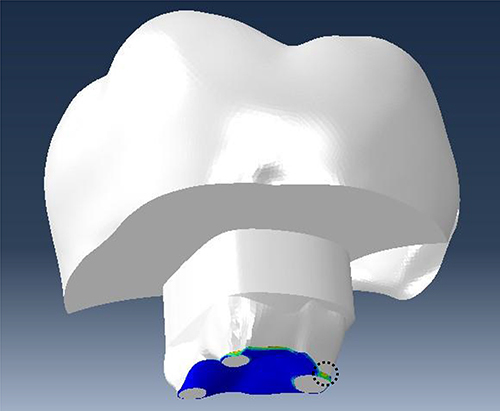
Table 9 The Initiation Damage Criterion