
 ?Mathematical formulae have been encoded as MathML and are displayed in this HTML version using MathJax in order to improve their display. Uncheck the box to turn MathJax off. This feature requires Javascript. Click on a formula to zoom.
ABSTRACT
To evaluate the peel resistance of a device wherein a polyimide (PI) sheet is bonded to a curved surface with a pressure-sensitive adhesive (PSA) experimentally and analytically, we applied a mechanical simulation considering the viscoelasticity of the pressure-sensitive adhesive (PSA) and the fracture energy of the bonding interface. The mechanical behavior against the local load applied on the PI sheet surface was evaluated using this simulation. To verify the accuracy of this simulation, we fabricated a local load tester that could apply a load to a local area of 8 mm in diameter and compared the mechanical behavior with the simulation results. Dynamic mechanical analysis of the PSA with a film thickness of 19 μm was performed using the nanoindentation technique. The generalized Maxwell model parameters were estimated by fitting the relaxation elastic modulus E(t) to conduct a mechanical simulation. For the double cantilever beam test to derive the interfacial fracture energy, soft PI sheets were reinforced with Al substrates. As a result of these analyses, it was confirmed that the relationship between the displacement and load obtained by this simulation agrees well with the actual local load test. This technique is useful for predicting the bonding strength of complex-shaped devices fabricated using soft adherends and adhesives.
1. Introduction
As electronic products become more multi-functional, there are expectations for the device structure in which soft resin sheets, such as protection films, optically functional films, or flexible printed circuits, are adhesively bonded to curved parts. For these devices, the bonding strength when a local load is applied is an important metric for ensuring reliability in practical use. For instance, a protection film bonded with pressure-sensitive adhesive (PSA) on the surface of a curved display with a touch panel can be regarded as the case. In this case, the swipe force by a finger may peel off the protection film. However, simple bulk tests cannot evaluate the peel resistance against local loads; therefore, new experiments and mechanical simulation analyses are required to design these devices.
PSAs are often used to fit and bond resin sheets to curved parts for their flexibility. In these structures, peeling at the bonding interface is a major concern. Considering the deformation reflecting the viscoelasticity of the PSA when predicting the peeling behavior via mechanical simulation is necessary because of its soft mechanical properties.
Regarding the effect of the viscoelasticity of adhesives on crack propagation, some reports have discussed the rate dependence of fracture energy by considering the effect of energy dissipation due to the viscoelasticity at the crack tip of the cohesive zone model (CZM).[Citation1,Citation2] In interfacial delamination, the viscoelastic deformation in the bulk region of the adhesive and the peeling behavior at the bonding interface can be modeled separately, allowing for the peeling behavior to be calculated more easily and accurately from the practical point of view.
In this study, we aimed to establish a method to predict the bonding strength of a resin sheet bonded with PSA on the curved surface of an adherend. For this purpose, we developed an experimental set-up to observe the peeling process of the bonding joint between the resin sheet and the curved adherend and conducted some experiments to measure the load related to the peeling off. The viscoelastic properties of a PSA and the fracture energy of the bonding interface were experimentally measured, and mechanical simulations of peeling off of the resin sheet from the curved adherend were performed when a concentrated load was applied to the film parallel to the surface. A polyimide (PI) sheet was utilized as the sheet, and it was bonded to the curved surface of a polymethyl methacrylate (PMMA) adherend with an acrylic PSA. Here, the viscoelasticity of the adhesive was depicted by the generalized Maxwell model,[Citation3,Citation4] and the peel propagation at the bonding interface was simulated by finite element analysis (FEA) using the cohesive zone model (CZM).[Citation5] For us to verify the accuracy of this simulation, the prediction was compared to the experimental results, and a reasonably good agreement between them was obtained.
2. Experimental
2.1. Materials and specimen
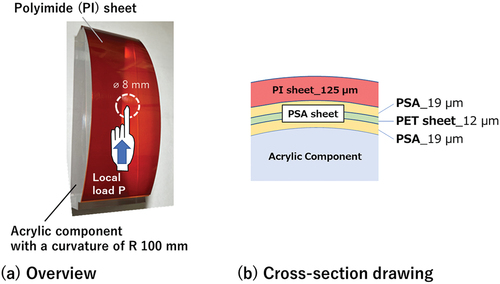
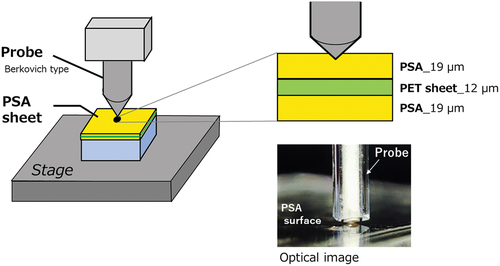
We used a Polyimide (Kapton®, DuPont, USA) film with thickness of 125 μm as the bonded resin sheet, an Acrylic PSA film (NeoFix 50, NEION Film Coatings Corp., Japan) as the adhesive, and an ordinary PMMA block as an adherend. The PSA sheet had a structure in which 19 μm thick PSA films sandwich a 12 μm thick PET film, as shown in . The specimens used for the peeling-off tests comprised the PI sheet, the PSA film, and an adherend made by the PMMA block having a curved surface with a curvature of 100 mm, as shown in .
Figure 1. Analysis sample: a polyimide (PI) sheet bonded to the curved surface of an acrylic component with a PSA sheet.
2.2. Experimental set-up
An experimental set-up was designed to observe the peeling-off phenomena and measure the load for the above-mentioned specimen. shows the details of the set-up. The specimen was placed and fixed to a pedestal that could slide up and down, and the moving part was loaded by a mechanical testing machine (AGX-V 50kN, Shimazu, Japan). The load and displacement were measured by the mechanical testing machine.
Figure 2. Load tester fabricated to apply a local load to the sample in which a PI sheet is adhesively bonded on the curved acrylic component.
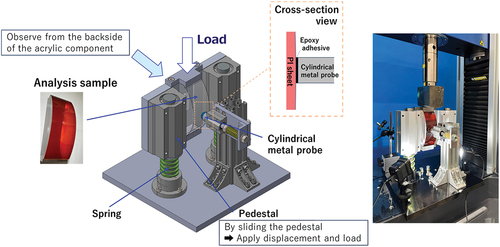
The PI sheet of the specimen was bonded with an epoxy adhesive (Denatite 2204, Nagase ChemteX, Japan), whose strength exceeded that of the PI sheet/PSA interface, to the tip of a cylindrical metal probe, which was fixed vertically and laterally and it could move only in the perpendicular direction to the surface of the specimen. We evaluated the peeling behavior when an area of 8 mm in diameter on the surface of the PI sheet was bonded and fixed, and a local shearing load was generated.
By monitoring the displacement and the load of the pedestal, we can obtain the relationship between the displacement and load at the probe tip. In this case, we used data from the mechanical testing machine. As the stiffnesses of the testing machine and the set-up were high and the applied load was small, the displacement could be believed. On the other hand, the measured load by the testing machine included forces absorbed by springs installed in the set-up. In order to obtain the load applied to the specimen, spring loads were calculated from the spring constants and the displacement, and they were used for load compensation.
To evaluate the local peeling of the PI-sheet/PSA interface, we observed the contrast change of the bonding interface from the back side of the transparent acrylic component.
2.3. Material properties
2.3.1. Mechanical properties of the polyimide sheet
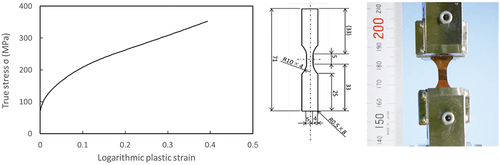
A tensile test was performed on a dumbbell-shaped sample of the PI sheet, as shown in , to obtain the mechanical properties of the PI sheet. The strain of the test piece for the tensile load was analyzed by an image processing method, by which lines marked on the specimen surface were traced, and the gaps between the lines were measured by software (PFA, Photron FASTCAM Analysis, Japan). The strain was calculated from the data. shows the plastic property of the PI sheet obtained by the tensile test. The elastic modulus and Poisson’s ratio evaluated in the range of small strain prescribed by the standards were 4.0 GPa and 0.35, respectively. As the PI sheet used in this study has a thin sheet thickness of 125 μm, large deformation is likely to occur when a local load is applied. In the mechanical simulation, we focused on the plastic strain when peeling the PI sheet against the local load.
Figure 3. Plastic property of the PI sheet obtained from the tensile test with the dumbbell-shaped specimen.
2.3.2. Viscoelastic properties of the PSA
As a viscoelastic model for the PSA, we adopted the generalized Maxwell model,[Citation3,Citation4] which combines springs and dashpots with different relaxation times, as shown in . In the generalized Maxwell model, the Prony series shown in Eq. (1) expresses the stress relaxation response. E(t), which changes with time, is called the relaxation modulus. Here, Ei and τi in the Prony series represent the spring constant and the relaxation time of element i, respectively.
Figure 4. Generalized Maxwell model representing the viscoelasticity of the PSA used in this study.
Dynamic mechanical analysis (DMA) of the PSA with a film thickness of 19 μm was performed with temperature from −50 to 80°C using nanoindentation technique (TI 980 Triboindenter, Bruker). shows a schematic diagram of nanoindentation measurement. A sharp tip probe (Berkovich type) was brought into contact with the outermost layer of the PSA. By evaluating the probe response against sinusoidal loads (frequency: 1 to 100 Hz), the storage modulus E’ and the loss modulus E” can be obtained.[Citation6,Citation7] Here, the complex elastic modulus E(ω), which expresses the frequency dependence of viscoelasticity, is defined by Eq. (2) using E’ and E”.
Figure 5. Schematic of the nanoindentation measurement of the PSA.
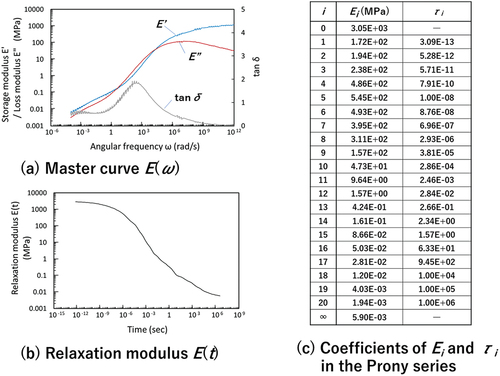
In this study, by applying the temperature-time superposition law[Citation8,Citation9] with respect to the reference temperature of 25°C, we derived the master curve showing E(ω) for wide frequency response. shows the master curve of the PSA obtained by this analysis. Fourier transform relationships exist between the relaxation modulus E(t) and the complex modulus E(ω).[Citation10] Specifically, by Fourier transforming the Prony series equation for E(t) and fitting it to the experimentally obtained E(ω), the coefficients of Ei and τi in the Prony series were determined. The number of elements n of the generalized Maxwell model was set to n = 20 to accommodate a wide range of stress relaxation times. shows the relaxation modulus E(t) of the PSA, and shows the values of Ei and τi obtained by the fitting. Inputting these values as the simulation parameters allows us to perform a mechanical simulation considering the viscoelasticity of the PSA.
Figure 6. Viscoelastic analysis results of the PSA: (a) master curve E(ω), (b) relaxation modulus E(t), and (c) coefficients of Ei and τi in the prony series.
2.3.3. Fracture energy of the adhesive joint
showcases the specimens for mechanical tests required to derive the parameters of CZM. By general double cantilever beam (DCB) tests for deriving the fracture energy GIC,[Citation11,Citation12] tensile loads cannot be directly applied to soft PI sheets. Therefore, we prepared the DCB test piece in which the PI sheets were reinforced by 1 mm thick Al substrates, as shown in . Tensile loads were applied to the Al substrates for the DCB test. Al substrates and PI sheets are bonded using an epoxy adhesive with higher bonding strength than the PSA to prevent delamination at the Al-substrate/PI-sheet interface during the DCB test. As the result of the DCB test at 1 mm/min in a separation rate, the GIC of the PI-sheet/PSA interface was derived as 400 J/m2.
Figure 7. Schematic of the specimens for mechanical tests required to derive cohesive zone model (CZM) parameters.
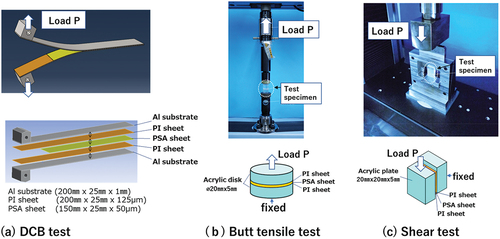
To derive the maximum stress σmax for the opening mode (mode 1) and shear mode (mode 2), the butt tensile test shown in and the shear test shown in were performed. This shear test is the method indicated by ISO6238 and JIS K 6852 to determine the shear strength of wood-to-wood adhesive bonds. We applied this method to our sample in which PI sheets reinforced with an acrylic plate were bonded with PSA. In both tests, the stress concentration effect caused by the deformation of test pieces was suppressed by reducing the area of the adherend. The maximum stress σmax was derived by converting the maximum load obtained from each test into the stress per unit area. In both tests, the displacement rate was set at 1 mm/min. As a result of these tests, σmax was derived at 2.2 MPa in mode 1 and 3.4 MPa in mode 2.
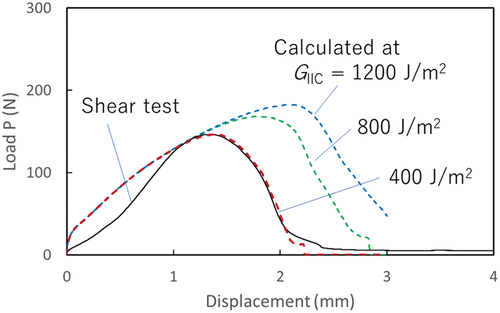
The end-notched flexure (ENF) test[Citation13] is a test for determining the fracture energy GIIC in mode 2. For the ENF tests, displacement is applied in the shear direction by utilizing the deflection of substrates by three-point bending. It is assumed that the PSA requires a larger shear displacement to reach delamination, and there is a high possibility that the ENF test will not result in delamination. In this study, we examined the easier approach in which GIIC was derived by fitting the relationship between the displacement and load obtained from the shear test by FEM simulation. shows the relationship between the displacement and load obtained from the shear test shown in , compared with the simulation results calculated with different values of GIIC. It was clarified that the calculation results when the GIIC value was set to 400 J/m2 reproduced the shear test results well.
Figure 8. Relationship between the displacement and load obtained from the shear test shown in figure 7 (c), compared with the simulation results obtained for different values of GIIC.
summarizes the analysis results of the fracture energy and σmax in modes 1 and 2 obtained in this study. The mixed mode failure criterion is followed by the power law shown in Eq. (3), and the index α was set to 1 in this study.
Table 1. Analysis results of the fracture energy and σmax in modes 1 and 2 obtained in this study.
3. Simulation
3.1. Simulation model
shows an overview of the simulation model. This model introduces a viscoelastic model for the PSA and cohesive contact at the PI sheet/PSA interface where interfacial delamination occurs. ABAQUS/Explicit 2019 was used to perform the mechanical simulation. For the analysis, the PSA layer was divided into elements, whose dimensions were 9.5 μm in thickness, 1 mm in width, and 1 mm in length, the PET sheet elements were 6 μm in thickness, 1 mm in width, and 1 mm in length, and the PI sheet elements were 62.5 μm in thickness, 1 mm in width, and 1 mm in length, respectively. First-order hexahedron elements were used for the PI, PSA, and PET sheets. On the other hand, the acrylic component was divided into relatively rough meshes. These mesh sizes were determined by trial and error as the numerical results became stable.
Figure 9. (a) Overview of the simulation model. Enlarged view from (b) Direction A and (c) Direction B.
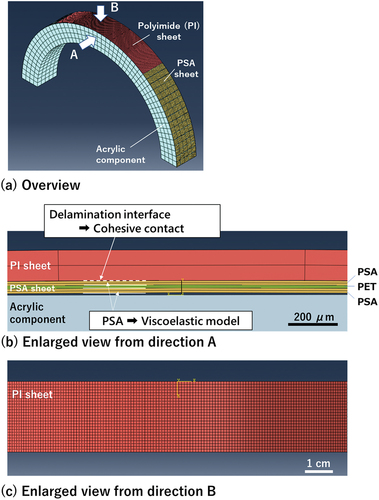
shows a schematic diagram explaining the CZM used in this study. In the CZM, the mechanical response at the process zone is expressed by the relationship between the separation width δ and the traction σ, which is called the traction separation law. In order to simplify the phenomenon, the linear relationship between δ and σ was used to express the elastic deformation and damage evolution at the delamination interface. When the elastic deformation switches to the damage evolution, σ has a maximum value, which is defined as σmax. The triangle area can be considered as the fracture energy used to form the new crack surface. This fracture energy, called the energy release rate, is denoted as GIC.
Figure 10. Traction separation law of the cohesive zone model used in this study.
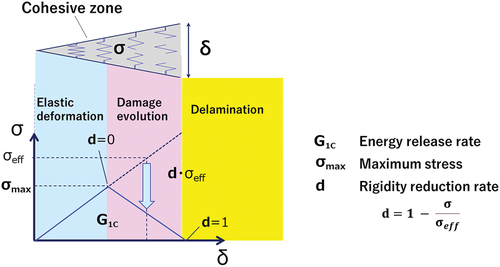
In the traction separation law shown in , the value of σ during the damage evolution is lower than the effective stress (σeff) obtained by extrapolating the slope of σ/δ during elastic deformation. The decrease rate of σ during the damage evolution is defined as the rigidity reduction rate d = 1 - σ/σeff. This rigidity reduction rate d is 0 during the elastic deformation, 0 to 1 during the damage evolution and 1 at complete detachment. The rigidity reduction rate d is a useful index to quantify the damage at the bonding interface until reaching the complete detachment.
4. Results and discussion
shows the relationship between the displacement and load when the displacement in the shear direction was applied to the local area of 8 mm in diameter on the outermost surface of the PI sheet bonded to the curved acrylic part, comparing the simulation and the local load test. The displacement rate was set to 1 mm/min. The analytical result exhibits a similar trend to the experimental one, but the load predicted by the analysis was slightly larger than that by the experiment. The reason for this difference is still unknown but may be due to mesh conditions or material properties. However, this study was conducted from a practical standpoint in product development, and if the simulation successfully represents the phenomenon, this level of quantitative dissimilarity is not a problem, so no further improvements to the analysis were made. The slope of the load-displacement curve between 0 and 1.9 mm by the local load test agrees with the simulations. As the slope of load to displacement is largely due to the deformation of the PSA, consideration of the viscoelasticity of the PSA as the simulation model is a factor of good agreement between the simulation and the local load test. shows the stress distribution simulation result at each displacement point, as shown in , comparing the shear stress along the circumference and the opening stress in the radial direction. Mainly, the shear stress acts on the PI sheet, and at point D, where the load shows a maximum value, the shear stress is released by the formation of a wrinkle due to the peeling of the PI sheet in the direction of load application.
Figure 11. (a) Relationship between the displacement and load when the local load was applied to the local area of the PI sheet surface. (b) Simulation results of the stress distribution. (c) Optical image of the bonding interface. (d) Rigidity reduction rate of the bonding interface.
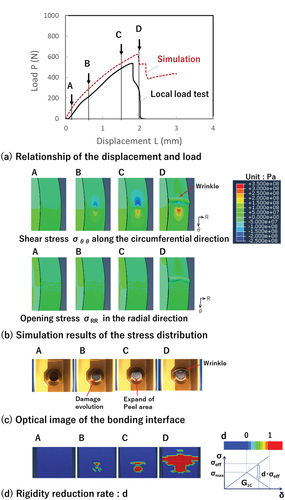
To understand the delamination process at the PI sheet/PSA interface, we compared the optical image of the bonding interface that was observed from the back side of the acrylic part (shown in ) and the rigidity reduction rate d obtained by the simulation (in ). The rigidity reduction rate d is indicated by a rainbow color scale, with blue for the elastic deformation (d = 0), rainbow colors corresponding to the degree of damage evolution (d: 0 to 1), and red for the complete detachment.
As seen in , which shows the optical image of the bonding interface, there was no change in the image contrast around point A. However, before and after point B, a spreading cloudy white contrast suggesting damage evolution at the bonding interface was observed. Furthermore, expanding contrast indicating delamination at the PI sheet/PSA interface was observed around point C. At point D, we can see the wrinkling of the PI sheet that is predicted by the simulation.
Next, focusing on the rigidity reduction rate d at each point corresponding to the optical image (), the damage evolution area displayed in rainbow colors expands around point B. Around point C, the delamination area in red colors spreads. The wrinkle-like delamination can be observed at point D. These results agree well with the contrast change in the optical images.
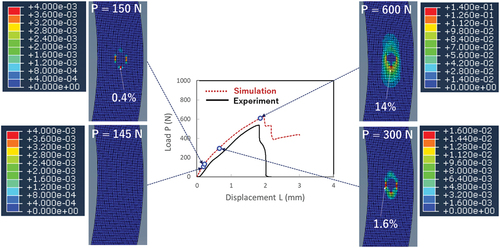
shows the starting loads at which the damage evolution and the delamination occur at the bonding interface, extracted from the simulation and the local load test results. The starting load of damage evolution is 150 N, both from the simulation and the local load test. The load at which delamination occurs is 420 N from the simulation and 400 N from the local load test. We confirmed that the simulation can reproduce the test value with a relative error within 10%.
Table 2. Starting loads with the damage evolution and the delamination occurring at the bonding interface, as extracted from the simulation and test results.
shows the simulation result of the plastic strain distribution of the PI sheet. We can see that the load at which plastic strain occurs in the PI sheet is 150 N. The maximum value of the plastic strain of the PI sheet until reaching the complete detachment is 14%. Assuming a flexible substrate with electric circuits embedded in the PI sheet, the occurrence of plastic strain in the PI sheet may cause constant stress to the electric circuit. The shear load value of 150 N at which plastic deformation of the PI sheet occurs is considered an important index value for judging reliability.
Figure 12. Simulation results of the plastic strain distribution of the PI sheet.
In this study, we reproduced the effect of rate-dependent adhesive deformation by modeling the PSA using the generalized Maxwell model. For the CZM at the bonding interface, we used the fracture energy obtained by conducting fracture tests corresponding to the expected peeling rate. Further study is required to clarify the rate dependence of the fracture energy to apply this simulation to a wider range of peeling rate phenomena and reflect it in the simulation.
Based on the results discussed above, we can confirm that the peel strength of the device in which a polymer sheet is attached to a curved surface with a PSA can be evaluated with high accuracy by considering both the viscoelasticity of the PSA and the fracture energy at the bonding interface in the mechanical simulation model. As actual devices have complicated structures that combine some curved surfaces, it is difficult to verify the peel resistance by simple bulk tests. For such devices, the above-mentioned simulation technique can help evaluate the peel resistance against local loads assumed in actual use.
5. Conclusion
To evaluate the peel resistance of a device in which a PI sheet is bonded to a curved surface with a PSA, we investigated a mechanical simulation technique modeling the viscoelasticity of the PSA and the fracture energy of the bonding interface. We also evaluated the peel strength against a local load on the PI sheet surface.
Using this simulation, we evaluated the mechanical behavior when the displacement in the shear direction was applied to a local area of 8 mm in diameter on a PI sheet. From the simulation and the local load test, it was clarified that the load at which the PSA begins to undergo damage evolution at the bonding interface was 150 N, and the delamination begins at a load of 400 N.
To verify the accuracy of the simulation, we fabricated a tester that can apply a local load and compared the delamination behavior with the simulation. We confirmed that the simulation results aligned with those of the local load test. This simulation technique is useful for evaluating the peel resistance when a local load is applied to devices with a complicated structure combining curved surfaces using soft adherends like resin sheets and soft adhesives.
Acknowledgements
The authors thank Shigetaka Tomiya and Yasuyo Nishida for their helpful insights and assistance.
Disclosure statement
No potential conflict of interest was reported by the author(s).
References
- Musto, M.; Alfano, G. A Novel Rate-Dependent Cohesive-Zone Model Combining Damage and Visco-Elasticity. Comput. Struct. 2013, 118, 126–133. DOI: 10.1016/j.compstruc.2012.12.020.
- Alfano, G.; Musto, M. Thermodynamic Derivation and Damage Evolution for a Fractional Cohesive Zone Model. J. Eng. Mech. 2017, 143(7). DOI: 10.1061/(ASCE)EM.1943-7889.0001203.
- Wiechert, E. Gesetze der elastischen Nachwirkung für constante Temperatur. Ann. Phys. (NY). 1893, 286(11), 546–570. DOI: 10.1002/andp.18932861110.
- Tschoegl, N. W. The Phenomenological Theory of Linear Viscoelastic Behavior; Springer-Verlag. pp. 119–126.
- Barenlbatt, G. I. The Mathematical Theory of Equilibrium Cracks in Brittle Fracture. Adv. Appl. Mech. 1962, 7, 55–129.
- Park, S. W.; Schapery, R. A. Methods of Interconversion Between Linear Viscoelastic Material Functions. Part I—A Numerical Method Based on Prony Series. Int. J. Solids. Struct. 1999, 36(11), 1653–1675. DOI: 10.1016/S0020-7683(98)00055-9.
- Herbert, E. G.; Oliver, W. C.; Pharr, G. M. Nanoindentation and the Dynamic Characterization of Viscoelastic Solids. J. Phys. D: Appl. Phys. 2008, 41(7), 074021. DOI: 10.1088/0022-3727/41/7/074021.
- Sui, W.; Duvieusart, M. S.; Zhao, J.; Tai, Y.-C.; Lee, Y.-K. Comparative Study of the Viscoelasticity of Parylene Thin Films for MEMS Using Nano-DMA and Molecular Dynamics. IEEE 30th International Conference on Micro Electro Mechanical Systems (MEMS), 2017.
- Christensen, R. M. Theory of Viscoelasticity Second Edition; Dover, 2003.
- Williams, M. L.; Landel, R. F.; Ferry, J. D. The Temperature Dependence of Relaxation Mechanisms in Amorphous Polymers and Other Glass-Forming Liquids. J. Amer. Chem. Soc. 1955, 77(14), 3701–3707. DOI: 10.1021/ja01619a008.
- Benbow, J. J.; Roesler, F. C. Experiments on Controlled Fractures. Proc. Phys. Soc. 1957, 70(2), 201–211. DOI: 10.1088/0370-1301/70/2/307.
- Gillis, P. P.; Gilman, J. J. Double Cantilever Cleavage Mode of Crack Propagation. J. Appl. Phys. 1964, 35(3), 647–658. DOI: 10.1063/1.1713430.
- Russell, A. J.; Street, K. N. Proceedings of the 1982 International Conference on Composite Materials, Tokyo, Japan, Oct 25–28, 1982; Hayashi, T., Kawata, K. Sokichi Umekawa, S., Eds.; The Japan Society for Composite Materials: Tokyo, Japan, 1982.