
 ?Mathematical formulae have been encoded as MathML and are displayed in this HTML version using MathJax in order to improve their display. Uncheck the box to turn MathJax off. This feature requires Javascript. Click on a formula to zoom.
Abstract
A subjective probability argument suggests vote-share estimates from polling companies can be interpreted as market prices. The corresponding election constitutes the price at a known future date. This makes an options-pricing approach particularly attractive. In this setting, vote-share estimates, the probability of winning the popular vote and the second-round qualification probability all have a convenient representation in terms of binary options prices. In this article, we develop options-pricing, vote-transfer, and Monte Carlo methods to forecast the French presidential election. The approach fits well with the proportional and regimented two-stage nature of the French election but applies more broadly. Unusually for a French system characterised by uncertainty and constant flux the incumbent President Macron appears in a dominant position throughout the 2017 and 2022 elections albeit with no chance of an outright win in the first round.
1. Introduction
Beyond the raw technical challenge (Easaw et al., Citation2023) the forecasting of elections is important for several reasons. The use of predictive analytics in election campaigns is now well-established (Kenett et al., Citation2018; Quinlan & Lewis-Beck, Citation2021). Polls underpin policy formation well in advance of elections as well as feeding back once campaigns are under way. The increased emphasis on predictive analytics also occurs amid suggestions of increased electoral volatility (Quinlan & Lewis-Beck, Citation2021). More generally, it is important to have as informed an electorate as possible (Pajala et al., Citation2018). This is especially true given recent concerns over the manipulation of Social Media (Reisach, Citation2021). Information supplied to the electorate in-turn affects both voting levels and post-election satisfaction levels (Bunker, Citation2020). Election forecasts can have significant economic impacts, notably on stock prices (Reade & Vaughan Williams, Citation2019) and prospective capital investments. Successful forecasting work can also yield improved understanding of the underlying political environment (Quinlan & Lewis-Beck, Citation2021).
Outside of the U.S. forecasting elections using statistical models is arguably most extensive in France (Lewis-Beck, Citation2005). National election forecasting in France has been the subject of scientific forecasting efforts for a number of years (Dufresne et al., Citation2022). The record of forecasting models in France is mixed. For a discussion and overview see Foucault and Nadeau (Citation2012).
As a case study France is important due to its unique political economy and wider European influence. France has been labelled a “state influenced market” (Hastings & Heyes, Citation2018; Schmidt, Citation2012) reflecting its strong interventionist traditions, welfare state and efforts to protect industry and culture. In recent years the French economy has been characterised by high state spending and a relatively robust response to the COVID-19 pandemic. France has a traditionally high electoral turnout and a politically active population. Recent examples include strong engagement from younger voters partly driven by populist policies from far-right candidates. The dynamics of French politics thus makes it an exciting case study, including the potential for policy transfer and influence across Europe.
In this article, we propose an options-pricing approach based on opinion-poll data that offers certain theoretical advantages and is particularly well-suited to the French system. The French presidential election follows a regimented two-stage structure:
First open stage. All candidates compete in an open vote. Candidates can only win at this stage if they secure more than 50% of the votes cast.
Second run-off stage. If no candidate achieves over 50% of the vote in the first stage the top two candidates run off. The winner of this second stage wins the presidency.
This two-stage structure lends itself to the following questions:
What is the estimated share of the vote?
What is the probability that any of the candidates can win outright in the first round?
What is the probability that a given candidate reaches the second round of the vote?
What is the overall win probability of the respective parties given the first round of polling?
What is the estimated vote share in the second round of polling?
What is the conditional probability, given the final two candidates, of winning the second round of the election?
Questions 1–3 and 5–6 above can be solved using a financial options-pricing argument (see Section 3). Question 4 is more involved and has to be solved via a combination of Monte Carlo simulation (Section 5) and a new vote-transfer model (Section 6). The above thus leads to the development of new techniques that, whilst well suited to the French context, apply more generally.
The importance of our contribution is threefold. First, the options-pricing, vote transfer and simulation methods developed are innovative and have a broad range of application beyond France (see e.g. Fry & Burke, Citation2020; Taleb, Citation2018). This notwithstanding our approach fits particularly well to the French system. Second, we contribute to wider debates surrounding the French system (Dufresne et al., Citation2022; Jérôme et al., Citation2022; Mongrain, Citation2022) and the raw forecasting challenge (see e.g. Lewis-Beck et al., Citation2016; Murr, Citation2016, Citation2021). Third, we contribute to the literature on political and electoral forecasting (see Section 2).
The layout of this article is as follows. Section 2 reviews the related literature. An options-pricing approach to estimating vote shares is developed in Section 3. An empirical statistical approach to estimating the same quantities based entirely on the sampling variability in polls is given in Section 4. A Monte Carlo simulation algorithm is outlined in Section 5. A new vote-transfer model for multi-stage elections is developed in Section 6. An empirical application to the 2022 French presidential election is contained in Section 7. Additional robustness checks are performed in Section 8. Section 9 concludes and explores the opportunities for further research.
2. Related literature
Models using opinion-poll data make up much prior political forecasting work though other approaches are possible (see below). Polling data inevitably involves nontrivial statistical modelling (Bunker, Citation2020) with imperfect data (Pekar et al., Citation2022). Potential problems with polls include the difficulty of obtaining a representative sample, ensuring respondents reveal their intentions truthfully and hoping that respondents do not systematically change their intentions before the election (Khan & Lieli, Citation2018). Further limitations include sampling variability and the sparsity of polling data (Pekar et al., Citation2022). In the face of such uncertainties generating accurate forecasts remains problematic (Liu et al., Citation2021). An overview, including a review of recent forecasting failures, is given by Kenett et al. (Citation2018). Sections 3–8 below therefore reflect a continued need to develop models that incorporate polling data as efficiently as possible.
Alternative approaches to opinion polls include fundamental political economy models based on relevant fundamentals. These typically include variables such as economic growth (Nadeau & Lewis-Beck, Citation2020) or incumbent time in office (Abramowitz, Citation2012). Further alternatives include synthetic models (based on a synthesis of fundamental and polling information) (Erikson & Wlezien, Citation2014) and political stock markets/prediction markets (Bunker, Citation2020). Recent evidence suggests both structural models (Quinlan & Lewis-Beck, Citation2021) and prediction markets (Reade & Vaughan Williams, Citation2019) include useful predictive information over and above polls.
The options-pricing approach outlined in Section 3 below is noteworthy for its simplicity and elegance. Both facets emerge as key themes in the literature. Green and Armstrong (Citation2015) emphasise the utility of simple models in practical forecasting applications. The elegance of our approach also appeals to a high degree of technical sophistication associated with much political modelling. This includes computational allocation problems (Wang et al., Citation2015), a political travelling salesman problem (Shahmanzari et al., Citation2022) advanced Bayesian statistical modelling of U.S. elections (Rigdon et al., Citation2015) and SDE modelling of opinion-poll data (Levene & Fenner, Citation2021).
3. An options-pricing approach to estimating election outcomes
In this section, we lay out a financial options-pricing model to make opinion-poll forecasts. The model is, then, further adapted to some of the intricacies of the French system. This underscores the potential versatility of the approach.
Let denote the subjective probability of event
at time t. In this context,
may represent the probability that a randomly chosen constituent will vote for Party i at time t. This probability can, in turn, be thought of as representing the price of a wager that pays $1 if event
occurs and 0 otherwise (see e.g. Lad, Citation1996). This formulation also provides an important philosophical link between subjective probabilities and financial betting (Taleb, Citation2017, Citation2018).
The importance of this approach for political applications is threefold. First, forecasts of vote share made by polling companies, based on moderated use of raw polling numbers, corresponds naturally to the subjective probabilities outlined above. Second, under this framework, the actual vote share in the election corresponds to an asset price at a known future date. This renders analysis particularly amenable to an options-pricing approach (Fry & Burke, Citation2020; Taleb, Citation2018). Third, if and
denote asset prices as time t the ratio
represents the price of asset i in units of asset j. These
values prove particularly useful in the analysis of proportional vote systems (see below).
Consider, first, the univariate problem of predicting the vote share for one party with Here, we will estimate the relevant probabilities by appealing to the Binary Options pricing formula (Hull, Citation2008, chapter 24 with
) in a standard Black–Scholes setting:
(1)
(1)
where
denotes the standard normal CDF,
denotes the indicator function, T is the expiration date,
is the strike price, and
As is common in empirical options-pricing applications (see e.g. Dowd & Blake, Citation2022) r is the risk-free interest rate. This formulation thus makes an explicit link between (subjective) probabilities and the price of an associated bet (Taleb, Citation2017, Citation2018).
The probability that the party wins the presidency in the first round is now given by the Binary call option price in EquationEq. (1)(1)
(1) with
(reflecting the 50% share of the vote that parties need to win outright in the first round):
(2)
(2)
Now, suppose we want to estimate the vote share at time where T is the known election date. Suppose we use the median price of the bet to estimate the probability that a randomly chosen constituent votes for a given party. Using the binary call option price in EquationEq. (1)
(1)
(1) gives
(3)
(3)
EquationEquation (3)(3)
(3) therefore means that the
would be the estimated vote share, where
is the polling percentage at time t, r is the interest rate and
is an estimate of the underlying volatility associated with polling numbers. In the French system, EquationEq. (3)
(3)
(3) can apply in both the first and second round of the vote.
An options-pricing argument is particularly attractive for proportional systems like France. For two parties i and j define Financially,
gives the price of asset i in units of asset j. The probability that i beats j can be calculated as the price of a binary option with strike price
This gives
(4)
(4)
where
denotes the volatility associated with
In the second round of the vote, EquationEq. (4)
(4)
(4) gives the win probability for Party i versus Party j. In the first round of the vote, if
denotes the vote share of the party currently ahead in the polls EquationEq. (4)
(4)
(4) gives the probability that i wins the popular vote. Similarly, if
denotes the vote share of the party currently second in the polls EquationEq. (4)
(4)
(4) gives the probability that i qualifies for the second round of the election.
The above, thus, requires a plug-in estimator of the volatility Following Fry and Burke (Citation2020) we estimate
as the residual standard error of the following weighted regression model:
(5)
(5)
where
is the first-difference of the log-price,
is the first difference of the polling time, measured in days, and
4. Forecasting election outcomes based on sampling variability
In this section, we detail how election outcomes can also be modelled without recourse to an options-pricing argument. Consider the random-walk model in EquationEq. (5)(5)
(5) . Let t denote the current polling date and T denote the known future election date. The electoral calculus works as follows. First, the probability that i wins the first-stage is given by
(6)
(6)
Similarly, the predicted share of the vote during an election can be calculated as
(7)
(7)
To calculate the probability that Party i beats Party j set Then use
(8)
(8)
5. A Monte Carlo simulation algorithm
In this section, we develop a Monte Carlo simulation algorithm. This enables second-stage election outcomes to be simulated on the basis of first-round polling data. Let Party 1 and Party 2 denote the two parties who quality for the second round of the election. We assume that those who voted for either Party 1 or Party 2 in the first round continue to do so. Those voting for parties eliminated in the first round are assumed to transfer their vote to either Party 1 or Party 2.
The above suggests that election-winning probabilities can be obtained via Monte Carlo simulation as follows:
Simulate the vote share percentage in the first round.
Assume that the vote percentages of the two leading parties remain fixed at Round 1.
Simulate the transfer of votes between the first and second rounds from the eliminated candidates to the final two candidates.
The projected vote share of the final two parties is obtained by adding the vote shares at Stages 2–3.
To be precise EquationEq. (3)(3)
(3) suggests election outcomes can be simulated as follows.
Given
…
Let the two biggest parties be Party 1 and 2 with
where denotes the probability that an initial vote for candidate j in the first round is transferred to Party 1 in the second round. Similarly, set
(10)
(10)
Estimation of the above vote-transfer probabilities is discussed in Section 6.
Constructing a simulation algorithm also requires specification of a statistical model for the proportion who vote for candidate i. It is natural to use the Dirichlet distribution in this context (see e.g. Ghosal & Van Der Vaart, Citation2017). EquationEquation (3)
(3)
(3) suggests
Applying the constraint
it follows from Narayanan (Citation1992) that given an associated variance
the vote share can be modelled as a Dirichlet distribution with parameters (
…
) where
(11)
(11)
To estimate the associated variance we can use EquationEq. (3)
(3)
(3) in conjunction with the delta method (Bingham & Fry, Citation2010, chapter 7) to convert uncertainty in the estimated volatility
to the associated plug-in estimator for
This gives
(12)
(12)
Note that EquationEq. (12)(12)
(12) relies, in a financial context, on an estimate of the volatility of volatility (see e.g. Huang et al., Citation2019).
Here, we use the residual standard error from a regression model to estimate (see EquationEq. (5)
(5)
(5) ). A classical result in regression states that the residual standard deviation estimator has a chi-squared distribution:
(13)
(13)
where df denotes the residual degrees of freedom. See e.g. Bingham and Fry (Citation2010) for details. It follows from Equation(13)
(13)
(13) that
(14)
(14)
where
denotes the Gamma function.
6. A simple vote-transfer model
Whilst complex data on party positioning exists (Jolly et al., Citation2022) such data lags behind the constant birth and death of parties within the French system. In this section, we, therefore, construct a theoretical vote transfer model between the first and second rounds of the French presidential election based on the simple division of parties from left to right. This enables second-stage election outcomes to be simulated on the basis of first-round polling. gives an outline description of the parties involved. gives a diagrammatic representation showing the respective distances between the parties. This left-right dichotomy was, historically, the conventional way of looking at French elections. However, this traditional hegemony has since been challenged by the emergence of parties in the centre and from the far right (Mongrain, Citation2022). Nonetheless, this approach remains convenient for forecasting applications and a related left-to-right listing is also considered in Dufresne et al. (Citation2022).
Figure 1. Schematic diagram of French political parties on the left-right political spectrum.
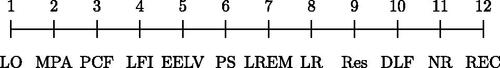
Table 1. Outline description of major French political parties.
A theoretical vote-transfer model can be constructed as follows. Suppose a constituent votes for Party A in the first round but is left with a choice of Party B and Party C in the second round. Let denote the probability the voter transfers to Party B. Let
denote the probability the voter transfers to Party C. We assume that the switching probability is proportional to the distance between the parties:
(15)
(15)
EquationEquation (15)(15)
(15) , therefore, imposes a physically realistic mechanism whereby vote-transfer between adjacent parties is more likely. The model reduces to a special case of a network-flow model discussed elsewhere in Fry and Binner (Citation2016). The model also gives some theoretical support for the notion that political parties may strategically aim for the middle ground to secure election-winning votes. This is consistent with parties positioning themselves where they anticipate the majority of voters’ preferences to be (Akdağ, Citation2016).
From EquationEq. (15)(15)
(15)
(16)
(16)
EquationEquations (15)(15)
(15) and Equation(16)
(16)
(16) , therefore, lead to the solutions
(17)
(17)
Throughout the first round of the 2022 presidential election voting three parties LREM, NR and DLF persistently dominate polls. Projected vote-transfer probabilities based on the original vote cast are shown below in .
Table 2. Projected vote-transfer probabilities under three scenarios.
7. Empirical results
The layout of this section is as follows. The polling data used in this study is discussed in Subsection 7.1. Subsection 7.2 covers the first round of the presidential election. A Monte Carlo simulation exercise is outlined in Subsection 7.3. Subsection 7.4 covers the second round of the presidential election.
7.1. The data
The polling data used in this article comes from the first and second round of polling for the 2017 and 2022 French presidential elections. The 2022 election is analysed in Subsections 7.2–7.4 and 8.2. The 2017 election is analysed in Section 8.1. In the light of recent controversies, particularly in regard to the U.S. presidential election, some comments on data coverage are in order. Following a similar approach in Wlezien (Citation2013) summarises the number of the polls, the number of polling days and the number of different polling companies involved.
Table 3. Summary statistics of 2022 and 2017 presidential election polls.
7.2. First-round results
Following the official announcement of the full list of presidential candidates the first round of polling was held from 3 March 2022 to 8 April 2022. The round of the election itself was on 10 April 2022. When there are multiple polls in one day we take an average over multiple polls to obtain a single value for each party for each polling day. We choose the value of the risk-free interest rate to be 4% per annum. This is consistent with both recent applied options-pricing work (see eg. Dowd & Blake, Citation2022) and available Treasury Bill data at the time of writing.
Estimates of the share of the vote based on the entirety of the first round of polling are shown in . These include an estimated share of the vote obtained from EquationEq. (3)(3)
(3) together with an associated estimated standard deviation based on EquationEq. (14)
(14)
(14) . According to EquationEq. (2)
(2)
(2) the probability that Macron wins the election outright in the first round is 0.00 (to two decimal places). It, therefore, seems extremely unlikely that any of the parties can secure an outright election victory in the first round.
Table 4. Estimated values of and
obtained after the first round of polling.
EquationEquation (4)(4)
(4) enables real-time estimation of several key quantities of interest. plots the estimated probability President Macron wins the popular vote during the first round of the election. The options-pricing method also seems to out-perform an approach based on sampling variability in polls outlined in Section 4. plots the estimated probability that the four major parties qualify for the second round of the election.
Figure 2. Estimated probability that President Macron wins the popular vote during the first round of the 2022 French presidential election according to EquationEq. (4)(4)
(4) (solid line) and EquationEq. (8)
(8)
(8) (dashed line).
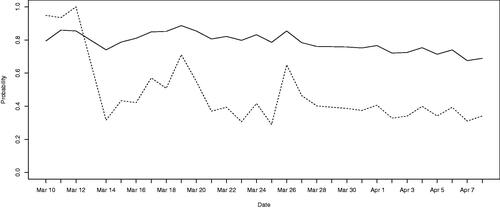
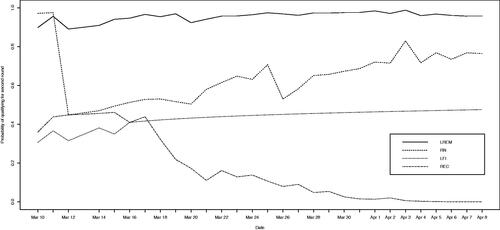
Figure 3. Estimated probability of qualification for the second round of the 2022 French presidential election according to EquationEq. (4)(4)
(4) .
7.3. Monte Carlo simulation of election outcomes given the first round of polling
summarises estimation results on the basis of the first round of polling. As discussed in Section 3 these results are first calibrated to a Dirichlet distribution using the method of Narayanan (Citation1992). Simulated results from the Dirichlet distribution obtained are then combined with the vote-transfer model in Section 4 to simulate second-stage outcomes. outlines the simulation results. It is estimated that there is a 96% probability that the incumbent President Macron wins. There is a roughly 4% probability that the far-right RN party wins, with only a remote possibility of an LFI victory. Results also underscore the dominant position of the three major parties.
Table 5. Estimated probability of election victory after first round of polling obtained by Monte Carlo simulation (results based on 1,000,000 simulations).
7.4. Second-round results
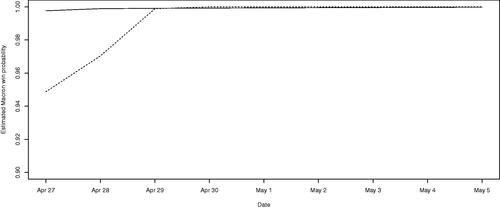
As the 2022 French presidential election reached its second stage a second round of opinion polling was conducted from 10 April to 22 April 2022. The vote itself occurred on 24 April 2022. As before, we take an average over multiple polls to obtain a single value for each party for each polling day. A plot of the estimated vote share for the incumbent LREM party is shown in . A plot of the estimated win probability for the LREM party is shown in . Results show the level of support for President Macron seemingly increasing over time. Results reinforce the dominant position of the incumbent president at the end of the first round of polling. The options-pricing and purely statistical approaches lead to similar results in each case. However, there is some suggestion of more consistent results under the options-pricing approach.
Figure 4. Real-time model estimated vote share for Macron for the second round of the 2022 French presidential election based on EquationEq. (4)(4)
(4) (solid line) and EquationEq. (7)
(7)
(7) (dashed line).
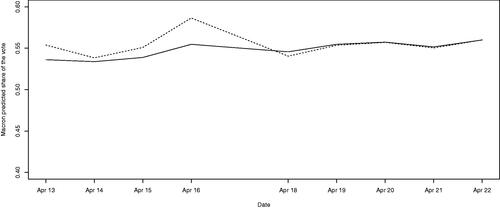
Figure 5. Real-time estimated probability of a Macron victory in the second round of the 2022 French presidential election based on EquationEq. (4)(4)
(4) (solid line) and EquationEq. (8)
(8)
(8) (dashed line).
8. Additional robustness checks
Additional robustness checks performed in this section are as follows. Subsection 8.1 applies our options-pricing method to the 2017 French presidential election. Subsection 8.2 compares our options-pricing model to the raw vote-intention polls.
8.1. Application to the 2017 French presidential election
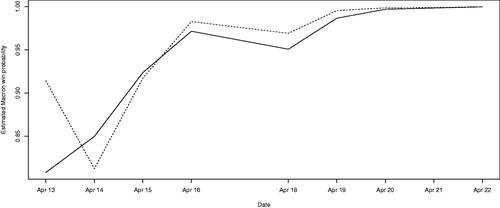
repeat the analysis in Section 7 for the 2017 French presidential election. shows that Macron remains the consistent favourite to win the popular vote in the first round. The options-pricing approach also seems to out-perform the purely statistical approach. Second-round qualification probabilities in show a more congested presidential race in 2017 though the stage seems set for a showdown between Macron (EM) and Le Pen (FN) towards the end of polling. and show Macron in an even more dominant position in the second round in 2017 both in terms of the estimated vote share and the estimated probability of winning.
Figure 6. Estimated probability that President Macron wins the popular vote during the first round of the 2017 French presidential election according to EquationEq. (4)(4)
(4) (solid line) and EquationEq. (8)
(8)
(8) (dashed line).
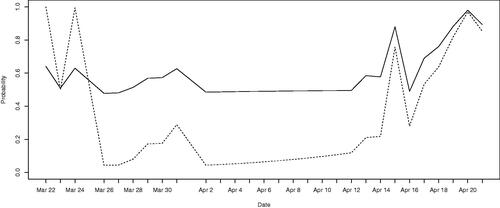
Figure 7. Estimated probability of qualification for the second round of the 2017 French presidential election according to EquationEq. (4)(4)
(4) .
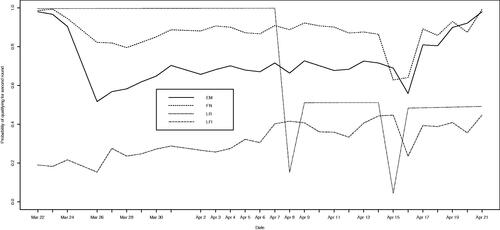
Figure 8. Real-time model estimated vote share for Macron in the second round of the 2017 French presidential election based on EquationEq. (4)(4)
(4) (solid line) and EquationEq. (7)
(7)
(7) (dashed line).
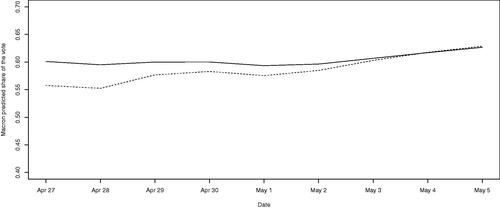
Figure 9. Real-time estimated probability of a Macron victory in the second round of the 2017 French presidential election based on EquationEq. (4)(4)
(4) (solid line) and EquationEq. (8)
(8)
(8) (dashed line).
8.2. Comparison with raw vote-intention polls
and show a comparison with the options-pricing model with the raw-voting intention polls. We compare forecasts using the RMSE and the MAE defined via
where
denotes the forecast value and
denotes the actual value. Results in suggest that the options-pricing approach marginally out-performs the raw voting-intention polls during the first round of polling. Results in suggest the raw vote-intention polls marginally out-perform the options-pricing method during the second stage of polling.
Table 6. Comparison with the options-pricing approach and raw vote-intention polling numbers for the 2022 French presidential election after the first round of polling.
Table 7. Comparison with the options-pricing approach and raw vote-intention polling numbers for the second round of the 2022 French presidential election.
and repeat and for the 2017 French Presidential election. suggests the raw voting-intention polls marginally out-perform the options-pricing approach during the first round of polling. suggests the options-pricing method marginally out-performs the raw voting-intention polls during the second round of polling.
Table 8. Comparison with the options-pricing approach and raw vote-intention polling numbers for the 2017 French presidential election after the first round of polling.
Table 9. Comparison with the options-pricing approach and raw vote-intention polling numbers for the second round of the 2017 French presidential election.
9. Conclusions and further work
Political forecasting is arguably more important than ever before given the use of predictive analytics in election campaigns (Kenett et al., Citation2018; Quinlan & Lewis-Beck, Citation2021), concerns raised over the manipulation of Social Media (Reisach, Citation2021) and recent suggestions of increased electoral volatility (Quinlan & Lewis-Beck, Citation2021). It is important to have as informed an electorate as possible (Pajala et al., Citation2018). Forecasting work can also impact on the economy (Reade & Vaughan Williams, Citation2019), increase voter turnout and satisfaction (Bunker, Citation2020) and help explain shifts in the underlying political environment (Quinlan & Lewis-beck, Citation2021). Models presented in this article, therefore, constitute a partial mathematical solution to a serious practical problem as well as building on much prior academic forecasting work.
Allied to the above the French presidential election (Baujard & Lebon, Citation2022) and its associated forecasting (Mongrain, Citation2022) is interesting and important in its own right. Moreover, outside of the United States, forecasting using statistical models is most extensive in France (Lewis-Beck, Citation2005). This article develops an elegant options-pricing approach for opinion-poll data that serves two key purposes. First, we develop an options-pricing approach that enables principled estimation of vote share together with a series of adjustments that prove particularly well-suited to the multistage and proportional nature of the French system. Second, we develop a Monte Carlo simulation algorithm that can be applied to both single-stage and multistage elections. Overall, the approach is simple enough to be operationalised in forecasting applications (Green & Armstrong, Citation2015) whilst remaining in keeping with the technical traditions of the area (Levene & Fenner, Citation2021; Shahmanzari et al., Citation2022; Wang et al., Citation2015).
A subjective probability argument suggests vote-share estimates from polling companies can be interpreted as asset prices. The corresponding election therefore constitutes an asset price at a known future date. This renders an options-pricing approach particularly attractive (Taleb, Citation2018). Rearranging standard binary options-pricing formulae (Hull, Citation2008) leads to principled estimates of vote share. The approach also allows us to calculate the probability of an outright win during the first round of the election. Allied to the above the ratio of the vote share of two parties can also be interpreted as an asset price (albeit one expressed in a different currency). Applying our options-pricing approach to these ratios yields closed-form expressions for the probability of winning the popular vote, the probability of qualifying for the second round of the election and the probability of winning the election in the second round.
Development of the Monte Carlo simulation algorithm solves problems far beyond the French context. The options-pricing approach outlined above leads to point estimates of vote share. This requires volatility values derived from a residual standard deviation parameter from a regression model (Fry & Burke, Citation2020). This standard error characterises the uncertainty associated with polling and, in a financial context, refers to the volatility of volatility (Huang et al., Citation2019). The nature of the French system necessitates modelling the transfer of votes at the end of the first round. Here, we develop a statistical vote-transfer model that accounts for an incomplete data record and relies only a schematic listing of parties from left to right.
The practical implications of our study are as follows. We present new ways of analysing political systems. Our approach is particularly well suited to those systems defined by either constant flux, see e.g., the constant birth/death of parties within the French system, a relatively incomplete historical data record, proportional-vote systems and systems that are multistage in nature. Results in Sections 6 and 7 show that an options-pricing approach appears to lead to less-volatile estimates compared to an equivalent approach based on sampling variability in polls. Results in Section 8 show an options-pricing approach can be successfully applied to different elections and may lead to some marginal improvements with respect to raw voting-intention polls. Results also highlight two important wider themes. First, the utility of options-pricing methods in practical applications (see e.g., Dowd et al., Citation2019). Second, the continued relevance of additional political forecasting work including comparisons of different methods using Brier scores and related criteria (Hanretty, Citation2021).
Forecasting work is particularly relevant given recent suggestions of enhanced electoral volatility (Quinlan & Lewis-Beck, Citation2021) and manipulation of social media, please see e.g., Reisach (Citation2021). Polling can variously impact upon voter behaviour (Bunker, Citation2020) and the economy at large (Reade & Vaughan Williams, Citation2019). Successful forecasting work can also improve our understanding of the underlying political environment (Quinlan & Lewis-Beck, Citation2021). There is, therefore, a continued need to develop new forecasting methods. This includes citizen forecasting approaches (Dufresne et al., Citation2022), election stock markets (Graefe, Citation2017) and combining different methods (Graefe, Citation2023). Wlezien et al. (Citation2013) present an interesting approach whereby regression methods are used to convert raw polling at various times during the electoral campaign to a projected share of the vote at the actual election date. However, the constant flux within the French political system means that such methods may be difficult to apply here. France, itself, is a particularly interesting country to study. Notwithstanding the specifics of the French political economy (Hastings & Heyes, Citation2018) and its electoral landscape, we also stress the versatility of this approach and encourage its application with respect to other country case studies. The sophisticated evolution of forecasting research appears especially relevant and valuable at a time when multiple crises have affected economies and societies throughout the globe, stirring the creation of new political parties, governance strategies and (subsequent) voting outcomes.
Supplemental Material
Download MS Word (34.1 KB)Acknowledgements
We would like to acknowledge helpful and supportive comments from two anonymous reviewers, the associate editor, seminar participants at Hull University Business School and Silvio Fanzon. R code (Supplementary material) kindly provided by an anonymous reviewer is also gratefully acknowledged. The usual disclaimer applies.
Disclosure statement
No potential conflict of interest was reported by the authors.
References
- Abramowitz, A. (2012). Forecasting in a polarized era: The time for change model and the 2012 presidential election. Political Science and Politics, 45, 618.
- Akdağ, G. A. (2016). Rational political parties and electoral games: The AKP’s strategic move for the Kurdish vote in Turkey. Turkish Studies, 17, 126–154.
- Baujard, A., & Lebon, I. (2022). Not-so-strategic voters. Evidence from an in situ experiment during the 2017 French presidential election. Electoral Studies, 76, 102458. https://doi.org/10.1016/j.electstud.2022.102458
- Bingham, N. H., & Fry, J. M. (2010). Regression: Linear models in statistics. Springer.
- Bunker, K. (2020). A two-stage model to forecast elections in new democracies. International Journal of Forecasting, 36(4), 1407–1419. https://doi.org/10.1016/j.ijforecast.2020.02.004
- Dowd, K., & Blake, D. (2022). Good practice principles in modelling defined contribution plans. Journal of Risk and Financial Management, 15(3), 108. https://doi.org/10.3390/jrfm15030108
- Dowd, K., Blake, D., Buckner, D., & Fry, J. (2019). The valuation of no-negative equity guarantees and equity release mortgages. Economics Letters, 184, 108669. https://doi.org/10.1016/j.econlet.2019.108669
- Dufresne, Y., Jérôme, B., Lewis-Beck, M. S., Murr, A. E., & Savoi, J. (2022). Citizen forecasting: The 2022 French presidential election. Political Science and Politics, 55, 730–734.
- Easaw, J., Fang, Y., & Heravi, S. (2023). Using polls to forecast popular vote share for US presidential elections in 2016 and 2020: An optimal forecast combination based on ensemble empirical model. Journal of the Operational Research Society, 74(3), 905–911. https://doi.org/10.1080/01605682.2022.2101951
- Erikson, R. S., & Wlezien, C. (2014). Forecasting US presidential elections using economic and noneconomic fundamentals. Political Science & Politics, 47(02), 313–316. https://doi.org/10.1017/S1049096514000092
- Foucault, M., & Nadeau, R. (2012). Forecasting the 2012 French presidential election. Political Science and Politics, 45, 218–222.
- Fry, J., & Binner, J. M. (2016). Elementary modelling and behavioural analysis for emergency evacuations using social media. European Journal of Operational Research, 249(3), 1014–1023. https://doi.org/10.1016/j.ejor.2015.05.049
- Fry, J., & Burke, M. (2020). An options-pricing approach to election prediction. Quantitative Finance, 20(10), 1583–1589. https://doi.org/10.1080/14697688.2020.1757136
- Ghosal, S., & Van Der Vaart, A. (2017). Fundamentals of nonparametric Bayesian inference. Cambridge University Press.
- Graefe, A. (2017). Political markets. In K. Arzhei, J. Evans, & M. S. Lewis-Beck (Eds.), The SAGE Handbook of Electoral Behaviour (pp. 861–882). SAGE.
- Graefe, A. (2023). Embrace the differences: Revisiting the PollyVote method of combining forecasts for U.S. presidential elections (2004 to 2020). International Journal of Forecasting, 39(1), 170–177. https://doi.org/10.1016/j.ijforecast.2021.09.010
- Green, K. C., & Armstrong, J. S. (2015). Simple versus complex forecasting: The evidence. Journal of Business Research, 68(8), 1678–1685. https://doi.org/10.1016/j.jbusres.2015.03.026
- Hanretty, C. (2021). Forecasting multiparty by-elections using Dirichlet regression. International Journal of Forecasting, 37(4), 1666–1676. https://doi.org/10.1016/j.ijforecast.2021.03.007
- Hastings, T., & Heyes, J. (2018). Farewell to flexicurity? Austerity and labour policies in the European Union. Economic and Industrial Democracy, 39(3), 458–480. https://doi.org/10.1177/0143831X16633756
- Huang, D., Schlag, C., Shaliastovich, I., & Thimme, J. (2019). Volatility-of-volatility risk. Journal of Financial and Quantitative Analysis, 54(6), 2423–2452. https://doi.org/10.1017/S0022109018001436
- Hull, J. C. (2008). Options, futures and other derivatives (7th ed.) Pearson.
- Jérôme, B., Mongrain, P., & Nadeau, R. (2022). Forecasting the 2022 French presidential election: From a left-right logic to quadripolarization of politics. Political Science and Politics, 55, 697–702.
- Jolly, S., Bakker, R., Hooghe, L., Marks, G., Polk, J., Rovny, J., Steenbergen, M., & Vachudova, M. A. (2022). Chapel Hill expert trend file 1999-2019. Electoral Studies, 75, 102420. https://doi.org/10.1016/j.electstud.2021.102420
- Kenett, R. S., Pfeffermann, D., & Steinberg, D. (2018). Election polls – A survey, a critique and proposals. Annual Review of Statistics and Its Application, 5(1), 1–24. https://doi.org/10.1146/annurev-statistics-031017-100204
- Khan, U., & Lieli, R. P. (2018). Information flow between prediction markets, polls and media: Evidence from the 2008 presidential primaries. International Journal of Forecasting, 34(4), 696–710. https://doi.org/10.1016/j.ijforecast.2018.04.002
- Lad, F. (1996). Operational, subjective statistical methods: A mathematical, philosophical and historical introduction. Wiley.
- Levene, M., & Fenner, T. (2021). A stochastic differential equation approach to the analysis of the 2017 and 2019 UK general election polls. International Journal of Forecasting, 37(3), 1227–1234. https://doi.org/10.1016/j.ijforecast.2021.02.002
- Lewis-Beck, M. S. (2005). Election forecasting: Principles and practice. European Journal of Political Research, 31(3), 315–325. https://doi.org/10.1111/1475-6765.00317
- Lewis-Beck, M. S., Nadeau, R., & Bélanger, E. (2016). The British general election: Synthetic forecasts. Electoral Studies, 41, 264–268. https://doi.org/10.1016/j.electstud.2015.11.010
- Liu, Y., Ye, L., Sun, J., Jiang, Y., & Wang, H. (2021). Modelling undecided votes to forecast elections: From bandwagon behaviour and the spiral of silence perspective. International Journal of Forecasting, 37(2), 461–483. https://doi.org/10.1016/j.ijforecast.2020.06.011
- Mongrain, P. (2022). Predicting in an (increasingly) unpredictable system? Forty years of election forecasting in France. French Politics, 20(2), 210–225. https://doi.org/10.1057/s41253-022-00171-3
- Murr, A. (2016). The wisdom of crowds: What do citizens forecast for the 2015 British general election? Electoral Studies, 41, 283–288. https://doi.org/10.1016/j.electstud.2015.11.018
- Murr, A. E. (2021). Do party leadership contests forecast British general elections? Electoral Studies, 72, 102342. https://doi.org/10.1016/j.electstud.2021.102342
- Nadeau, R., & Lewis-Beck, M. (2020). Election forecasts: Cracking the Danish case. International Journal of Forecasting, 36(3), 892–898. https://doi.org/10.1016/j.ijforecast.2019.09.007
- Narayanan, A. (1992). A note on parameter estimation in the multivariate beta distribution. Computers & Mathematics with Applications, 24(10), 11–17. https://doi.org/10.1016/0898-1221(92)90016-B
- Pajala, T., Korhonen, P., Malo, P., Sinha, A., Wallenius, J., & Dehnokhalaji, A. (2018). Accounting for political opinions, power and influence: A voting advice application. European Journal of Operational Research, 266(2), 702–715. https://doi.org/10.1016/j.ejor.2017.09.031
- Pekar, V., Binner, J., Najafi, H., Rickard, C., Swanson, R., & Fry, J. (2022). Voting intentions on social media and political opinion polls. Government Information Quarterly, 39(4), 101658. https://doi.org/10.1016/j.giq.2021.101658
- Quinlan, S., & Lewis-Beck, M. S. (2021). Forecasting government support in Irish general elections: Opinion polls and structural models. International Journal of Forecasting, 37(4), 1654–1665. https://doi.org/10.1016/j.ijforecast.2021.03.006
- Reade, J. J., & Vaughan Williams, L. (2019). Polls to probabilities: Comparing prediction markets and opinion polls. International Journal of Forecasting, 35(1), 336–350. https://doi.org/10.1016/j.ijforecast.2018.04.001
- Reisach, U. (2021). The responsibility of social media in times of societal and political manipulation. European Journal of Operational Research, 291(3), 906–917. https://doi.org/10.1016/j.ejor.2020.09.020
- Rigdon, S. E., Sauppe, J. J., & Jacobson, S. H. (2015). Forecasting the 2012 and 2014 elections using Bayesian prediction and optimization. SAGE Open, 5(2), 215824401557972. https://doi.org/10.1177/2158244015579724
- Schmidt, V. A. (2012). What happened to the state-influence market economies (SMEs)? France, Italy and Spain confront the crisis as the good, the bad and the ugly. In W. Grant & G. K. Wilson (Eds.), The consequences of the global financial crisis; The rhetoric of the reform and regulation (pp. 156–186). Oxford University Press.
- Shahmanzari, M., Aksen, D., & Salhi, S. (2022). Multi-period travelling politician problem: A hybrid heuristic metaheuristic solution method. Journal of the Operational Research Society, 73(6), 1325–1346. https://doi.org/10.1080/01605682.2021.1895684
- Taleb, N. N. (2017). Skin in the game: The hidden asymmetries in daily life. Penguin Random House.
- Taleb, N. N. (2018). Election predictions as martingales: An arbitrage approach. Quantitative Finance, 18(1), 1–5. https://doi.org/10.1080/14697688.2017.1395230
- Wang, X., Yang, M., & Fry, M. J. (2015). Efficiency and equity tradeoffs in voting machine allocation problems. Journal of the Operational Research Society, 66(8), 1363–1369. https://doi.org/10.1057/jors.2014.107
- Wlezien, C., Jennings, W., Fisher, S., Ford, R., & Pickup, M. (2013). Polls and the vote in Britain. Political Studies, 61(Suppl. 1), 66–91. https://doi.org/10.1111/1467-9248.12008