
Abstract
This article describes a cycle of teacher collaborative inquiry called the Student Experience Improvement Cycle (SEIC). The SEIC is a novel form of assessment: It focuses on supporting teachers in using evidence of the quality of student experience formatively to make the classroom more equitable. The SEIC begins by setting a goal for improvement in one of three aspects of student experience: coherence, relevance, and contribution. Then teachers review, adapt, and test research-based strategies for improving the quality of student experience overall and for students from systemically marginalized groups and communities. The article presents examples of improvement goals teachers set and the strategies they tried as part of one inquiry cycle. It also provides examples of survey items used to elicit student experience.

A goal for students as presented in A Framework for K–12 Science Education is to give students a real feeling for what it is to do science (National Research Council Citation2012). This requires more than just engaging students in practices; students need to be able to answer questions related to phenomena and problems that are important to their communities. This also entails providing students with experiences of building knowledge together, just like scientists do.
But how do we know if our students are getting a feeling for doing science, which students are answering questions they care about, and who is and isn’t contributing to knowledge building? Most traditional assessments focus on outcomes of science learning—such as whether students can give a canonical explanation of a well-known phenomenon or whether they can label the parts of a cell. Even good 3D assessments don’t always give us much insight that a teacher could use to make their instruction more relevant or inclusive.
Even if teachers value knowing about how their students are experiencing science, they face tremendous pressure to use their time on assessments that can help them add something to their gradebook. It is not always clear what to do if you learn that your students aren’t interested in a lesson or if they feel their ideas aren’t taken up by others in classroom discussions. But assessing students’ experience of the classroom can be a relatively easy thing to do through a short survey given at the end of science class to support equitable classrooms.
Gathering and using data on student experience
Two of us have been supporting teachers in gathering and making use of data on student experience for the past several years across several different projects. As we were working with Denver Public Schools teachers, we encouraged teachers to administer short, end-of-class surveys using Google Forms to gauge how often students shared ideas out loud in class and how interested they were in the day’s lesson. We saw that students’ experiences varied widely from lesson to lesson and from teacher to teacher. We also saw that the quality of student experience predicted their performance on a three-dimensional assessment (Penuel et al. Citation2018). We wanted to figure out how to use the data as assessment information to improve the quality and equity of students’ classroom experience.
The Student Experience Improvement Cycle (SEIC) can be undertaken by any group of teachers working as a school-based or district-supported team. Science leaders and researchers from the inquiryHub research-practice partnership in Colorado developed the SEIC. Each cycle involves a four-step process of (1) deciding on a goal for improving the quality of student experience, (2) choosing a research-based strategy for improvement, (3) collecting data on student experience, and (4) analyzing data and deciding what to do next. It is supported by a web-based platform for collecting and visualizing data called the Science SEET (Student Electronic Exit Ticket). The SEET website houses resources that help teams engage with research on how to improve the quality of students’ participation in science. The SEIC can work well with any instructional materials aligned to the Next Generation Science Standards.
Setting a goal for improvement
Teachers first develop an improvement goal in one of three broad categories of student experience. The first is coherence. Coherence refers to the extent to which students can see the connection between the day’s lesson and a phenomenon they are studying. Coherence from the student point of view is important because it gives students a feeling for how scientists use science and engineering practices, crosscutting concepts, and core ideas to make sense of phenomena (Reiser et al. Citation2021). The second category from which teachers can choose is relevance. Relevance refers to the degree to which the day’s topic is interesting to students and addresses matters of importance to their communities. This focus relates to a key goal of the Framework, namely, that all students should be provided the opportunity “to systematically investigate issues related to their personal and community priorities” (National Research Council Citation2012, p. 278). The third category is contribution. Contribution refers to the degree to which students share ideas aloud with peers and in whole-class discussion to help build the class’s understanding of a phenomenon. This category is important, because to get a feeling for science, students need to have a sense of agency for building knowledge and have their contributions recognized by others (Stroupe Citation2014).
Within these three categories, a teacher team can set a more specific improvement goal. Below is one example of a specific aim that a group of teachers articulated:
We aim to improve our learners’ contribution to the classroom and epistemic agency by increasing their influence on the learning activities, building self-efficacy, and strengthening their overall perception of their learning, [and] by increasing the percentage of students from groups (e.g., Latinx students, students who identify as female) who answer yes to two survey questions: Did any of your ideas influence the class or help others? and The teacher guides us to share our prior experiences or ideas about a phenomenon or topic to inform what we will do next.
Adapting evidence-based strategy for improvement
Once a team develops an improvement goal, the team reviews some research-based strategies for how to make progress toward that category of goal. For example, in the category of coherence, educators might learn about how to make clear what the learning targets for a lesson are (Moss, Brookhart, and Long Citation2013). In science classrooms, that involves clarifying the role of the day’s investigation in helping address a question that students have formulated about a phenomenon or a gap in their models of the phenomenon. Another strategy is to conclude the lesson with a summary of what was learned and how it connects with the larger goal for a unit.
In the SEIC, it is not necessary to read original research articles, but it is critical that the strategies are described in enough detail for teachers to know what is required to implement them. In the previous coherence example, teacher teams have access to a teaching routine used in storyline curriculum, the navigation routine, that specifies different kinds of questions that a teacher can ask at the beginning of a lesson (“What did we figure out last time? What questions are left for us to investigate?”) and at the end of the lesson (“What did we figure out today about our phenomenon? What question should we investigate next?”). Specifying the purposes and steps involved in implementing a strategy helps them to know what to do in the classroom and helps team members learn from each other. More examples of strategies introduced in the SEIC are in .
TABLE 1: Research-based strategies introduced in the SEIC.
Another characteristic of the SEIC strategies is that they are intended to be small but important moves that a teacher can try out easily over the course of a single class or several days. For example, one teacher team sought to improve student contributions by getting all students to use hand signals to indicate whether they agree with an idea, disagree with an idea, or want to build on another student’s idea. Another teacher sought to improve relevance by having students reflect on the importance of the phenomenon they were studying. This teacher said, “Our warm-up asked about relevance to our community. (Why would it be helpful for people to understand how the one-way mirror works?).” Making change strategies manageable (“small”) makes it more practical for teachers to try them out in the classroom, and sometimes they can have a big payoff in terms of the quality of student experience.
Collecting data on student experience
Teachers use the Science SEET System to gather data on student experience. It is accessible on a fee-for-service basis to schools and districts. First, teachers create classes in the system and assign students system-generated individual IDs to use to log into the system, instead of using their names. It is important to note that the SEET System protects students’ privacy by not collecting their names; if there are fewer than three students in a student group, it does not display disaggregated data to teachers. The teacher team chooses the items from the different categories they would like to use in an end-of-class survey of student experience (see for all possible items). The ideal is to choose between six and nine items that are closely tied to the team’s improvement goal and to limit the number of items to those that can be answered in a few minutes at the end of class.
TABLE 2: Examples of possible exit ticket items.
When students first log onto the system, it asks them several questions about their backgrounds. Students self-identify their race and ethnicity, their gender, and their home language. These data are collected to help teachers later analyze how equitable the student experience is in their classrooms.
Over the course of a SEIC, teams collect data multiple times. It is helpful to collect baseline data before testing out a strategy. In addition, it is useful to collect data each time that a teacher tries the research-based strategy to test out whether it does in fact support the improvement goal set by the team.
Analyzing data and deciding what to do next
The last step in the SEIC is to analyze data as a teacher team. For many educators, a first look at student experience data can be either upsetting or confirming of one’s intuition. It can be difficult to learn, for example, that only 30 percent of students found a lesson you were excited about to be personally meaningful to them. Thus, there is a protocol teacher teams can follow that begins with looking at emotional responses to the data. Next, teams identify patterns in the data before interpreting the data in light of what happened in their classrooms on the day they administered the SEET.
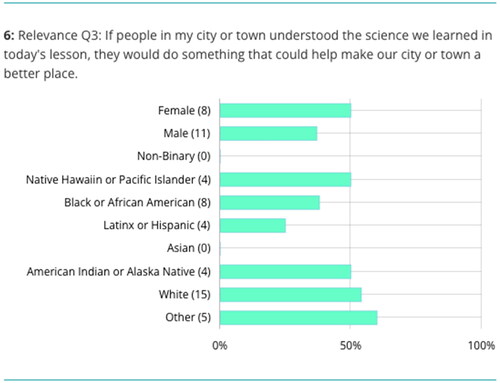
The Science SEET supports teachers in looking at data over time and analyzing data disaggregated by race/ethnicity and by gender (). shows the percentage of boys and girls, as well as the percentage of students identifying with different races or ethnicities, indicating that the day’s lesson was important to making their community better. Teachers that use these visualizations are more likely to notice patterns related to inequity of student experience. All three of the equity visualizations prompted reflections on gender and race.
Sample equity-oriented visualization of data.
Finally, teachers engage in a structured discussion using a protocol to talk about the effectiveness of the strategies and how future educators can implement them in science classrooms. The protocol invited teachers to reflect on the patterns in the data and their conjectures for why the strategies were or were not effective and to propose strategies for how to make the strategy more effective in their own and other teachers’ classrooms. This is an important feature for ensuring that the focus is on strategies that can improve all students’ experience at the classroom or small-group level.
Teacher’s experiences of the SEIC
Implementation of the SEIC with two groups of teachers resulted in improvements to the quality and equity of student experience in middle school science classrooms (Raza, Penuel, and Salinas del Val Citation2022). In one cohort, there was a significant increase in students’ perceptions of coherence across classrooms. In a second classroom, students’ perceptions of relevance improved, particularly among Black students.
Other teachers shared their survey data with students, which sparked a discussion and deep reflection among students and the teacher about how to improve participation in class. One teacher wrote that she presented results from a contribution question as to whether students felt their ideas were heard, after observing that few students felt this way. She discovered, based on a Jamboard discussion where students could contribute anonymously, that students were afraid to voice their opinions because they were afraid of getting teased by other students. This caused her to reflect on her own classroom management and to create additional norms for how students were expected to participate in class.
Importance of assessments of student experience
Gathering data on student experience is not a typical part of classroom assessments. But as teachers who have used the SEIC have testified, these data can make a real difference in students’ opportunities to participate in science classrooms. In addition, teachers can use them to change their own instruction in ways that align more with the vision of A Framework for K–12 Science Education. •
Additional information
Notes on contributors
William Penuel
William Penuel ([email protected]) is a Distinguished Professor in the Institute of Cognitive Science, Ali Raza is a research associate in the Institute of Cognitive Science, and Yamileth Salinas Del Val is a graduate student in the School of Education, all at the University of Colorado Boulder. Rosa Salinas-Estevez is a STEM content specialist at Houghton Mifflin Harcourt Publishing Company in Boston, Massachusetts. Emily Williamson is a science teacher at Brentwood Middle School in Brentwood, Missouri. Jennifer Smith is a science and mathematics teacher at Mahomet-Seymour Junior High School in Mahomet, Illinois. Quincy Gill is a science teacher at Evergreen High School in King County, Washington.
References
- Bang, M., B. A. Brown, A. Calabrese Barton, A. Rosebery, and B. Warren. 2017. “Toward More Equitable Learning in Science: Expanding Relationships among Students, Teachers, and Science Practices.” In Helping students make sense of the world using next generation science and engineering practices, edited by C. Schwarz, C. Passmore, and B. J. Reiser, 33–58. Arlington, VA: NSTA Press.
- Brown, B. A., and K. Ryoo. 2008. “Teaching Science as a Language: A “Content-First” Approach to Science Teaching.” Journal of Research in Science Teaching 45 (5): 529–553.
- DeBarger, A. H., W. R. Penuel, C. K. Boscardin, S. Moorthy, Y. Beauvineau, C. Kennedy, and K. Allison. 2017. “Investigating Science Curriculum Adaptation as a Strategy to Improve Teaching and Learning.” Science Education 101 (1): 66–98. https://doi.org/10.1002/sce.21249.
- Fine, C., and E. M. Furtak. 2020. “The SAEBL Checklist: Science Classroom Assessments That Work for Emergent Bilingual Learners.” The Science Teacher 87 (9): 38–48.
- Moss, C. M., S. M. Brookhart, and B. A. Long. 2013. “Administrators’ Roles in Helping Teachers Use Formative Assessment Information.” Applied Measurement in Education 26 (3): 205–218. https://doi.org/10.1080/08957347.2013.793186.
- National Research Council. 2012. A Framework for K–12 Science Education: Practices, Crosscutting Concepts, and Core Ideas. Washington, DC: National Academies Press. https://doi.org/10.17226/13165.
- Patterson, A. D. 2019. “Equity in Group Work: The Social Process of Creating Justice in a Science Classroom.” Cultural Studies of Science Education 14 (2): 361–381.
- Penuel, W. R., K. Van Horne, J. Jacobs, and M. Turner. 2018. “Developing a Validity Argument for Practical Measures of Student Experience in Project-Based Science Classrooms.” Paper presented at the Annual Meeting of the American Educational Research Association, New York, April.
- Raza, A., W. R. Penuel, and Y. Salinas del Val. 2022. “Supporting Science Teachers in Using Student Experience Data to Support More Equitable Participation in Science Classrooms.” Paper Presented at NARST Annual Conference, Vancouver, CA, March.
- Reiser, B. J., M. Novak, T. A. W. McGill, and W. R. Penuel. 2021. “Storyline Units: An Instructional Model to Support Coherence from the Students’ Perspective.” Journal of Science Teacher Education 32 (7): 805–829. https://doi.org/10.1080/1046560X.2021.1884784.
- Resnick, L. B., S. Michaels, and M. D. O’Connor. 2010. “How (Well Structured) Talk Builds the Mind.” In Innovations in educational psychology: Perspectives on learning, teaching, and human development, edited by D. Preiss and R. J. Sternberg, 163–194. New York: Springer.
- Stroupe, D. 2014. “Examining Classroom Science Practice Communities: How Teachers Negotiate Epistemic Agency and Learn Science as Practice.” Science Education 98 (3): 487–516. https://doi.org/10.1002/sce.21112
- Theobald, E. J., S. L. Eddy, D. Z. Grunspan, B. L. Wiggins, and A. J. Crowe. 2017. “Student Perception of Group Dynamics Predicts Individual Performance: Comfort and Equity Matter.” PloS One 12 (7): e0181336. https://doi.org/10.1371/journal.pone.0181336.
- Weizman, A., Y. Shwartz, and D. Fortus. 2008. “The Driving Question Board: A Visual Organizer for Project-Based Science.” The Science Teacher 75 (8): 33–37.
- Wingert, K. 2017. Supporting Language-Minoritized Students in Science Practices Within a Research-Practice Partnership. Seattle, WA: University of Washington Seattle.