
 ?Mathematical formulae have been encoded as MathML and are displayed in this HTML version using MathJax in order to improve their display. Uncheck the box to turn MathJax off. This feature requires Javascript. Click on a formula to zoom.
ABSTRACT
Isotope source tracing enables to accurately determine the fate of nutrients that are applied with fertilizers to soils. While this approach is well established for major nutrients such as nitrogen, it is not yet established for trace metals. Here, we aimed to determine the fate of the micronutrient zinc (Zn) and the contaminant cadmium (Cd) that were applied with an organic fertilizer to a soil–wheat system. A pot study was conducted in which wheat was grown on an alkaline soil. The soils received green manure and/or soluble Zn fertilizer and were compared with non-fertilized control treatments (n = 4 experimental replicates). The green manure was labelled with the stable isotopes 67Zn and 111Cd. For an efficient sample throughput, a method was provided and validated to determine enriched stable isotope ratios (67Zn:66Zn and 111Cd:110Cd) and the Zn and Cd concentrations in one analytical run. To this end, single collector ICP-MS analyses and stable isotope mass balances calculations were combined. Applying this method revealed that the addition of green manure increased neither Zn nor Cd concentrations in wheat grains due to biomass dilution effects. Isotope source tracing showed that the largest fraction of these metals in the wheat shoots derived from the soil in all treatments (Zn 87–99 %, Cd 94–98 %). Moreover, the addition of green manure increased the transfer of Zn and Cd from soil to wheat by a factor 1.9 for both elements. This increased transfer was likely related to a nitrogen fertilization effect that increased root and shoot biomass and thereby the soil exploration of the wheat. This study demonstrated how the fate and dynamics of multiple trace metals can be efficiently determined in soil–fertilizer–crop systems using isotope source tracing.
1. Introduction
Staple crops such as wheat are a major source of zinc (Zn) and cadmium (Cd) in human diets [Citation1]. Zinc is an essential micronutrient for all biota that is naturally present in soils. However, in alkaline soils, Zn is hardly plant-available which can limit plant growth and/or provide crops with low Zn concentrations [Citation2,Citation3]. An established way to increase the Zn nutritional content of crops is the application of mineral Zn fertilizers to soils or leaves [Citation4]. Such measures to increase Zn concentrations in crops are called ‘agronomic biofortification’ [Citation5]. Similar to Zn, Cd is naturally present in soils, but Cd is not essential for most organisms, including plants and humans [Citation6]. As it has a long residence time in the human body, its concentrations in staple crops should be kept to a minimum [Citation7]. Although Zn is a micronutrient and Cd is a pollutant, they follow similar pathways in soils and plants. For instance, the bioavailability of Cd in soils is controlled by similar soil properties as those of Zn, but Cd is generally less strongly bound in soils compared to Zn [Citation8–10]. In addition, Cd is taken up by membrane proteins that transport micronutrients such as manganese, iron and Zn [Citation6]. Therefore, agronomic measures that increase Zn concentrations in grains should ensure that Cd concentrations do not increase.
Previous studies have indicated that the application of green manure can increase the Zn concentrations in wheat grown on alkaline soils [Citation11–15]. Green manure is a plant-based organic fertilizer that is grown for the purpose of mixing it back into the soil to improve soil fertility [Citation16]. Using an isotope tracer, Aghili et al. [Citation12] showed that Zn in the wheat mostly derived from the soil and not from the green manure that was added to soils. In addition, the soil-to-wheat transfer of Zn increased upon the application of green manure. Hence, adding green manure to alkaline soils may improve the bioavailability of Zn in the soil that is not available to wheat without the application of green manure. Since the bioavailability and plant uptake of Cd is controlled in a similar manner as Zn, the addition of green manure could increase the bioavailability of Cd and thereby increase the concentration of Cd wheat grains.
The use of isotope tracers to study the fate of major nutrients such as nitrogen and sulphur in fertilizers is well established, while only a few studies used this approach for trace metals [Citation17–19]. As shown for major nutrients and also in the Zn study described in the previous paragraph [Citation12], isotope tracer methods allow to determine the fate of nutrients more accurately than non-isotope approaches that are solely based on mass balances [Citation20]. The mass balance method is based on the assumption that the additional Zn and Cd that is taken up by the plant solely derives from the soils [Citation21]. However, isotope methods have shown that this assumption is not always correct, particularly for Zn in alkaline soils [Citation12]. Moreover, a single application of pollutants like Cd with e.g. phosphorus fertilizers to soils does not necessarily lead to significant increase in Cd uptake in crops [Citation22]. Hence, mass balance approaches do not necessarily account for the complex dynamics in soil–fertilizer–plant systems which can lead to inadequate results [Citation21,Citation22]. So far, isotope tracer methods have been used to study the fate of Zn [Citation11,Citation12,Citation23–26] and Cd in mineral fertilizers [Citation22,Citation27,Citation28], and for Zn in organic fertilizers [Citation12,Citation21,Citation29]. However, this approach has not yet been used to study the fate of Zn and Cd simultaneously. A double labelling of a fertilizer with these elements could provide novel insights into the fate and dynamics of these chemically similar elements in soil–fertilizer–plant systems.
Enriched stable isotopes of Zn and Cd are less demanding to work with compared to radioisotopes in terms of safety measures, transport, applicability in field trials and waste management [Citation29]. However, isotope ratios of Zn are challenging to measure as Zn is very prone for sample contamination during sample processing in the laboratory (i.e. blank sensitive). This is problematic for the determination of Zn isotope ratios, as the Zn that is introduced into the sample has a different isotopic composition (i.e. natural abundance) compared to the samples that contain an isotope label. In addition, Cd concentrations that are relevant for crop production can be challenging to analyse. In such systems, typical Zn:Cd ratios range from 100 to 300 (µg µg–1) [Citation30]. These low but relevant Cd concentrations in staple crops can also complicate isotope ratio analyses via single collector inductively coupled plasma mass spectrometry (ICP-MS) through spectral and non-spectral interferences [Citation29,Citation31]. A way to overcome these challenges is to work with clean reagents and fume hoods with particle filtered air to minimize sample contamination. In addition, so-called sample purification procedures are applied to remove matrix elements (i.e. all metals except the target metals) [Citation32]. The purification step allows the pre-concentration of the samples and minimization ofspectral and non-spectral interferences [Citation27,Citation29]. Thereby, the quality of the isotope ratio measurements can be improved.
Measuring Zn and Cd concentration in samples that contain enriched stable isotopes is challenging. In such samples, the isotope abundances differ compared to samples at natural abundance. These differences in isotope abundances are problematic for quantification using ICP-MS, which is performed by measuring a single isotope in a sample and assuming that this isotope is at natural abundance (NA). To overcome this difficulty, measurement techniques that are not sensitive to isotope abundances of an element, such as atomic absorption spectroscopy (AAS) or optimal emission spectroscopy (ICP-OES), can be applied to determine Cd concentrations [Citation21,Citation33]. In this case, two different analytical instruments are used to determine Cd isotope ratios and Cd concentrations separately. Alternatively, Bracher et al. proposed that solely ICP-MS could be applied to resolve enriched Cd isotope ratios and to determine Cd concentrations [Citation27]. To this end, concentrations that are determined with ICP-MS need to be corrected by using isotope mass balance calculations. Such a combined ICP-MS analyses and isotope mass balance method could also be used for Zn. This would save resources such as time, electricity and argon, thereby increase the sample throughput for trace metal isotope source tracing experiments.
The objective of this study was to determine the fate of the micronutrient Zn and the contaminant Cd that were applied with an organic fertilizer to a soil–wheat system. To this end, we refined a previously proposed method [Citation27] that combines ICP-MS analyses with Cd isotope mass balances. The refinements included (i) a full isotope mass balance calculated in a code-based script for the statistical software ‘R’ that can be applied for isotope source tracing approaches and (ii) a validation using a non-isotope sensitive instrument. We then applied this method in a pot trial by using a 67Zn and 111Cd labelled green manure to determine the dynamics of Zn and Cd in a soil-green manure–wheat system.
2. Material and methods
2.1. Preparation of 67Zn and 111Cd labelled green manure
Sunflower (Helianthus annus L.) was chosen to produce green manure as it has been previously shown to increase the soil-to-wheat transfer of Zn [Citation12,Citation14]. To this end, sunflower seeds were sterilized in 15 % H2O2 for 15 min and rinsed with ultrapure water (>18.2 MΩ). They were then placed into a sand bed (2–5 mm) which was initially washed with ultrapure water. The seeds germinated for six days in the greenhouse and were regularly moistened. Afterwards, the seedlings were transferred to a hydroponic system that contained a full-strength Hoagland nutrient solution. Three hydroponics that contained 17 L of demineralized water (i.e. not ultrapure) and nutrient solution were isotopically labelled with 0.05 mg L–1 67Zn (relative abundance = 0.97) and 0.01 mg L–1 111Cd (relative abundance = 0.96). The sunflower was grown in a greenhouse that was set to a photoperiod of 14 h with a light intensity > 30 klx, temperatures of 17 °C at night and 24 °C during the day, and relative humidity of 60 %. After three weeks of growth, the stem and leaves of the sunflower were harvested and oven-dried at 45 °C for 2.5 days. The sunflower was then finely ground to powder in a rotary mill equipped with tungsten carbide cups. The chemical composition of the sunflower green manure is summarized in the supplementary information (SI, Table S1).
2.2. Pot trial
To select a soil for the pot trial, we screened databases of Swiss research institutions (Agroscope, Swiss Federal Institute for Forest, Snow and Landscape Research WSL) that maintain soil monitoring networks. We selected a forest soil as a model soil, as its pH was alkaline which induces low Zn bioavailability in soils [Citation2,Citation34]. The model soil was collected between 10 and 40 cm depth (Ah and BC horizon), sieved to 5 mm, and was well mixed in a clean concrete mixer.
A cross-factorial pot trial with the factors green manure addition (0 g (kg soil)–1, 1 g (kg soil)–1, 4 g (kg soil)–1) and mineral Zn fertilization (0 mg (kg soil)–1, 5 mg (kg soil)–1) was set up with four experimental replicates. The green manure (labelled with 67Zn and 111Cd) and mineral Zn treatments (not labelled) were thoroughly mixed into the soil. The mass of Zn and Cd added with the green manure per pot (1 kg of soil) was 30 and 0.77 µg of Zn and Cd in the 1 g green manure treatment, respectively. In the 4 g green manure treatment, the mass added was 120 and 3 µg of Zn and Cd, respectively (Table S1). In addition, to ensure healthy plant growth and to avoid nutrient deficiencies, a basal fertilization for soils that contained macro- and micronutrients, but no Zn, was applied to all pots (Table S2), also via thorough mixing. The wheat seeds (Triticum aestivum L., cv. Fiorina) were germinated in the same way as the sunflower seeds. After six days, wheat seedlings were transplanted to each of the 24 pots each containing 1 kg of dry soil that was sieved to 5 mm.
During plant growth, the soil water content was kept between 40 and 80 % of its maximal water holding capacity by adding ultrapure water (>18.2 MΩ) to the soil. The greenhouse settings were identical to those used for green manure production. The pots were randomly arranged in the greenhouse and frequently randomized during wheat growth. Straw and grains were harvested at maturity (102 days after transplantation). The wheat shoots were rinsed with deionized water and dried at 45 °C in closed paper bags in a pre-cleaned oven. The soil was carefully removed from the roots and the roots were dried at 45 °C. After drying, dry weights of roots, straw and grains were recorded. The plant shoot material was then finely ground to a powder in a rotary mill equipped with tungsten carbide cups.
2.3. Sample processing
For isotope ratio analyses of Zn and Cd, 0.2 g of milled plant material was digested in a high-pressure single reaction chamber microwave system (turboWave, MWS microwave systems) using 4 mL double distilled 6–7 M nitric acid (HNO3). The digested sample was purified using a rapid one stage column chemistry protocol to reduce elements that cause both spectral and non-spectral interferences during Zn and Cd isotope measurements [Citation29]. The sample purification procedure was conducted in a laminar flow fume hood with filtered air. In addition, all acids used were double-distilled and all beakers and test tubes were pre-cleaned with diluted HNO3. To this end, the digested samples were evaporated and redissolved in a 1M HCl matrix to ensure that Zn and Cd were present as Zn and Cd chlorides (Table S3). The samples were then loaded onto an anion exchange resin to remove the sample matrix (i.e. elements such as Ca, Mg, Ni and Cu). Finally, Zn and Cd were eluted from the column using 2M HNO3. After the purification, the samples were evaporated and re-dissolved in 0.3M HNO3 to determine 67Zn:66Zn and 111Cd:110Cd. For each batch of samples that was processed (typically n = 13 samples), a procedural blank was included to quantify the amount of Zn and Cd contamination derived from the sample processing in the laboratory.
2.4. Isotope ratio measurements and concentration calculations
Prior to isotope ratio measurements, the ICP-MS (7500ce, Agilent Technologies) was tuned to maximize the sensitivity while keeping oxides and doubly charged ions below 2 %. The integration time for the data acquisition was set to 0.5 and 1.5 s for Zn and Cd, respectively. In addition, the ICP-MS was set for isotope measurements to increase the scans from 100 (concentration mode) to 1000 (isotope mode).
The isotopic composition of Zn and Cd in the soil (i.e. a Zn and Cd source) was assumed to be at natural abundance according to the International Union of Pure and Applied Chemistry (IUPAC) [Citation35]. This assumption is valid as the natural variation of Zn and Cd isotope ratios are smaller than the precision required to adequately resolve Zn and Cd isotope ratios in a tracer experiments [Citation29,Citation36]. For the green manure (i.e. a Zn and Cd source), all stable Zn and Cd isotopes were measured to determine their abundances. In this sample, the isotopes 60Ni, 72Ge, 105Pd, 115In and 118Sn were additionally measured. These isotopes were used to correct for isobaric interferences of 64Ni (64Zn), 70Ge (70Zn), 110Pd (110Cd), 113In (113Cd) and 116Sn (116Cd). For the plants (i.e. the Zn and Cd in the sink), only the 67Zn:66Zn and 111Cd:110Cd ratios were determined (see also Equations (5)–(8)). As internal standards, Sc and In were added to the samples and their isotopes 45Sc and 115In were used to correct for signal drifts during the measurements. In addition, 105Pd was measured to correct the isobaric interference of 110Pd with 110Cd using isotope abundances reported by the IUPAC [Citation35]. Prior to isobaric interference corrections, the signal of the ICP-MS (counts per second, CPS) that was obtained in the blank was subtracted from the CPS in the samples. These subtractions were important as the blank had an isotopic composition at natural abundance while most of the sample had an isotopic composition at non-natural abundance. The blank evaluation revealed that the CPS that derived from blanks for Zn accounted on average for 2 % to the total CPS in the plant samples. The maximum blank accounted for 10 % in a sample with low Zn concentrations. For Cd, the average and maximal blank accounted for 0.80 and 4.5 % in the samples. After the blank and interference corrections, the instrumental mass bias was corrected using a commercial Zn or Cd standard solution. This standard solution was diluted to match the sample matrix (0.3M HNO3) and to provide a similar Zn and Cd concentration as the plant samples. This standard solution was frequently measured in a standard-sample-bracketing sequence once every four samples [Citation37]. The mass bias (mb) was then calculated as:
(1)
(1) where mb is expressed as Δu and was typically greater than one. IUPAC refers to the reference values (i.e. isotope abundances) used to determine the ‘true’ isotope ratios [Citation35]. The mass bias corrected 111Cd:110Cd isotope ratios are then calculated using a linear correction [Citation27]:
(2)
(2) where R represents the 111Cd:110Cd isotope ratio. The average mass biases for 67Zn:66Zn and 111Cd:110Cd were on average both ∼2 % and ranged from 1.8 to 3.7 % for Zn and 1.1 to 3.0 % for Cd. The analytical precision of the isotope ratios was 0.49 % for Zn and 1.38 % for Cd. These values refer to a relative standard deviation of a set of samples (n = 8) with an isotopic composition at non-natural abundance that was measured twice.
The Zn and Cd concentrations in the wheat samples had an isotopic composition at natural and non-natural abundance. Hence, the Cd concentrations in the wheat samples were determined based on ICP-MS results and isotope mass balance calculations. If a sample contains 111Cd and 67Zn from the labelled source (here the green manure), the abundance of all stable Cd and Zn isotopes changes in the sink samples (here wheat) compared to samples that have not received 111Cd and 67Zn from the labelled source. These changes in the abundances of all Cd and Zn isotopes can be calculated by using a full isotope mass balances that includes all isotopes of an element. These calculations require the analyses of the interference, mass bias and blank corrected isotope ratios 67Zn:66Zn and 111Cd:110Cd (Equation (2)) as well as the Cd and Zn mass fraction in the wheat that derived from the green manure and the soil. For instance, the abundance of 110Cd in wheat samples that contained Cd from the soil (natural abundance) and from the green manure (non-natural abundance in the labelled source) can be calculated as follows:
(3)
(3) SA110 is expressed as the molar fraction between 0–1 (no unit). The fractions of Cd that derived from the green manure (fCdgm) and the soil (fCdsoil) were calculated according to Equation (8). Note that Equation (3) was applied to all stable Cd isotopes by replacing 110Cd with 106Cd, 108Cd, 111Cd, 112Cd, 113Cd, 114Cd and 116Cd. The sum of all SAx should be equal to 1. For all isotopes that were not measured in the wheat samples (106Cd, 108Cd, 112Cd, 113Cd, 114Cd and 116Cd), the specific abundances (SAx) were converted into CPS. Exemplified for 106Cd, the CPS of 106Cd in a wheat sample was calculated as:
(4)
(4) where mb denotes the mass bias (see Equation (1)). This equation was applied for 108Cd, 111Cd 112Cd, 113Cd, 114Cd and 116Cd by replacing 106Cd with these isotopes. In the next step, the sum of all CPS (including 110Cd) was calculated. To this end, Equation (4) was applied to calibration standards that contained a defined Cd concentration to establish a calibration curve. As these standards had a Cd isotope composition at natural abundance, the SAx values in Equation (4) were replaced by NAx values isotopic compositions reported by IUPAC [Citation35]. Then, the sum of the CPS of all Cd stable isotopes in the calibration standards were calculated. Finally, the slope and the intercept were calculated to convert the sum of CPS in the samples into Cd concentrations. Note that Equations (3) and (4) also apply for 66Zn as well as 64Zn, 67Zn, 68Zn and 70Zn. All these calculation steps for Cd are exemplified in the SI as code-based script for the open-source software R (version 4.2.0). This combined ICP-MS analyses and isotope mass balances calculation method was then validated by (i) measuring certified standard reference materials (CRMs), and (ii) by comparing the results with samples obtained by the non-isotope sensitive ICP-OES (Shimadzu, ICPE-9820).
2.5. Source tracing calculations
The isotope labelling of the green manure allowed us to calculate the contribution of the sources (soil, green manure) to the sink (plant) [Citation21,Citation24]:
(5)
(5)
(6)
(6) Znplant and Cdplant denote the Zn and Cd mass in the plant (in µg (kg soil)–1), Znsoil and Cdsoil denote the Zn and Cd mass derived from soil (in µg (kg soil)–1) and Zngreen manure and Cdgreen manure denote the Zn and Cd mass derived from green manure (in µg (kg soil)-1). ‘Plant’ represents wheat shoots, straw and grains. Shoots represent the total aboveground biomass (straw and grains), straw represents the biomass that can be brought back to the field, and grains represent the part of the crop that is used for human nutrition.
The mass fractions of Zn (fZn_green manure) and Cd (fCd_green manure) derived from the green manure were calculated according to McBeath et al. [Citation24]:
(7)
(7)
(8)
(8) NA denotes the natural abundance of the mentioned isotopes according to IUPAC [Citation35], and SA is the specific abundance of the isotopes in the 67Zn and 111Cd labelled green manure. The IRplant stands for the isotopic ratio of 67Zn:66Zn or 111Cd:110Cd in the wheat samples. ‘Plant’ represents shoots, straw and grains of the wheat. Following these calculations, the fraction derived from the soil (fsoil) in the wheat samples can be calculated by 1-fgreen manure. The percentage of Zn and Cd from the added green manure that was recovered in the plants was calculated as follows:
(9)
(9)
(10)
(10) Znplant and Cdplant denote the total Zn or Cd mass in the wheat samples (µg (kg soil)–1). Znadded and Cdadded denote the quantity of Zn in the green manure added per kilogram soil (in µg (kg soil)–1). Also here, ‘plant’ can be replaced by wheat shoots, the straw (stems and leaves) and grains.
2.6. Statistics
Significant differences of the mean (p < 0.05) between the treatments were determined using a two-way ANOVA followed by a Tukey HSD test. Prior to the ANOVA, the equality of variances and the distribution of residuals were tested using a Levene test and visual inspection, respectively. If the prerequisites were not fulfilled, the data was either log10, square root, or 1/x transformed. If the prerequisites for an ANOVA were still not fulfilled, a non-parametric and one factorial Kruskal–Wallis test was applied. As this test is only one-factorial, a superfactor was constructed that crossed all combined factors. If ANOVA or Kruskal–Wallis tests were significant, statistical differences between individual treatments were tested using Tukey HSD test for ANOVA and Conover–Iman test for the Kruskal–Wallis test. All statistical analyses and data figures were conducted using the statistical software R (version 4.2.0). Conceptual models and graphical abstract were created with BioRender.com.
3. Results and discussion
3.1. Validation of the combined ICP-MS analyses and isotope mass balance calculations in the certified reference materials
The combined ICP-MS analyses and isotope mass balance calculations were mostly consistent with the CRM samples (). The Zn concentration of the CRMs ranged from 11 to 80 mg kg–1 and thereby represented the majority of the samples in this study (14–150 mg kg–1). The Zn recovery was within 100 ± 11 %, indicating that the combined ICP-MS analyses and isotope mass balance approach is adequate to determine Zn concentrations in plant samples. In samples with Cd concentrations > 0.05 mg kg–1, the Cd recovery was within 100 ± 1 %. However, for CRMs with Cd concentrations < 0.05 mg kg–1, the accuracy of the approach was not sufficient (± 39 %). This low accuracy was related to the low Cd concentration in the CRM (0.025 mg kg–1) which resulted in a very low signal (CPS < 200). For samples with such a low Cd concentration, a better signal could be achieved by using newer generation ICP-MS devices [Citation27] or by digesting and purifying more sample material [Citation27,Citation38]. However, since the Cd concentrations in the samples of this study ranged from 0.14 to 0.99 mg kg–1, the procedural and analytical method chosen was sufficiently accurate.
Table 1. Evaluation of the certified reference material (CRM) measured by combined ICP-MS and isotope mass balance calculations.
3.2. Validation of the combined ICP-MS analyses and isotope mass balance approach for the analyses of isotopically enriched plant material
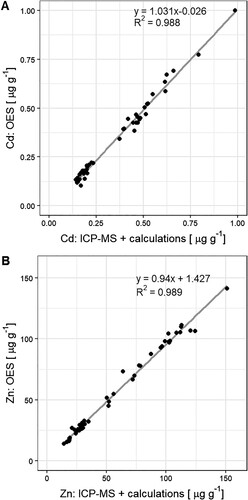
The results of the combined ICP-MS analyses and isotope mass balance approach strongly correlate with ICP-OES results for Cd and Zn (). For Cd, the average difference between the concentrations obtained with both instruments was 4 ± 7 %. The same comparison for Zn revealed a difference of 4 ± 9 %. Note that the Cd concentrations measured with ICP-OES could only be adequately determined because the samples could be pre-concentrated during the purification procedure. These results demonstrated that the procedure including digestion, purification, analysis with single collector ICP-MS, and isotope mass balance calculations was suitable to determine concentrations above 10 mg kg–1 Zn and 0.05 mg kg–1 Cd in wheat samples.
Figure 1. Comparison of analytical methods used to analyse cadmium (Cd) and zinc (Zn) concentrations in wheat samples that contain enriched stable isotopes (67Zn, 111Cd). ‘ICP-MS + calculations’ refers to inductively coupled plasma mass spectroscopy combined with isotope mass balance calculations. ‘OES’ refers to inductively coupled plasma optical emission spectroscopy.
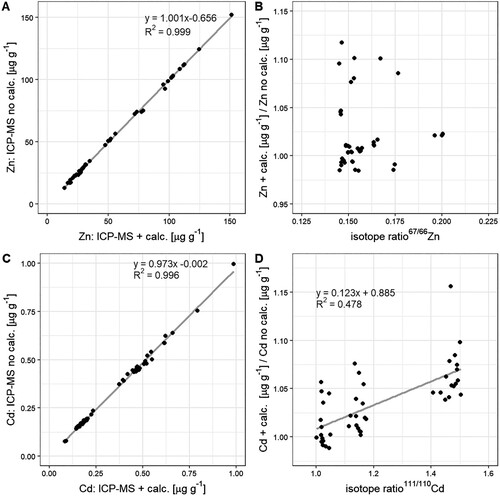
The 111Cd:110Cd isotope ratios in the wheat samples ranged from 1.025 (natural abundance) to 1.503 (non-natural abundance). Consequently, the isotope abundance of 110Cd increased from 0.125 at natural abundance to 0.177 at non-natural abundance. These changes were small, given that the abundance of 110Cd in the green manure was 0.007. For Zn, the range of isotope ratios and 66Zn abundances were smaller than for Cd since the isotope enrichment in the green manure was lower for Zn than for Cd (Table S1). These small changes indicate that the fractions of Zn and Cd that derived from the green manure (i.e. from the labelled source) were small as explained in detail in the section ‘green manure increased the soil-to-wheat transfer of Zn and Cd’. We further tested if these small changes in isotope abundances and isotope ratios introduced an error when the Cd and Zn concentrations in the wheat samples were measured conventionally. Conventionally means that the samples were treated as if their isotopic compositions were at natural abundance as the standards that were used to calibrate the ICP-MS for concentration measurements. For both elements, the ICP-MS results with and without calculations correlated significantly (A,C). However, no significant trend for Zn was found when the isotope ratios of 67Zn:66Zn were plotted against the ratios of concentration measurements with and without mass balance calculations (B). In contrast, a significant trend was found for Cd (B). When Cd was measured with a calibration curve at natural abundance, the difference between Cd concentrations determined with and without mass balance calculations ranged from about –2.5 to +5 %. For the samples that received 4 g of green manure and contained more 111Cd (i.e. higher isotope ratio 111Cd:110Cd), this difference increased from +4 to +10 %. The absence (Zn) and presence (Cd) of such a systematic error can be explained by the extent of the isotope enrichment in the labelled source. This enrichment was stronger for Cd than for Zn (Table S1). In addition, D showed that the need for a correction for isotope abundances to determine concentrations also depends on the fraction of the metal in the wheat that derived from the green manure. As isotope enrichment in the sources (here fertilizer) and sinks (wheat) can vary depending on the experimental design, we recommend testing whether or not the isotope mass balance calculations are required on a case-by-case basis.
Figure 2. Comparison of analytical methods used to analyse Zn (A, B) and Cd (B, C) concentrations in wheat samples that contain enriched stable isotopes (67Zn, 111Cd). ‘ICP-MS + calc.’ refers to inductively coupled plasma mass spectroscopy combined with isotope mass balance calculations. ‘ICP-MS no calc.’ refers to ICP-MS results with no isotope mass balance correction to correct for isotope ratios at non-natural abundance. Regression line was only plotted when the trend between x and y was significant.
3.3. Soil characterization and plant growth
The model soil had a total Zn concentration of 56.8 mg (kg soil)–1 (). This Zn concentration indicated that the soil was within typical Zn background values, meaning that the soil was not Zn contaminated [Citation8]. Soils were extracted using diethylenetriaminepentaacetic acid (DTPA) to provide an operationally defined soil pool that indicates the Zn and Cd bioavailability in the soil [Citation36,Citation39]. The soil DTPA-extractable Zn was 0.19 mg (kg soil)–1 and was thereby smaller than the defined thresholds (<1 mg (kg soil)–1) that potentially indicate a critically low bioavailability for plants [Citation2,Citation8]. The low DTPA-extractable soil pool could be related to the soil pH of 7.7. In such an alkaline soil, most of the Zn is typically sorbed to iron and manganese oxyhydroxides, soil organic matter and likely also sorbed to or precipitated with carbonate minerals [Citation2,Citation8,Citation34]. The latter were present in the soil of this study as indicated by its inorganic carbon content (). However, the total quantity of inorganic carbon of 34.9 g (kg soil)–1 was lower than in calcareous soils in semi-arid regions (65–250 g (kg soil)–1) that have been reported to induce Zn deficiencies in crops [Citation2].
Table 2. Selected soil properties.
Similar to Zn, Cd can sorb/precipitate in the soil to oxyhydroxides, soil organic matter and carbonates [Citation9,Citation40]. Hence, soil pH is also an important factor controlling the bioavailability of Cd. The total Cd concentration in the soil was 0.19 mg (kg soil)–1 () which represents Cd soil background concentrations [Citation9]. From this total stock of Cd in the soil, about 5 % was extractable with DTPA. This DTPA-extractable soil fraction was proportionally about one order of magnitude larger than for Zn (∼0.3 %). This comparison is supported by previous observations that Cd is generally less strongly bound to soils than Zn as shown e.g. with isotope exchange kinetics in contaminated soils [Citation10]. As a larger fraction of Cd was extractable by DTPA compared to Zn, the Zn:Cd ratio was narrower in the bioavailable soil pool compared to the bulk soil.
The shoot dry weight (DW) production increased in the low Zn soils with the addition of 1 and 4 g green manure (). Furthermore, the root DW production increased with the addition of 4 g green manure in these soils. Compared to previous pot studies that grew the same wheat cultivar, the shoot dry weight production in this study was at the lower end (3–17 g, [Citation15,Citation38,Citation41,Citation42]). This comparison suggests that the basal fertilization applied in this study did not fully cover the nutritional requirements of the wheat. The Zn concentrations in the grains were greater than 21 mg (kg DW)–1 (a). These concentrations indicate that Zn was not necessarily a growth-limiting factor [Citation43] despite the low Zn concentrations in the DTPA soil extracts (). This assumption is supported by the DW production in the low Zn soil which was not distinguishable from the mineral Zn fertilized soil ().
Table 3. Wheat harvest data.
Table 4. Zinc (Zn) and cadmium (Cd) concentrations and masses in wheat samples.
The increased shoot DW in the green manure treatments could have been induced by other nutrients besides Zn that were added with green manure. For instance, 90 mg (kg soil)–1 of nitrogen (N) were added to the soil with the basal fertilization (Table S2). By adding green manure to the soil, additional 50 mg (kg soil)–1 and 200 mg (kg soil)–1 of N were added with 1 or 4 g green manure, respectively. As N is crucial for DW production, these additional N inputs may have increased shoot and root DW [Citation44]. The response in DW production further suggests that the green manure was readily decomposed and the soil–wheat system was N limited, despite the basal N fertilization [Citation16,Citation45]. In addition to N, the concentrations of macronutrients P, K, Mg and Ca were not distinguishable in the green manure and the soils that have not received green manure (Table S4). This was also the case for the micronutrient Fe, that is, like Zn, hardly plant available in alkaline soils [Citation46]. Together, our results suggest that the addition of green manure improved the N nutrition of the wheat and thereby increased its DW production.
3.4. Green manure addition did not induce a Zn biofortification effect, but increased the Zn and Cd mass in the shoot
The addition of green manure to the soil did not increase the Zn concentrations in the wheat grains (a). Therefore, there was no Zn biofortification effect as shown in previous studies for alkaline soils [Citation12–14]. The absence of a Zn biofortification effect of the green manure can be explained by the strong differences in the DW production among the treatments (). For instance, the dry weight doubled when 4 g green manure was added to the soils compared to the soils that have not received green manure. In the same treatment, the Zn concentrations in the shoots did not differ from each other (a). However, the Zn mass in the shoot doubled from 66.1 µg (kg soil)–1 in the soil that did not receive green manure compared to 124 µg (kg soil)–1 in the 4 g green manure treated soils (b). Similarly, the Cd concentrations in the wheat grains did not systematically vary with the addition of green manure (c) while the addition of 4 g green manure almost doubled the Cd mass in wheat shoots compared to the soils that did not receive green manure (d). These consistent changes in biomass, Zn and Cd concentration, and Zn and Cd mass in the wheat shoots correspond to a biomass dilution effect [Citation47].
The addition of soluble mineral Zn fertilizer to the soils increased the soil-to-shoot transfer of Zn by factor 2.4–3.7 (). In addition, it also increased the Zn concentration in the grains from 29.7–99.4 mg (kg DW)–1. Such a strong increase indicates that the soluble Zn that was added to the soils remained soluble and was readily taken up by the wheat. Previous studies reported that soil Zn fertilization with soluble salts such as ZnSO4 is often not an efficient measure to increase Zn concentrations in wheat grown on alkaline soils with low DTPA-extractable Zn [Citation48]. In the sandy soil of this study (), this was not the case which suggests that a minor fraction of Zn strongly precipitated or strongly sorbed to the soil. Moreover, the mineral Zn fertilizer strongly decreased the Cd concentrations in the grains and the Cd mass in the shoots. These results corresponds with previous observations [Citation49] and confirm that Cd competes for membrane transporters that control Zn uptake [Citation6]. Together, the soil-applied mineral Zn fertilizer prooved to be an efficient biofortification measure that additionally decreased the Cd concentrations in wheat grains.
3.5. Green manure increased the soil-to-wheat transfer of Zn and Cd
The 67Zn and 111Cd enriched stable isotopes labels in the green manure helped to distinguish the sources of Zn and Cd in wheat (i.e. soil vs. green manure). More than 85 % of Zn in the wheat shoots derived from the soil and the fraction of Zn derived from the soil was lower in the 4 g green manure compared to the 1 g green manure treatment (A). Hence, only a small fraction (less than 15 %) of the Zn in the plant derived from the fertilizer. Furthermore, 8–16 % of the Zn added with the green manure was recovered in the plant (). This result means that more than 84 % of the Zn added with the green manure remained in the soil. Our results correspond with previously obtained Zn derived from fertilizer (2–20 %) and recovery values (1.5–12 %) for organic fertilizers that were applied to soils with distinct Zn bioavailability [Citation12,Citation21]. One reason for the low recovery in this study could be the low Zn mass that was added to the soil in the 4 g green manure treatment (120 µg (kg soil)–1, Table S1) which was much smaller than in the Zn added in the mineral Zn fertilized treatments. The low recovery may further indicate that part of the Zn added with green manure was not transformed to a plant available form during plant growth, was diluted in the soil with exchangeable Zn that was already present in the soil, and/or diffused into less bioavailable soil Zn pools [Citation8,Citation9]. Overall, our results confirmed that only a minor fraction of Zn in organic fertilizers seems to be directly transferred to plants.
Figure 3. Fraction of Zn (A) and Cd (B) in wheat shoots either derived from the soil (brown) or the green manure (green) expressed in percentage. Error bars represent the standard deviation of the mean of n = 4 experimental replicates. Letters denote statistical differences of the mean between Zn or Cd that derived from the soil (brown) and from the green manure (green) determined by a Kruskal–Wallis test (Table S5).
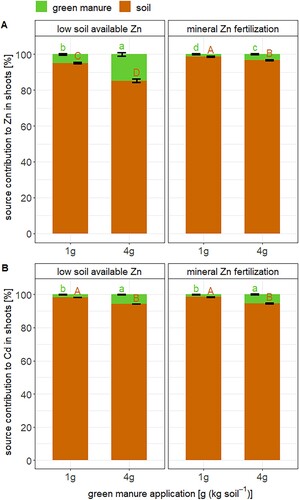
Figure 4. The recovery of Zn (A) and Cd (B) in shoots of wheat that was applied with the green manure (GM). Error bars represent the standard deviation of the mean of n = 4 experimental replicates. Letters denote statistical differences of the mean determined by Kruskal–Wallis test (Table S6).
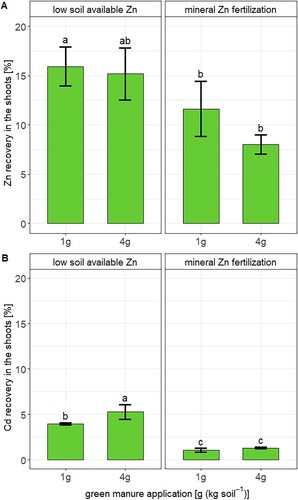
The fate of Cd that was added with green manure resembled that of Zn. More than 94 % of the Cd in the wheat derived from the soil and the Cd derived from fertilizer values were higher in the 4 g green manure than in the 1 g green manure treatment (B). The low recoveries may be related to mass balance aspects, decomposition of the fertilizer, and the fate of Cd in the soil as discussed in the previous paragraph for Zn. Furthermore, the recovery of the Cd in wheat that was added with the green manure was < 6 % in the soil with low available Zn and < 2 % in the mineral Zn fertilized soils (B). Hence, the addition of mineral Zn fertilizer decreased the direct transfer of Cd from the green manure to wheat. To the best of our knowledge, there is no study reporting such values for Cd in organic fertilizers. However, such values have been reported for Cd in mineral phosphate fertilizers in which Cd was present in a soluble form [Citation22,Citation27]. In these studies, the same wheat cultivar as in the present study was grown in soils with pH values between 4.5 and 7. In addition, a larger quantity of Cd was added to these soils (9.5–25 µg (kg soil)–1) than in the present study (3 µg (kg soil)–1). The Cd recoveries found for these soluble mineral P fertilizers were generally lower (< 3 %) and thereby lower than in the Cd recoveries found in in the soils with low available Zn in this study. Hence, this first and preliminary comparison suggests that the transfer of Cd from green manure to wheat can be higher than from soluble mineral phosphorus fertilizer to wheat, particularly in soils with low Zn bioavailability.
The isotope mass balances revealed that the addition of 4 g green manure increased the soil-to-wheat transfer of Zn from 66.1 to 124 µg (kg soil)–1 in the soil with low available Zn (A). However, no such effect appeared in the 1 g green manure treatment on both soils and on the mineral Zn fertilized soils. For Cd, the 4 g green manure treatment increased the transfer of Cd from the soil to the wheat shoots from 1.49 to 2.82 µg (kg soil)–1 in the soils with low Zn availability (B). The addition of 1 g green manure also increased the transfer of Cd from soil to wheat shoots from 0.55 to 0.75 µg (kg soil)–1 in the soils that received mineral Zn fertilizer. This result corresponds to a relative increase by a factor of about 1.6–1.9, which is similar to the increase of Zn (factor 1.9). Hence, the addition of green manure increased the transfer of Zn and Cd from soils to wheat shoots at a similar rate. These findings are further summarized in the schematic illustration in .
Figure 5. The transfer of Zn (A) and Cd (B) from soil (brown) and green manure (green) to shoots of wheat. Error bars represent the standard deviation of the mean of n = 4 experimental replicates. Horizontal lines (black) express the mean (straight line) and standard deviation (dashed line) of the control soil that has not received green manure. Letters denote statistical differences of the mean of Zn and Cd derived from the soil (brown) and green manure (green) determined by a Kruskal–Wallis test that includes the Zn and Cd derived from the soil in the control treatment (see details Table S7).
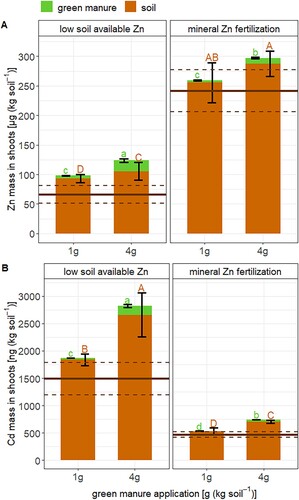
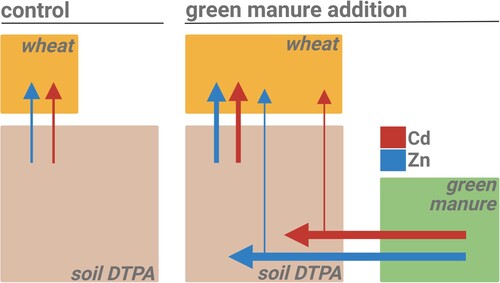
Figure 6. Schematic summary of the major effects of green manure addition on Zn and Cd dynamics in a soil–wheat system (alkaline soil with low Zn availability). Boxes are approximately proportional to the size of the Zn and Cd masses in the DTPA-extractable soil pools, green manure and wheat shoots. Size of the arrows symbolize Zn (blue) and Cd (red) transfer rates between the soil, fertilizer and plant compartments. Left: control treatment with no green manure added, Right: treatment with 4 g green manure per kg of soil. The direct transfer of Zn and Cd from the green manure to the wheat is small, but the transfer from the soil to the wheat significantly increases with green manure.
The increased soil-to-shoot transfer of Zn and Cd with the addition of green manure was likely related to increased biomass of the wheat roots and shoots (, ). The increased root biomass may have increased the soil exploration and thereby Zn and Cd uptake [Citation13,Citation15,Citation50]. In addition, the increased shoot biomass may have increased the transpiration rate and thereby the root uptake and root-to-shoot translocation of Zn and Cd [Citation51–54]. Previous studies have suggested that the decomposition of green manure changed the soil chemistry and thereby increased the solubility of Zn [Citation12,Citation14]. To provide such insights and to check if such a solubilization would also apply for Cd, detailed soil analyses would be required during plant growth [Citation55] or at harvest [Citation12].
4. Implications for Zn biofortification and isotope source tracing
This study provided and validated an approach to efficiently determine enriched isotope ratios and concentrations for Zn and Cd. This approach can be applied for isotope source tracing studies in systems that are relevant for crops production as the isotope ratios can be adequately resolved in systems with low Zn concentrations and systems that are moderately contaminated with Cd. As only one analytical run is needed to obtain enriched stable isotope ratios and concentrations, the approach increases the sample throughput and decreases the analytical costs for isotope source tracing experiments.
By using this approach, we confirmed that the addition of green manure to alkaline soils has the potential to increase Zn concentrations in wheat [Citation12–14]. However, our results showed that such a biofortification effect can only be achieved if other nutrients are not growth limiting and thus no biomass dilution effect occurs. Moreover, the green manure can also increase the soil-to-wheat of Cd to a similar extent as for Zn. Therefore, Zn biofortification strategies that employ organic fertilizers should be routinely monitored for critical increases in Cd concentrations in crops, particularly in alkaline soils with elevated Cd concentrations [Citation49,Citation56,Citation57]. In such systems, fertilizing Zn in a soluble form may help to reduce Cd uptake by crops, as shown in this study.
In the future, the scope of the proposed isotope source tracing approach could be expanded. For instance, enriched stable isotope ratios and concentrations of these elements could be measured in plant available soil pools or in the soil solution [Citation55]. Such measurements would provide additional insights on e.g. the effect of green manure and other organic fertilizers on the bioavailability of Zn and Cd in soils with different properties [Citation21]. Moreover, the approach could be used in field studies to trace the fate of Zn and Cd applied with fertilizers over several crop cycles and/or to trace the fate of other micronutrients that are important in plant and human nutrition such as iron [Citation58,Citation59]. Hence, the provided approach helps to further establish isotope source tracing to accurately study the fate and dynamics of trace metals in soil–fertilizer–plant systems.
Autor contribution
MK: conceptualization, formal analyses, investigation, data curation, writing – original draft, TDA: supervision, EF: supervision, conceptualization, writing – review and editing, CB: methodology, writing – review and editing, YZ: investigation, writing – review and editing, JB: methodology, writing – review and editing, MW: supervision, project administration, conceptualization, formal analyses, data curation, writing – original draft.
Supplemental Material
Download PDF (259.2 KB)Acknowledgements
We thank L. Schoenholzer and M. Macsai for their support in the laboratory and greenhouse, Stefan Zimmermann from WSL for the provision of the soil data for the soil selection and the members of the COST Action CA19116 PLANTMETALS (COST, European Cooperation in Science and Technology, www.cost.eu) for knowledge exchange.
Disclosure statement
No potential conflict of interest was reported by the author(s).
Additional information
Funding
References
- Wessells KR, Brown KH. Estimating the global prevalence of zinc deficiency: results based on zinc availability in national food supplies and the prevalence of stunting. PLoS One. 2012;7:e50568. doi:10.1371/journal.pone.0050568
- Alloway BJ. Soil factors associated with zinc deficiency in crops and humans. Environ Geochem Health. 2009;31:537–548. doi:10.1007/s10653-009-9255-4
- Gregory PJ, Wahbi A, Adu-Gyamfi J, et al. Approaches to reduce zinc and iron deficits in food systems. Glob Food Sec. 2017;15:1–10. doi:10.1016/j.gfs.2017.03.003
- Dobermann A, Bruulsema T, Cakmak I, et al. Responsible plant nutrition: A new paradigm to support food system transformation. Glob Food Sec. 2022;33:100636. doi:10.1016/j.gfs.2022.100636
- Cakmak I, Kutman UB. Agronomic biofortification of cereals with zinc: a review: agronomic zinc biofortification. Eur J Soil Sci. 2018;69:172–180. doi:10.1111/ejss.12437
- McLaughlin MJ, Smolders E, Zhao FJ, et al. Managing cadmium in agricultural systems. Adv Agron. 2021; 166:1–129.
- Fransson MN, Barregard L, Sallsten G, et al. Physiologically-based toxicokinetic model for cadmium using Markov-chain Monte Carlo analysis of concentrations in blood, urine, and kidney cortex from living kidney donors. Toxicol Sci. 2014;141:365–376. doi:10.1093/toxsci/kfu129
- Mertens J, Smolders E. Zinc. In: Alloway BJ, editor. Heavy metals in soils. Dordrecht: Springer Netherlands; 2013. p. 465–493.
- Smolders E, Mertens J. Cadmium. In: Alloway BJ, editor. Heavy metals in soils. Dordrecht: Springer Netherlands; 2013. p. 283–311.
- Ren Z, Sivry Y, Dai J, et al. Exploring Cd, Cu, Pb, and Zn dynamic speciation in mining and smelting-contaminated soils with stable isotopic exchange kinetics. Appl Geochem. 2016;64:157–163. doi:10.1016/j.apgeochem.2015.09.007
- Amer F, Rezk AI, Khalid HM. Fertilizer zinc efficiency in flooded calcareous soils. Soil Sci Soc Am J. 1980;44:1025-1030. doi:10.2136/sssaj1980.03615995004400050031x
- Aghili F, Gamper HA, Eikenberg J, et al. Green manure addition to soil increases grain zinc concentration in bread wheat. PLoS One. 2014;9:e101487. doi:10.1371/journal.pone.0101487
- Habiby H, Afyuni M, Khoshgoftarmanesh AH, et al. Effect of preceding crops and their residues on availability of zinc in a calcareous Zn-deficient soil. Biol Fertil Soils. 2014;50:1061–1067. doi:10.1007/s00374-014-0926-7
- Soltani S, Khoshgoftarmanesh AH, Afyuni M, et al. The effect of preceding crop on wheat grain zinc concentration and its relationship to total amino acids and dissolved organic carbon in rhizosphere soil solution. Biol Fertil Soils. 2014;50:239–247. doi:10.1007/s00374-013-0851-1
- Grüter R, Meister A, Schulin R, et al. Green manure effects on zinc and cadmium accumulation in wheat grains (Triticum aestivum L.) on high and low zinc soils. Plant Soil. 2018;422:437–453. doi:10.1007/s11104-017-3486-4
- Cherr CM, Scholberg JMS, McSorley R Green manure approaches to crop production: A synthesis. Agron J. 2006;98:302–319. doi:10.2134/agronj2005.0035
- Chalk PM, Inácio CT, Chen D. Tracing S dynamics in agro-ecosystems using 34S. Soil Biol Biochem. 2017;114:295–308. doi:10.1016/j.soilbio.2017.07.001
- Smith CJ, Chalk PM. The residual value of fertiliser N in crop sequences: An appraisal of 60 years of research using 15N tracer. Field Crops Res. 2018;217:66–74. doi:10.1016/j.fcr.2017.12.006
- Frossard E, Achat DL, Bernasconi SM, et al. The use of tracers to investigate phosphate cycling in soil–plant systems. In: Bünemann E, Oberson A, Frossard E, editor. Phosphorus in action. Berlin, Heidelberg: Springer; 2011. p. 59–91.
- Quan Z, Zhang X, Fang Y, et al. Different quantification approaches for nitrogen use efficiency lead to divergent estimates with varying advantages. Nat Food. 2021;2:241–245. doi:10.1038/s43016-021-00263-3
- Yan B-F, Dürr-Auster T, Frossard E, et al. The use of stable zinc isotope soil labeling to assess the contribution of complex organic fertilizers to the zinc nutrition of ryegrass. Front Plant Sci. 2021;12:730679. doi:10.3389/fpls.2021.730679
- Wiggenhauser M, Bigalke M, Imseng M, et al. Using isotopes to trace freshly applied cadmium through mineral phosphorus fertilization in soil–fertilizer–plant systems. Sci Total Environ. 2019;648:779–786. doi:10.1016/j.scitotenv.2018.08.127
- Hippler FWR, Boaretto RM, Quaggio JA, et al. Uptake and distribution of soil applied zinc by citrus trees – addressing fertilizer use efficiency with 68Zn labeling. PLoS One. 2015;10:e0116903.
- McBeath TM, McLaughlin MJ, Kirby JK, et al. A stable-isotope methodology for measurement of soil-applied zinc-fertilizer recovery in durum wheat (Triticum durum). J Plant Nutr Soil Sci. 2013;176:756–763. doi:10.1002/jpln.201200305
- McBeath TM, McLaughlin MJ. Efficacy of zinc oxides as fertilisers. Plant Soil. 2014;374:843–855. doi:10.1007/s11104-013-1919-2
- Mattiello EM, Cancellier EL, Silva D, et al. Efficiency of soil-applied 67Zn-enriched fertiliser across three consecutive crops. Pedosphere. 2021;31:531–537. doi:10.1016/S1002-0160(20)60044-3
- Bracher C, Frossard E, Bigalke M, et al. Tracing the fate of phosphorus fertilizer derived cadmium in soil–fertilizer–wheat systems using enriched stable isotope labeling. Environ Pollut. 2021;287:117314. doi:10.1016/j.envpol.2021.117314
- Jensen H, Mosbæk H. Relative availability of 200 years old cadmium from soil to lettuce. Chemosphere. 1990;20:693–702. doi:10.1016/0045-6535(90)90160-U
- Dürr-Auster T, Wiggenhauser M, Zeder C, et al. The use of Q-ICPMS to apply enriched zinc stable isotope source tracing for organic fertilizers. Front Plant Sci. 2019;10:1382. doi:10.3389/fpls.2019.01382
- Chaney RL. Cadmium and zinc. In: Hooda PS, editor. Trace elements in soils. Chichester: John Wiley & Sons, Ltd; 2010. p. 409–439.
- Prohaska T, Irrgeher J, Zitek A, et al., editors. Sector field mass spectrometry for elemental and isotope analysis. Cambridge, UK: The Royal Society of Chemistry; 2014. (New Developments in Mass Spectrometry; No. 3)
- Rehkämper M, Wombacher F, Horner TJ, et al. Natural and anthropogenic Cd isotope variations. In: Baskaran M, editor. Handbook of environmental isotope geochemistry. Berlin, Heidelberg: Springer; 2012. p. 125–154. (Advances in Isotope Geochemistry)
- Yan B-F, Nguyen C, Pokrovsky OS, et al. Contribution of remobilization to the loading of cadmium in durum wheat grains: impact of post-anthesis nitrogen supply. Plant Soil. 2018;424:591–606. doi:10.1007/s11104-018-3560-6
- Blume H-P, Brümmer GW, Fleige H, et al. Scheffer/Schachtschabel soil science. Berlin, Heidelberg: Springer; 2016.
- Berglund M, Wieser ME. Isotopic compositions of the elements 2009 (IUPAC Technical Report). Pure Appl Chem. 2011;83:397–410. doi:10.1351/PAC-REP-10-06-02
- Aucour AM, Sarret G, Blommaert H, et al. Coupling metal stable isotope compositions and X-ray absorption spectroscopy to study metal pathways in soil–plant systems: a mini review. Metallomics. 2023;15:mfad016. doi:10.1093/mtomcs/mfad016
- Wiggenhauser M, Moore RET, Wang P, et al. Stable isotope fractionation of metals and metalloids in plants: A review. Front Plant Sci. 2022;13:840941. doi:10.3389/fpls.2022.840941
- Wiggenhauser M, Bigalke M, Imseng M, et al. Cadmium isotope fractionation in soil–wheat systems. Environ Sci Technol. 2016;50:9223–9231. doi:10.1021/acs.est.6b01568
- Lindsay WL, Norvell WA. Development of a DTPA soil test for zinc, iron, manganese, and copper. Soil Sci Soc Am J. 1978;42:421–428. doi:10.2136/sssaj1978.03615995004200030009x.
- Maftoun M, Rassooli F, Ali Nejad Z, et al. Cadmium sorption behavior in some highly calcareous soils of Iran. Commun Soil Sci Plant Anal. 2004;35:1271–1282. doi:10.1081/CSS-120037545
- Wiggenhauser M, Bigalke M, Imseng M, et al. Zinc isotope fractionation during grain filling of wheat and a comparison of zinc and cadmium isotope ratios in identical soil–plant systems. New Phytol. 2018;219:195–205. doi:10.1111/nph.15146
- Costerousse B, Quattrini J, Grüter R, et al. Green manure effect on the ability of native and inoculated soil bacteria to mobilize zinc for wheat uptake (Triticum aestivum L.). Plant Soil. 2021;467:287–309. doi:10.1007/s11104-021-05078-6
- Broadley MR, White PJ, Hammond JP, et al. Zinc in plants. New Phytol. 2007;173:677–702. doi:10.1111/j.1469-8137.2007.01996.x
- Hawkesford MJ, Cakmak I, Coskun D, et al. Functions of macronutrients. In: Rengel Z, Cakmak I, White PJ, editor. Marschner’s mineral nutrition of plants. 4th ed. London: Elsevier; 2023. p. 201–281.
- Robertson GP, Groffman PM. Nitrogen transformations. In: Paul EA, editor. Soil microbiology, ecology and biochemistry. London: Elsevier; 2015. p. 421–446.
- Colombo C, Palumbo G, He J-Z, et al. Review on iron availability in soil: interaction of Fe minerals, plants, and microbes. J Soil Sediment. 2014;14:538–548. doi:10.1007/s11368-013-0814-z
- Jarrell WM, Beverly RB. The dilution effect in plant nutrition studies. Adv Agron. 1981;34:197–224. doi:10.1016/S0065-2113(08)60887-1
- Zou CQ, Zhang YQ, Rashid A, et al. Biofortification of wheat with zinc through zinc fertilization in seven countries. Plant Soil. 2012;361:119–130. doi:10.1007/s11104-012-1369-2
- Qaswar M, Hussain S, Rengel Z. Zinc fertilisation increases grain zinc and reduces grain lead and cadmium concentrations more in zinc-biofortified than standard wheat cultivar. Sci Total Environ. 2017;605–606:454–460.
- Dong B, Rengel Z, Graham RD. Root morphology of wheat genotypes differing in zinc efficiency. JPlant Nutr. 1995;18:2761–2773. doi:10.1080/01904169509365098
- Salt DE, Prince RC, Pickering IJ, et al. Mechanisms of cadmium mobility and accumulation in Indian mustard. Plant Physiol. 1995;109:1427–1433. doi:10.1104/pp.109.4.1427
- Van der Vliet L, Peterson C, Hale B. Cd accumulation in roots and shoots of durum wheat: the roles of transpiration rate and apoplastic bypass. J Exp Bot. 2007;58:2939–2947. doi:10.1093/jxb/erm119
- Tani FH, Barrington S. Zinc and copper uptake by plants under two transpiration rates. Part I. Wheat (Triticum aestivum L.). Environ Pollut. 2005;138:538–547.
- Marschner P, Rengel Z. Nutrient availability in soils. In: Rengel Z, Cakmak I, White PJ, editor. Marschner's mineral nutrition of plants. 4th ed. London: Elsevier; 2023. p. 499–522.
- Wiggenhauser M, Aucour A-M, Bureau S, et al. Cadmium transfer in contaminated soil–rice systems: insights from solid-state speciation analysis and stable isotope fractionation. Environ Pollut. 2021;269:115934. doi:10.1016/j.envpol.2020.115934
- Quezada-Hinojosa R, Föllmi KB, Gillet F, et al. Cadmium accumulation in six common plant species associated with soils containing high geogenic cadmium concentrations at Le Gurnigel, Swiss Jura Mountains. Catena. 2015;124:85–96. doi:10.1016/j.catena.2014.09.007
- Zhang S, Song J, Cheng Y, et al. Derivation of regional risk screening values and intervention values for cadmium-contaminated agricultural land in the Guizhou Plateau. Land Degrad Dev. 2018;29:2366–2377. doi:10.1002/ldr.3034
- Aciksoz SB, Yazici A, Ozturk L, et al. Biofortification of wheat with iron through soil and foliar application of nitrogen and iron fertilizers. Plant Soil. 2011;349:215–225. doi:10.1007/s11104-011-0863-2
- Sheraz S, Wan Y, Venter E, et al. Subcellular dynamics studies of iron reveal how tissue-specific distribution patterns are established in developing wheat grains. New Phytol. 2021;231:1644–1657. doi:10.1111/nph.17440