
ABSTRACT
The ultimate goal of forensic interventions is reducing risk level by targeting criminogenic needs. Person-centered approaches are used to identify subgroups with similar patterns of needs, informing treatment targeting differential criminogenic areas. In line with risk and strengths-based theories on offender rehabilitation, this paper identified subgroups based on risk and protective factors. In 297 justice involved youth with a history of violence, subgroups were identified using latent profile analysis on subscale ratings of the SAVRY and SAPROF-YV. For 216 youths these profiles were related to recidivism. Four latent profiles were identified varying in risk and protection level. These profiles showed strong concordance with structured professional judgement classifications and differentiating offending patterns were observed between subgroups. Results show how risk factors and protective factors tend to co-occur for subgroups of young individuals, which could facilitate allocation of intervention resources and inform better tailored case management strategies aimed at reducing risk factors and improving strengths to enhance resilience.
The risk need responsivity (RNR) framework for risk management and treatment has been developed in order to facilitate designing services that effectively reduce recidivism risk (Bonta & Andrews, Citation2016). Following this framework, youth risk assessment tools have been composed that assess young individuals’ risk level and associated treatment needs which could be targeted to reduce the risk of recidivism. A significant body of research addressed the empirical validation of juvenile risk assessment tools (for an overview see Koh et al., Citation2020; Olver et al., Citation2009; Schwalbe, Citation2007). These studies have provided important evidence that supports the use of youth risk assessment in clinical practice. However, most studies pay little attention to heterogeneity in offending patterns (Farrington, Citation1986; Moffitt, Citation1993) or heterogeneity in risk factors (Harris & Jones, Citation1999; Loeber et al., Citation2016), as they consider juvenile delinquency as a unitary outcome assuming that the predictive validity of risk assessment operates similarly for different youth (e.g. Onifade et al., Citation2008).
Several studies have aimed to identify more homogeneous subgroups of youth with similar offending patterns or similar risk profiles (as suggested by Schwalbe et al., Citation2008). In these studies, subgroups were often identified based on offending characteristics (e.g. length of criminal career and type of offending behavior; Hendriks & Bijleveld, Citation2004; Mulder et al., Citation2012), or personality characteristics (e.g. Kotelnikova et al., Citation2022; Oxnam & Vess, Citation2006, Citation2008; van Dam et al., Citation2007). The identification of subgroups based on risk factors for offending, has received considerably less attention (Mulder et al., Citation2010a). Moreover, very few studies have included the role of protective factors that could mitigate the effect of risk factors (Childs et al., Citation2014; Hilterman et al., Citation2019). The current study builds on the extant literature by examining the role of both risk and protective factors and aims to identify subgroups based on patterns of co-occurring risk and protective factors in risk assessment. Subsequently, the identified subgroups will be related to recidivism as undesirable outcome after discharge from treatment.
Many risk assessment tools are built on a cumulative risk model (see e.g. Sameroff, Citation2000). This model implies that for all individuals a higher number of risk factors and a lower number of protective factors is associated with an increased recidivism risk. While the cumulative risk model has proven useful for estimating the required intensity of treatment (Risk principle RNR; see Andrews & Bonta, Citation2010), this model ignores the possible risk increasing or decreasing effects of interactions between risk factors and/or protective factors (Li et al., Citation2019; Lösel & Farrington, Citation2012). Given the heterogeneity in offending patterns, and risk factors and associated treatment needs in youth (Harris & Jones, Citation1999), it might be possible that distinct subgroups of individuals can be identified with a similar pattern of co-occurring risk and protective factors.
To identify these subgroups, risk assessment studies have increasingly moved from a variable-centered approach (commonly used in test validity assessment literature) to a person-centered approach. While variable-centered approaches identify relationships among variables (e.g. risk factors correlate with recidivism), person-centered approaches identify patterns among variables that are similar within subgroups in a population (Schwalbe et al., Citation2008). An example of a person-centered approach aimed at identifying subgroups is latent profile analysis (LPA). LPA is a data-driven technique to identify subgroups, or latent profiles, based on responses on a set of continuous variables (i.e. idicators; Oberski, Citation2016). Risk assessment studies have started adopting LPA or other person-centered approaches (e.g. Campbell et al., Citation2019; Childs et al., Citation2014; Hillege et al., Citation2017; Hilterman et al., Citation2019; Lopez-Romero et al., Citation2019; Maneiro et al., Citation2022; Schwalbe et al., Citation2008).
Classifying youth into more homogeneous subgroups based on their risk assessment ratings may provide valuable implications for clinical practice. Subgroups aid in recognizing heterogeneity in presumed homogeneous samples. They can reveal patterns and relationships within subgroups, and the size of these subgroups within an organization. This information can be very valuable for organizations to find out whether the intensity of their interventions and security levels match risk level, and to check whether treatment offerings are in line with treatment needs within their organization (Hilterman et al., Citation2019; Schwalbe, Citation2007; Walker et al., Citation2016). Clustering youth into subgroups based on their risk assessment ratings over time can also be important to reveal changes in populations, and to adjust treatment offerings accordingly. For example, specialized staff can be recruited or trained when service gaps are identified.
Taken together, evidence from several LPA studies suggests that there are subgroups of offenders based on their risk level (e.g. Childs et al., Citation2014; Hilterman et al., Citation2019; Lopez-Romero et al., Citation2019). Mainly three subgroups are distinguished in different studies: low-, middle- and high-risk profiles, in line with the cumulative risk model (Sameroff, Citation2000). For example, Childs et al. (Citation2014) and Hilterman et al. (Citation2019) used the Structured Assessment of Violence Risk in Youth (SAVRY; Borum et al., Citation2006) for profile identification and found three to five different subgroups that mainly showed quantitatively differences in risk level. Contrary, evidence is also emerging suggesting that different subgroups can share an overall risk level but show distinct treatment needs (e.g. Hillege et al., Citation2017; Mulder et al., Citation2010a; Onifade et al., Citation2008). For instance, Onifade et al. (Citation2008) used the Youth Level of Services/Case Management Inventory (YLS/CMI) to distinguish five profiles of justice involved youth: (a) low risk, (b) non-constructive free-time, (c) family conflict, (d) high risk with history, (e) high-risk newcomers. In the Dutch context, two studies used the Juvenile Forensic Profile (FPJ; Brand & Van Heerde, Citation2004) to distinguish subgroups within the top 5% of most serious juvenile offenders in the Netherlands. Mulder et al. (Citation2010a) identified six subgroups: (a) antisocial identity, (b) frequent offenders, (c) flat profile, (d) sexual problems and weak social identity, (e) sexual problems and (f) problematic family background. In addition, Hillege et al. (Citation2017) found six subgroups which were similar to Mulder et al. (Citation2010a), and one additional subgroup characterized by substance abuse.
Notably, different LPA studies used different assessment tools to asses more homogeneous subgroups of justice involved youth. Consequently, it becomes difficult to compare results between studies. The choice of which risk assessment tool is used to identify these subgroups may impact the degree and nature of differences between subgroups. For example, different risk factors and different subscales are included in different instruments (Lopez-Romero et al., Citation2019). Additionally, the degree to which assessment tools include protective factors within their assessments differs greatly between tools. To date, the majority of risk assessment tools overlook the role of protective factors (e.g. Rogers, Citation2000; Viljoen et al., Citation2017). Although there has been some debate on the precise definition of protective factors (e.g. Li et al., Citation2019) and their incremental predictive value beyond risk factors (e.g. Barnes-Lee & Campbell, Citation2020), it is generally well known that interventions focusing on both risk reducing and strengths increasing factors achieve the greatest possible effect on recidivism reduction. Subgroups based solely on risk factors would thus be only partially useful to inform interventions at organizational level.
Yet, only few studies aimed to identify subgroups of justice involved youth included protective factors in the assessments that were used as profile identifiers (Childs et al., Citation2014; D’Amato et al., Citation2021; Hilterman et al., Citation2019; Lopez-Romero et al., Citation2019). Moreover, these studies are contradictory with some studies supporting a cumulative model (Childs et al., Citation2014; Hilterman et al., Citation2019; Lopez-Romero et al., Citation2019) and others finding qualitative differences between subgroups (D’Amato et al., Citation2021; Lopez-Romero et al., Citation2019). Although different assessment methods were used in these studies to assess risk and protective factors, the tools used in the different studies (i.e. SAVRY; Childs et al., Citation2014; Hilterman et al., Citation2019, Ohio Youth Assessment Disposition Tool [OYAS-DIS]; D’Amato et al., Citation2021; protocol of ‘Valoración del Riesgo en Adolescentes Infractores’ [Juvenile Offenders’ Risk Assessment, VRAI]; Lopez-Romero et al., Citation2019), have the commonality that there is still less focus on protective factors relative to risk factors. In order to increase the emphasis on protective factors in juvenile risk assessment, the Structured Assessment of Protective Factors for violence risk – Youth Version (SAPROF-YV; de Vries Robbé et al., Citation2015) has been developed. While promising results have been found regarding the predictive validity at group level of the cumulative ratings of the SAPROF-YV in combination with the SAVRY (de Vries Robbé et al., Citation2022; Kleeven et al., Citation2022), it is unclear how for subgroups of individuals the protective factors in the SAPROF-YV cluster together with risk factors in (predominantly) risk oriented juvenile risk assessment tools such as the SAVRY.
Another shortcoming of the current literature is that the relationship between subgroups and recidivism has been examined poorly. Several studies have looked at relationship between subgroups and various characteristics, such as criminal history (e.g. Schwalbe et al., Citation2008). Few studies looked at the relationship between subgroups and recidivism and found that more serious subgroups had higher recidivism rates (Campbell et al., Citation2019; Childs et al., Citation2014; Hilterman et al., Citation2019; Lee & Taxman, Citation2020; Onifade et al., Citation2008). However, research to date has not yet determined how subgroups of justice involved youth relate to the timing of recidivism. This is important as the examination of recidivism in a dichotomous manner during a certain follow-up period has its shortcomings. Studies have shown that the risk of recidivism is highest shortly after release and decreases while the time spent in the community without recidivism increases (e.g. Caudill, Citation2010; Maltz, Citation1984). Therefore, it is advised to study patterns of reoffending amongst youth in the criminal justice system (e.g. Mulvey et al., Citation2004; Ozkan, Citation2016).
Present study
This study was designed to gain more insight into the pattern of co-occurring risk and protective factors measured through risk assessment to inform risk and strength-based practices. In a heterogeneous sample of youth with violent behavior admitted to juvenile justice institutions in the Netherlands, risk and protective factors were assessed using the SAVRY and SAPROF-YV during the first six months of the intervention. Using LPA, subgroups were identified through subscale ratings on the SAVRY and SAPROF-YV. In addition, the consistency between this classification based on LPA and a classification based on Structured Professional Judgement (SPJ) was examined. Finally, the predictive validity for recidivism, and offending patterns over time were examined within the different subgroups.
Based on the results of prior studies, one low-risk/needs subgroup with protective factors across multiple domains was expected that showed low recidivism rates, and one high-risk/needs subgroup was foreseen with risk factors across all domains and limited protective factors showing high recidivism rates (Campbell et al., Citation2019; Hilterman et al., Citation2019; Onifade et al., Citation2008; Schwalbe et al., Citation2008). In addition, two subgroups with moderate levels of risk factors in a single domain were expected (Campbell et al., Citation2019; Hillege et al., Citation2017; Schwalbe et al., Citation2008), of which at least one subgroup was expected to show the presence of multiple protective factors (Hilterman et al., Citation2019). It was further hypothesized that LPA categories differed from SPJ risk categories in the sense that LPA not only differentiated subgroups with different risk levels, but that LPA was also able to point out different treatment needs (i.e. relative elevations on certain subscales) within risk level. Thus, two classes reflecting moderate risk and protective factors were expected. These subgroups were expected to show a moderate SPJ risk level, but reveal different constellations of needs and protective factors.
Method
Setting
This study was part of a larger study on the validity and utility of risk assessment within the Dutch juvenile justice institutions (Kleeven et al., Citation2022). Juveniles between 12 and 18 years who commit a criminal offense are penalized according to the juvenile criminal law. The juvenile criminal law may also be applied to young adults aged 18–23 years. Juveniles and young adults sentenced under the juvenile criminal law can reside in juvenile justice institutions. A youth detention order could be imposed for a maximum duration of six months for juveniles up to 16 years, and one year for youth aged 16 and above. For youth who committed severe offenses and require intensive treatment to reduce the risk of reoffending, a mandatory treatment order could be imposed for two years which can be extended to a maximum of seven years. Youth who await their conviction remain in pre-trial custody. Short- and long-stay groups exist in juvenile justice institutions. Girls are residing separately from boys. Also, specialized groups are available for young people with special needs (such as severe psychiatric problems or intellectual disabilities). There are currently six juvenile justice institutions that house around 450 youths and young adults daily. Length of stay ranges from 1 d to up to 7 years, with an average of 92 days. Youth and young adults in juvenile justice institutions follow an intensive daily schedule aimed at their individual needs, including school and training aimed at (moral) development, conflict management and social skills, or individual treatment. By means of accompanied or unaccompanied leaves, individuals are gradually prepared for their return to society. The overall recidivism rate among youth discharged from juvenile justice institutions is 68% within two years (Weijters et al., Citation2019).
Subjects
Risk assessment tools were coded retrospectively based on file information of 354 youths in juvenile justice institutions. Where possible, multiple ratings were performed for each individual. Data presented in the present study concern risk assessments coded at the start of treatment, that is within six months after admission. For 46 youths risk assessments could not be coded within the first six months after entry, these cases were therefore excluded from the study. In addition, girls were excluded (n = 11), as it has been shown that boys and girls may show different combinations of risk factors (Hilterman et al., Citation2016) and the number of females was too low to draw meaningful conclusions regarding this specific subgroup. The remaining sample for the profile analyses consisted of 297 male juveniles and young adults between the age of 12 and 23 at the start of treatment (M = 17.64, SD = 1.71). These individuals all resided in a juvenile justice institution in the Netherlands between January 2013 and May 2016. The duration of their admission varied between 16 days and 6.06 years (M = 211.30 days, SD = 281.19 days). All youth had been convicted for committing a criminal offense and either served a juvenile detention sentence (66.9%, n = 199), were admitted under a mandatory treatment order (6.4%, n = 19), or remained in pre-trial custody due to being suspected of committing a criminal offense (26.6%, n = 79). As the SAVRY and SAPROF-YV were originally developed for the assessment of violence risk, only youth with a history of violent behavior (i.e. violent offense or other known past violent behavior) were included. Descriptive statistics (ethnicity, index offense, number of previous convictions) can be found in . This study uses archival patient data from juvenile justice institutions. Therefore, the Dutch law on Research Involving Human Subjects Act (WMO) is not applicable. A non-WMO declaration (2017.056) was obtained through the Medical Ethical Research Committee of Amsterdam UMC, location VUmc, waiving individual informed consent.
Table 1. Sample characteristics.
Measures
SAVRY
The Structured Assessment of Violence Risk in Youth (SAVRY; Borum et al., Citation2006) Dutch translation (Lodewijks et al., Citation2006) was used to measure risk and (to a limited extend) protective factors for violent behavior. The SAVRY includes 30 items that are divided in 10 historical risk factors, six social/contextual risk factors, eight individual clinical risk factors, and six protective factors (for an overview of the items within these scales see Table S4 in the online supplement). Risk factors in the SAVRY are rated on a three-point scale: 0 = low, 1 = moderate, or 2 = high, while the protective factors are rated as either present (1) or absent (0). The risk factors of the historical scale are rated regarding someone’s entire past, while the risk factors of the dynamic social/contextual and individual/clinical scales reflect functioning in the past six months, and ratings on the protective factors concern the past 12 months. Reliability analysis of 29 cases (Intraclass Correlation Coefficient (ICC) with a random two-way model, absolute agreement and single measures) showed good to excellent interrater reliability for the SAVRY (SAVRY total risk score ICC = .82; SAVRY total protection score ICC = .74).
In the current study, subscale ratings were composed by summing up the item scores on the historical, social/contextual, individual/clinical and protective domain (note that the protective factors were reversed scored, in this way a higher score on a SAVRY risk and protective factor predicted recidivism). A second set of subscale ratings was composed following an alternative five factor structure developed by Hilterman et al. (antisocial behavior, family functioning, personality, social support and treatability; Hilterman et al., Citation2016). All subscale scores were standardized by dividing the unstandardized scores by the highest possible score for that scale. This resulted in subscale scores ranging from 0 to 1, with 0 reflecting the lowest possible score and 1 the highest possible score. Confirmatory factor analyses (CFA; see online supplement) showed that the original subscale structure (Borum et al., Citation2006) showed poor fit to the current data. The five factor structure (Hilterman et al., Citation2016) showed superior fit to the original SAVRY structure, which led to the decision to use the subscale structure by Hilterman et al. in the analyses. Mean SAVRY subscale scores are provided in . For an overview of the items within these subscales see Table S4 in the online Supplement.
SAPROF-YV
As a comprehensive assessment of protective factors for violence, the Structured Assessment of Protective Factors for violence risk – Youth Version (SAPROF-YV) Dutch version was used (de Vries Robbé et al., Citation2014). It contains 16 dynamic protective factors on four domains: resilience domain, motivational domain, relational domain and external domain (for an overview of the SAPROF-YV items see Table S4 in the online supplement). The items are rated as: 2 = clearly present, 1 = present to some extent, 0 = not or hardly present. The possible addition of a plus (+) or minus (-) to the scores of 0, 1, 2 results in a seven-point scale (0, 0+, 1-, 1, 1+, 2-, 2), reflecting the extent to which each factor is anticipated to be present as a protective factor for the individual in the coming six months. As the SAPROF-YV protective factors are rated for the future they are context dependent, for the current study, the (hypothetical) context of discharge at the time of assessment was used. Reliability analysis (ICC with a random two-way model, absolute agreement and single measures) showed excellent interrater reliability of the SAPROF-YV total scores (ICC = .76).
For the purpose of this study the SAPROF-YV items were coded on a scale ranging from 0 to 6 (0 = 0, 0+ = 1, 1- = 2, 1 = 3, 1+ = 4, 2- = 5, 2 = 6), and summed up in four subscale scores: resilience, motivational, relational and external (see Table S4 in the online Supplement). Standardized subscale scores were calculated by dividing the unstandardized subscale scores by the maximum possible score. CFA indicated that the SAPROF-YV subscales showed good internal consistency (see online supplement). See for the mean subscale ratings of the SAPROF-YV in the current sample.
Table 2. Comparison of model fit indices for number of class solutions.
Summary risk ratings
In the SPJ procedure, the final conclusion of the assessment constitutes an overall summary risk rating (SRR) estimated by the assessor resulting from carefully combining, weighing and integrating the findings in the assessment. The SPJ SRR of the SAVRY is normally estimated on a three-point scale: low, medium and high risk of violence. As in the current study the SAVRY and SAPROF-YV were assessed by the same rater, it was decided to make integrated SRRs based on the SAVRY and SAPROF-YV together. The SAPROF-YV manual describes a procedure to estimate SRRs based on the SAPROF-YV together with a risk oriented risk assessment tool such as the SAVRY (de Vries Robbé et al., Citation2014). Two SRRs were estimated for each individual based on the SAVRY and SAPROF-YV combined regarding the likelihood of reoffending after discharge: (1) violent behavior and (2) nonviolent criminal behavior. SRRs were made on a five-point scale: 1 = low, 2 = low-moderate, 3 = moderate, 4 = moderate-high, or 5 = high risk. These SRRs reflected the clinical judgment of the estimated risk of violence or nonviolent criminal behavior within the first six months after discharge, for the (hypothetical) situation that the individual would be released at the time of the assessment. Reliability analysis of 29 cases (Intraclass Correlation Coefficient (ICC) with a random two-way model, absolute agreement and single measures) showed good interrater reliability for the SRRs (SRR violence ICC = .66; SRR nonviolence ICC = .67).
Recidivism
Official recidivism data were obtained from criminal records. Time at risk was ranged from 32 to 69 months after discharge from the institution (M = 49.08 SD = 14.68, note that time at risk was calculated based on the release dates and the date the criminal records were obtained). As for the current study risk assessments rated within six months after admission were used, the time between assessment and discharge (start of time at risk) was also calculated. On average individuals remained in treatment for 5.08 months after their assessment before being discharged. New offenses were classified as convictions for violent offenses or nonviolent offenses committed within six months after the release date (excluding misdemeanor). Violent recidivism was defined as any (attempted) act intended to cause physical or psychological harm to others (Borum et al., Citation2006; de Vries Robbé et al., Citation2015). Violent and nonviolent offenses were combined in a third measure of recidivism: general recidivism, defined as any new offense that led to official judicial conviction, violent or nonviolent.
Procedure
In this study, risk assessment tools were rated retrospectively by a research team consisting of 24 graduate students in Clinical or Forensic Psychology, Criminology or related studies. Prior to data collection, all researchers received a two-day workshop in the use of the SAVRY and SAPROF-YV. In addition, during a training period of two weeks, they were carefully trained in the use of the file system by the principal investigator, and in all other activities and procedures during data collection. During this period, additional practice cases were rated to consensus. Based on observed variations in ratings additional coding instructions were given. After this intensive training period, data collection proceeded in several steps. First, files were reviewed by a member of the research team in order to decide if they were eligible for inclusion in the current study (i.e. that there was sufficient information present and a treatment plan was available which was completed within the first six months after admission). Second, other members of the research team rated the SAVRY and SAPROF-YV. In the current study, these initial risk assessments were rated based on file information up until and including the first available treatment plan within six months after admission (M = 58.22 days after admission). Files usually consisted of (i) a screening on psychosocial problems (self-report questionnaires: Massachusetts Youth Screening Instrument-Second Version, and Strengths and Difficulties Questionnaire), (ii) a treatment plan drawn up by clinicians in the juvenile justice institution (iii) incident reports (e.g. physical or verbal violence, drug use, possession of contraband), (iv) daily reports by group workers regarding the juvenile’s functioning and contact with their parents/guardians. In addition, the research team had access to the youth’s judicial file, including information on criminal history, and official reports that were written in the context of a possible previous criminal case (e.g. police reports, verdict, psychological reports, and reports from probation services). All file information was sorted chronologically. File information that was dated after the moment of assessment was not taken into account when rating the risk assessment tools. In order to assess the interrater reliability, files of 29 randomly selected cases were assessed by two researchers independently, and consensus ratings were agreed upon. For all cases that were rated to consensus, consensus ratings were used in the analyses. In the last phase of the research project, recidivism data regarding criminal offending after discharge were retrieved from official records. Recidivism data were analyzed after completion of the risk assessment tools which ensured that the researchers who rated the risk assessments were blind to recidivism data.
Statistical analyses
The analyses proceeded in several steps. First, in order to identify classes with similar patterns on the SAVRY and SAPROF-YV subscales, stepwise latent profile analysis (LPA) was performed in Mplus. LPA is a data-driven statistical technique to investigate subgroups or profiles with a similar pattern in observed scores on a number of continues indicators, and produces a series of models with an increasing number of subgroups. The best model was selected based on model fit, classification quality and class size. Model fit was evaluated using the Bayesian Information Criterion (BIC), the Lo-Mendel-Rubin adjusted Likelihood Ratio Test (LMR-LRT; Lo et al., Citation2001), entropy and class size. Nylund et al. (Citation2007) found that the BIC performed best in correctly identifying the number of subgroups with the highest power across different samples. Lower BIC values represent a superior model in terms of both parsimony and fit (Schwarz, Citation1978). The LMR-LRT compares model fit between k and k-1 classes and produces a p-value indicating a significant increase (Nylund et al., Citation2007). The quality of classification was determined by using the entropy; a number between 0 and 1 with values above .80 representing high separation between classes (Clark & Muthén, Citation2009). Finally, in order to avoid small subgroups, models with a profile size smaller than 5% were rejected. To avoid incorrect profile solutions, all models were replicated twice using the seed values from the highest log-likelihood values as described by Asparouhov and Muthén (Citation2014).
Second, the posterior class probabilities of the final model were saved and the variable profile membership was composed based on the highest posterior class probability for each case, reflecting the most likely subgroup for each individual. The consistency between latent profile membership and the SRRs for violent and nonviolent criminal behavior, were examined using exact cellwise analysis of a contingency table (EXACON, see Bergman & El-Khouri, Citation1987). The EXACON procedure tabulates the frequencies of two categorical variables and calculates (using a Chi-square distribution) whether frequencies are higher than could be expected using the observed and expected frequency based on chance.
Third, Receiver Operating Curve (ROC) analyses were conducted to examine the predictive validity of the SRRs for violent and nonviolent reoffending, and the latent profile solution. Area Under the Curve (AUC) values between .56 and .64 were perceived as small, AUC values above .64 were perceived as medium, and AUC values above .71 were perceived as large (Rice & Harris, Citation1995). To determine whether ROC curves differed between predictors, Hanley and McNeil’s Z test for correlated ROC curves was used (Hanley & McNeil, Citation1982). Finally, to investigate significant differences in time to recidivism between the latent profiles, Cox regression was used. Cox regression investigates the effect of specific factors upon the time it takes for an event (i.e. recidivism) to happen. Recidivism was measured after release from the institution while assessments were rated within six months after admission. To decrease the effect of change in the period between risk assessment and release, it was decided to only include the assessments of youth who were released within six months after the assessment date (n = 216) in the Cox regression. The proportional hazard assumption was tested by examining the associations between Schoenfeld residuals (Schoenfeld, Citation1982) and time.
Missing data
Of the 297 cases in the current study, 33 cases (11.1%) had missing values on the SAVRY. Of these cases with missing values, 26 cases (8.8%) had one missing value, 6 cases (2.0%) had two missing values, and 1 case (0.3%) had three missing values. SAPROF-YV item 8 (Medication) was excluded from the analyses as this item was rated as not applicable for 255 cases (85.9%). When addressing all other items in the SAPROF-YV, 25 cases (8.4%) had missing values, of which 21 cases (7.1%) with one missing value, and 4 cases (1.3%) with two missing values. Cases with more than three missing values on the SAVRY or SAPROF-YV were excluded from the current study prior to data analyses. Values on missing items were imputed (multiple imputation in SPSS version 26, n = 3) when composing the SAVRY and SAPROF-YV subscale scores.
Results
Latent profile analysis
shows the fit indices for the latent profile analyses with an increasing number of latent profiles. The fit statistics in did not completely align. The BIC decreased up to the four-profile model. Also, the LMR-LRT suggested that the four-profile model showed the best fit. The highest entropy was found for the five-profile model, suggesting these five profiles were best separated. However, entropy values were almost similar in the other models suggesting that all profiles were well separated. Based on the fit statistics combined the four-profile solution was chosen. We also took into account that the smallest profile size in the five-profile solution was 8 (3%), which confirmed the choice for the four profile solution.
Each profile contained between 7.7% to 34.7% of the total sample. Youth were fairly equally distributed across profile two, three and four, while the first profile was smaller. Good separation between profiles (entropy = .86), and the clinical interpretability of the first profile, led to the decision to retain the first profile. shows the mean SAVRY and SAPROF-YV subscale scores in each profile. Significant differences in SAVRY and SAPROF-YV subscale scores between profiles are shown in .
Figure 1. Mean standardized SAVRY and SAPROF-YV estimates four class solution.
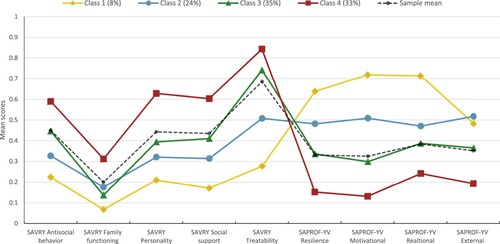
Table 3. Differences in SAVRY and SAPROF-YV subscale scores between latent profiles.
Subgroup one – low risk, high protection
Subgroup one was the smallest group with 7.7% (n = 23) of the total sample and represents a low risk group. Compared with the mean scores in the other three subgroups, this group showed the lowest mean values on all SAVRY domains. The young individuals within this profile had very low means for poor family functioning (M = .07) and relative low means for the other SAVRY domains: antisocial behavior (M = .22), dysfunctional personality traits (M = .22), social support (M = .17), and treatability (M = .26), which indicates that these youth showed less problem behavior on all SAVRY scales. Furthermore, this profile showed the highest mean values on the SAPROF-YV resilience (M = .64), motivational (M = .73) and relational domain (M = .72), which were in the moderate to high range. On the SAPROF-YV external domain this group showed moderate values (M = .50), indicating that external protective factors such as a supportive pedagogical climate were expected to be moderately present if youth were released from the institution at the moment when risk assessment tools were rated.
Subgroup two – moderate risk, moderate protection
Subgroup two was comprised of 23.9% (n = 71) of the total sample. This group showed low to moderate mean values for antisocial behavior (M = .33), dysfunctional personality traits (M = .32, such as impulse control or negative attitudes) and needs for social support (M = .31). Low mean values were found for poor family functioning (M = .17), while moderate mean values were found for treatability (M = .51), indicating that these youth showed reduced collaboration with interventions or school/work. Moderate protection was found across all SAPROF-YV domains: resilience (M = .49), motivational (M = .59), relational (M = .48) and external (M = .51).
Subgroup three – moderate to high risk, low protection
Subgroup three comprised the largest profile with 34.7% (n = 103) of the sample. In this group high mean values were found for treatability (M = .75), indicating a significantly reduced motivation for interventions and school/work. Problems on the other SAVRY domains were lower in relation to treatability, with moderate mean values for antisocial behavior (M = .45), dysfunctional personality traits (M = .39) and needs for social support (M = .41) and low mean values for poor family functioning (M = .17). Mean values on the SAPROF-YV protective factors domains remained within in the low-moderate range (resilience: M = .34, motivational: M = .30, relational: M = .48 and external: M = .36).
Subgroup four – high risk, low protection
This group represented 33.7% (n = 100) of the total sample. reveals that the fourth subgroup had a similar pattern on the SAVRY and SAPROF-YV scales when compared to the third subgroup, with relatively high mean values on treatability and relatively low mean values on poor family functioning compared to the other scales. Importantly, mean values across all domains of the SAVRY were higher while mean values on all domains of the SAPROF-YV were lower than in class three. Very high mean values were found for treatability (M = .84), pointing to severe problems with motivation for treatment or school/work. Moderate to high mean values were found for antisocial behavior (M = .59), dysfunctional personality traits (M = .63) needs for social support (M = .61), while low to moderate mean values were found for poor family functioning (M = .32). Furthermore, low mean values on the SAPROF-YV scales were found (resilience: M = .15, motivational: M = .13, relational: M = .24 and external M = .20).
Correspondence between classification based on LPA and SPJ
To examine the consistency between the categorical variable profile membership (based on the posterior class probabilities of the four-profile solution) and the SRRs for violent and nonviolent criminal behavior, frequencies were cross tabulated in two two-way contingency tables, see . Based on the observed frequency, and the expected frequency in each cell, it was examined whether the frequency was more or less common than could be expected based on chance (EXACON; see Bergman & El-Khouri, Citation1987). For members of the first latent profile (low risk, high protection), it was typical to be rated with a low violence risk and low risk of nonviolent reoffending. Members of the second latent profile (moderate risk, moderate protection) were more often rated with a low-moderate violence risk and low risk of nonviolent reoffending. In the third latent profile (moderate to high risk, low protection), members were typically rated with a moderate violence risk, while no relationship was found with the SRR for nonviolent reoffending. For members of the fourth profile (high risk, low protection) it was typical to be rated with either a moderate to high risk or high risk for violent and nonviolent reoffending.
Table 4. Two-way contingency table between latent class membership and SRR for violence and nonviolence with EXACON analysis.
Predictive validity for recidivism
Predictive validity analyses were carried out with the 216 youths who were released within six months following their assessment date. There were on average 36.28 days (SD = 61.03) between the assessment date and release date from the institution (the moment from when recidivism was measured). Of the 216 youths, 140 (64.8%) showed recidivism within the total follow-up period, of which 59 (27.3%) with only nonviolent recidivism, 14 (6.5%) with only violent recidivism and 67 (31.0%) with both violent and nonviolent recidivism. Thus, most individuals who committed new violent offenses, also committed new nonviolent offenses (82.7%). Recidivism rates within each profile revealed significant differences between profiles; general recidivism: Χ2 (3) = 13.93, p < .01; violent recidivism: Χ2 (3) = 9.55, p = .03; and nonviolent recidivism: Χ2 (3) = 12.88, p < .01). ROC analyses revealed moderate predictive validity of the SRR and the latent profiles for general reoffending (SRR violence: AUC = .66, p < .001; SRR nonviolence: AUC = .71, p < .001; Latent profile solution: AUC = .65, p < .001) and nonviolent reoffending (SRR violence: AUC = .63, p = .001; SRR nonviolence: AUC = .69, p < .001; Latent profile solution: AUC = .63, p = .001). When predicting violent recidivism, AUC values with small effect sizes were found (SRR violence: AUC = .61, p < .01; SRR nonviolence: AUC = .62, p < .01; Latent profile solution: AUC = .59, p = .03). AUC values did not significantly differ between predictors, indicating that the SRRs and the latent profile solution provided comparable predictive validity for general, violent and nonviolent recidivism.
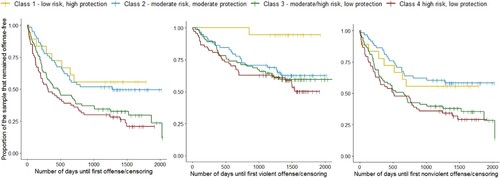
Cox regression was used to investigate how long youth within the different profiles survived without recidivism. Survival curves for general violent and nonviolent recidivism as a function of profile membership are shown in . Survival curves for general, violent and nonviolent recidivism varied by latent profile membership, general recidivism: Χ2 (3, 216) = 27.57, p < .001; violent recidivism: Χ2 (3, 216) = 19.63, p < .001; nonviolent recidivism: Χ2 (3, 216) = 22.83, p < .001. For general and nonviolent recidivism, profile 1 showed a longer survival curve compared to profile 3 (general recidivism: Exp(B) = −0.85, SE = 0.40, p = .03; nonviolent recidivism: Exp(B) = −2.08, SE = 1.02, p = .04) and compared to profile 4 (general recidivism: Exp(B) = −0.90, SE = 0.41, p = .03; nonviolent recidivism: Exp(B) = −2.20, SE = 1.02, p = .03). Similarly, profile 2 showed a longer survival function compared to profile 3 (general recidivism: Exp(B) = −0.72, SE = 0.23, p = .001; nonviolent recidivism: Exp(B) = −0.84, SE = 0.24, p = .001) and compared to profile 4 (general recidivism: Exp(B) = −0.77, SE = 0.24, p = .001; nonviolent recidivism: Exp(B) = −0.58, SE = 0.29, p = .05). For violent recidivism, profile 1 showed a longer survival curve compared to profile 3 (Exp(B) = −2.20, SE = 1.01, p = .03) and compared to profile 4 (Exp(B) = −2.28, SE = 1.02, p = .03).
Figure 2. Survival curves for general, violent and nonviolent recidivism as a function of latent profile membership.
Discussion
The ultimate goal of violence risk assessment is not predicting, but rather reducing risk level, by targeting criminogenic needs. Person centered approaches, such as LPA, could be used to identify subgroups of young individuals with similar patterns of risks and needs in risk assessment. This study explored the utility of LPA, in relation to SPJ, as a method for distinguishing clinically meaningful subgroups of youth with violent behavior based on co-occurring risk- and protective factors assessed at the start of treatment in Dutch juvenile justice institutions. Results indicated that four subgroups could be identified with differential levels of risk and protection: (1) low risk, high protection, (2) moderate risk, moderate protection, (3) moderate to high risk, low protection and (4) high risk, low protection. Risk/need level within these subgroups remained fairly consistent across the SAVRY/SAPROF-YV subscales. In line with the cumulative perspective on risk level (Sameroff, Citation2000), these subgroups appeared to correspond to general categories of risk/need level and SPJ SRRs. Additionally, subgroups correlated with recidivism post-release and different recidivism trajectories were found between subgroups. These results provide useful information for practitioners regarding different types of justice involved youth, their risk/need level and recidivism risk within the juvenile justice population.
Latent profile analysis
Similar to other LPA or latent class studies using the SAVRY (Childs et al., Citation2014; Hilterman et al., Citation2019), a low risk, high-protection group was found, which comprised 7.7% of the total sample. This subgroup had low ratings on the SAVRY and high ratings on SAPROF-YV suggesting that this group was at low risk to reoffend. According to RNR principles (Andrews & Bonta, Citation2010) this group would probably benefit most from low-intensity intervention. In other words, this group might be better off to be diverted out of juvenile justice institutions to prevent negative consequences of incarceration such as stigmatization, or contact with high-risk groups (Andrews & Dowden, Citation2006). Alternatively, they could be released on bail with outpatient treatment. For example, an appropriate intervention for this group could be placement in a small-scale community-embedded youth justice facility (Souverein et al., Citation2023). In this way, young people are not removed from their environment and the protective factors such as school or work can be maintained or rebuild. Risk assessment or screening regarding risk and protective factors during pre-trial stages, or preferably prior to placement in juvenile justice institutions, could contribute to the timely recognition of this group. Compared to the study by Childs et al. (Citation2014) and Hilterman et al. (Citation2019) this low risk, high-protection group was smaller, emphasizing the generally relatively high risk level of the current sample and the overall good match between risk level and intensity of intervention.
Subgroup two (moderate risk, moderate protection) and subgroup three (moderate-high risk, low protection) showed similar ratings on the first four subscales of the SAVRY (antisocial behavior, family functioning, personality and social support), while differences on the SAVRY treatability subscale and the protective factors subscales of SAPROF-YV seemed greater. As the treatability and social support subscales included the protective factors of the SAVRY, these results might suggest that differences between subgroup two and three were largely found in protective factors. Consequently, protective factors appear to contribute valuable information in addition to risk factors when identifying subgroups of youth. These findings imply that both subgroups two and three are in need for treatment aimed at multiple risk domains. As group three already shows a fair amount of protective factors at the start of the intervention (especially motivational factors), this group seems ready for treatment aimed at reducing risk factors. Subgroup three, however, shows fewer protective factors. For this subgroup it seems important to focus on motivating and engaging with youth first, in order to be able to treat underlying risk factors at later stage. Studies have shown that motivation for treatment is crucial in the process of change and treatment effectiveness (Salekin et al., Citation2010), and reducing the risk of recidivism (Mulder et al., Citation2010b).
Finally, a high risk, low-protection subgroup was found that showed the highest ratings on the SAVRY and the lowest ratings on the SAPROF-YV. Similar to previous LPA studies with juvenile risk assessment (e.g. Campbell et al., Citation2019; Onifade et al., Citation2008), these results suggest that this group has the highest need for intensive treatment intervention. In particular, ratings on the SAVRY subscale treatability were high, suggesting that these youth showed significant issues related to the absence of treatment motivation, noncompliance with authority, and/or poor attitudes toward school/work. In addition, ratings on the protective factors of the SAPROF-YV domains were all very low, indicating a need for improvement in this area. These results imply that, even more than for subgroup three, it seems important for this subgroup to invest in treatment motivation before underlying factors can be addressed.
Surprisingly, ratings on the SAVRY family functioning domain were low in all four latent profiles, suggesting that family problems (such as violence or maltreatment at home, or caregiver disruption) were not commonly evident in the current sample. These results are at odds with previous studies which indicated that the Dutch juvenile justice population in fact shows many problems in the area of trauma, child-maltreatment or family functioning (Hoeve et al., Citation2015). It must be noted that the risk assessments in the current study were rated based on file information that was present at the start of the intervention. It is possible that information regarding family functioning was missing in the files at the start of treatment. In line with this, Hilterman et al. (Citation2016) compared ratings on first and second SAVRY assessments and found that three historical items (early initiation of violence, childhood maltreatment, and caregiver disruption) were higher for second assessments, indicating a possible increase in knowledge regarding a juvenile’s (past) family functioning.
Finally, Cox regression analyses demonstrated that a large proportion of the low risk, high-protection profile (profile 1) remained violence free during the follow-up period. Compared to profile 1, youth in profiles 2–4 showed higher and faster violent recidivism rates over time. For general and nonviolent recidivism a smaller proportion of the profiles remained recidivism free during the follow-up period. Profiles 3 and 4 showed higher and faster recidivism rates for general and nonviolent recidivism compared to profiles 1 and 2. These results suggest that all youth are in need for interventions aimed at reducing their risk for nonviolent reoffending. All youth, with the exception of individuals in profile 1, might benefit from a specific intervention aimed at reducing violence risk. Finally, offending patterns for general, violent and nonviolent recidivism were similar for profile 3 and profile 4 (which together comprised 68% of the total sample). Although profile 4 (high risk, low protection) did show the highest recidivism rates after discharge, these were not much higher than for profile 3 (moderate to high risk, low protection). This could suggest a possible ceiling effect.
Correspondence between LPA and SPJ
Results revealed a high consistency between the SRRs for violence and the four latent profiles. Individuals in the first, second and third profile were typically classified in the corresponding risk category for violence (i.e. low, low-moderate and moderate risk). The fourth latent profile mainly consisted of youth rated with a moderate-high or high SPJ violence risk estimate. The consistency between the SRRs for nonviolent criminal behavior and the four latent profiles was less clear indicating that latent profile membership fits better with the SRR for violence than for nonviolence. This finding can be explained by the fact that the items in the SAVRY and SAPROF-YV are designed from a violence risk perspective. The ‘additional’ SPJ SRR of nonviolent reoffending is not the core focus of the risk and protective factors in these assessment tools. Taken together, these results imply that the LPA approach may not significantly augment the SPJ approach. Differences between subgroups were mainly quantitative in nature and correspondence with SPJ risk categories was high. Therefore, these results do not support the use of LPA as an alternative to the SPJ approach. With the SPJ procedure it is possible for the evaluator to consider the unique circumstances and context of the individual, which makes this procedure more effective for identifying individual needs of justice involved youth (Childs et al., Citation2014).
The result of high correspondence between LPA subgroups and violence risk ratings was somewhat inconsistent with, to our knowledge, the only previous study that compared LPA subgroups with SPJ violence risk in justice involved youth (Childs et al., Citation2014). In this study Childs et al. did find that SPJ SRR categories of the SAVRY (low, moderate and high risk for violent reoffending) were fairly consistent with their three latent subgroups. However, in their study youth were more likely to receive a higher risk rating based on SPJ than on LPA. Notably, Childs et al. (Citation2014) studied a younger and less severe sample of youth with a mean age of 16 years, and 34% being rated with a low risk of violence. In contrast, mean age in the current sample was almost 18 years and 10% was rated with a low violence risk. These differences complicate a direct comparison between these studies.
Comparative predictive validity for recidivism between LPA and SPJ
Both SRRs, and latent profile membership provided moderate predictive validity for general and nonviolent recidivism, and small predictive validity for violent recidivism. Results suggested that LPA and SPJ show equal performance when predicting recidivism in justice involved youth. However, clustering youth into subgroups might have clinical advantages for case management and intervention planning. Due to the clustering nature of LPA, and the high separation between the classes, young individuals within each of these subgroups showed a comparable risk/need level. Following the what works principles (Bonta & Andrews, Citation2016), subgroups with a higher risk/need level should receive more intensive forms of treatment or supervision. In other words, clustering youth into subgroups could facilitate therapists in more readily recognizing risk/need level, and could support the allocation of treatment and supervision resources accordingly in an efficient manner (Campbell et al., Citation2019). Additionally, LPA could be used to match services to frequently occurring combinations of needs and protective factors within certain populations. As the core focus of forensic interventions and risk assessment is recidivism reduction and not prediction, these clinical advantages may be of considerable importance and show that LPA could be a useful additional technique in clinical practice.
The predictive validity for violent recidivism of both the LPA and SPJ method was smaller than anticipated based on previous studies examining the predictive validity of juvenile risk assessment (e.g. Koh et al., Citation2020; Olver et al., Citation2009; Schwalbe, Citation2007). In light of these results, it must be noted that recidivism in the current study was measured after release, and that there were on average 36.28 days (SD = 61.03) between the risk assessment and release date. These time-gaps might have decreased the predictive validity. Additionally, it must be noted that one overall SPJ was estimated based on two separate tools with both risk and protective factors. More studies are needed in order to examine how to best integrate risk and protective factors into overall risk estimates. Another possible explanation would be that some youth committed a nonviolent offense earlier in the follow-up period, as a result of which they were detained for a period of time and therefore no longer sufficiently ‘at-risk’ to commit a new violent offense within the follow-up time. Results indeed showed that nonviolent offenses are generally committed earlier in the follow-up period (see ) and that most individuals who committed a violent offense also committed at least one nonviolent offense. However, we did not have access to actual incarceration dates during follow-up. For future studies it is advised to take limited time at risk due to new incarcerations into account when examining the predictive validity of juvenile risk assessment, especially when the predictive validity for violence is studied.
Implications for clinical practice
The results of this study may help practitioners to more readily recognize heterogeneity in presumed homogeneous samples. Findings suggest that different subgroups exist within the population of justice involved youth with violent behavior who have different levels of risk and needs. At an organizational level, these results provide important implications for increasingly matched interventions aimed at reducing risks and improving strengths. Nevertheless, the results of this study do not support that LPA should replace the traditional SPJ assessments at individual level. They do suggest that the majority of young people in Dutch juvenile justice institutions have problems within multiple areas, requiring specialized interventions aimed at differential needs. Only services that are focused on multiple criminogenic areas will have substantial impact on recidivism reduction for these groups (e.g. Lipsey, Citation2009). It is therefore of great importance that individual and repeated risk assessments are applied structurally. At group level, the results of this study could be used to inform organizations whether the types of treatments being offered map well onto the subgroups found within their settings. In addition these results could be useful for management, training of staff or recruitment of staff for specialized interventions. Based on the current results, the majority of the population in juvenile justice institutions appears to require an intervention aimed at reducing violence specifically.
An important issue that emerges from these findings is that for a proportion of the sample services are incorrectly matched to risk level. This seems to be particularly the case for the low risk, high protection subgroup. Despite their low risk level, these youth reside in incarceration settings, which potentially can have significant detrimental effects such as stigmatization and contact with higher risk groups (Latessa, Citation2011). In addition, incarceration likely reduces their high level of protective factors, as these youths are separated from their peers or family and school or leisure activities are often (temporary) discontinued. It seems vital that these low risk high protection youth receive alternative sanctions or are diverted out of the criminal justice system (Lowenkamp et al., Citation2016).
Limitations and future directions
Current findings need to be considered in the context of several limitations. These findings cannot be extrapolated to all justice involved youth. The constellation of subgroups depended on the subscales of the SAVRY/SAPROF-YV and the characteristics of the current relatively high-risk sample. It is unclear how these findings extant to lower risk samples, or specialized groups such as females or sex offenders. Future studies should aim to conduct LPA on diverse samples of justice involved youth. Also, the SAVRY and SAPROF-YV were rated retrospectively based on file information by students with little clinical experience. Although these students were carefully trained in the SAVRY and the SAPROF-YV, and reliability analyses showed good interrater reliability, it is likely that these students would rate the factors and especially the SRRs for the risk assessment tools slightly differently compared to practitioners working in clinical practice. Also, due to the file-based nature of the study some information regarding youth functioning or past might have been missing in the files, which could complicate the rating of certain risk or protective factors. For example, very low ratings were found in the SAVRY domain family functioning. It is possible that information regarding this domain was often scarce and therefore factors related to this have frequently been omitted in the files. Future prospective studies in which risk assessment tools are rated prospectively by clinicians are needed in order to further examine this hypothesis.
Second, as discussed above it was decided to carry out the predictive validity analyses with a subgroup (n = 216) of the total sample (n = 297), as too large time gaps between the risk assessment and release from the institution was expected to increasingly hamper a reliable recidivism prediction. Although this decision likely improved the reliability of recidivism predictions, it must be noted that the group who was selected for the predictive validity analyses might not exactly represent the total juvenile justice population in the Netherlands. Treatment duration in this subgroup was shorter compared to the total sample, as the youths with longer treatment durations also showed larger time gaps between the assessment and release and were therefore excluded from these analyses.
Third, based on confirmatory factor analysis it was decided to use the factor structure proposed by Hilterman et al. (Citation2016) for the SAVRY instead of the subscale structure that has been designed by the SAVRY authors (Borum et al., Citation2006). We believe that this decision led to more coherent subscales which facilitates clinical interpretation of the results. However, in the structure by Hilterman two subscales (social support and treatability) include both SAVRY risk and protective factors. As a result, it is was not possible to explicitly differentiate between the effects of risk and protective factors within these scales. Given that the SAVRY protective factors were predominantly absent in the current sample, interpretations regarding the influence of protective factors were mainly based on the SAPROF-YV subscales. Within the context of these limitations, the current findings provide a strong starting point for understanding patterns of co-occurring risk and protective factors, as measured with the SAVRY and SAPROF-YV.
Conclusion
Notwithstanding these limitations, this study provides a novel contribution to the extant violence risk assessment literature. Results of this study show that clinically meaningful subgroups of youth can be identified based on risk and protective factors in risk assessment, and that these subgroups are in line with SPJ risk categories for violence risk. Moreover, these subgroups show to be meaningful in the prediction of recidivism and offending patterns after discharge. Although LPA and SPJ subgroups show equal performance in terms of the prediction of recidivism, clustering juveniles into subgroups could have valuable implications for clinical practice, through informing agencies on patterns of risk/needs and identifying subpopulations within their organization for whom more tailored interventions may be needed. In this sense, the LPA technique could provide a useful addition to the traditional risk assessment methods on group level, but is not an alternative to the traditional risk assessment approach at an individual level.
Supplemental Material
Download MS Word (31.5 KB)Acknowledgements
We would like to thank all Juvenile Justice Institutions (JJI Den Hey-Acker, JJI De Hunnerberg, JJI De Hartelborgt, JJI Intermetzo Lelystad, Forensisch centrum Teylingereind, SJSJ Via Het Keerpunt, & Het Poortje Jeugdinrichtingen JJI Juvaid) for participating in the current study.
Disclosure statement
Co-authors De Vries Robbé and Hilterman are also authors of the SAPROF-YV, which could be viewed as a conflict of interest.
Additional information
Funding
References
- Andrews, D. A., & Bonta, J. (2010). Rehabilitating criminal justice policy and practice. Psychology Public Policy and Law, 16(1), 39–55. https://doi.org/10.1037/a0018362
- Andrews, D. A., & Dowden, C. (2006). Risk principle of case classification in correctional treatment: A meta-analytic investigation. International Journal of Offender Therapy Comparative Criminology, 50(1), 88–100. https://doi.org/10.1177/0306624X05282556
- Asparouhov, T., & Muthén, B. (2014). Auxiliary variables in mixture modeling: Three-step approaches using Mplus. Structural Equation Modeling: A Multidisciplinary Journal, 21(3), 329–341. https://doi.org/10.1080/10705511.2014.915181
- Barnes-Lee, A. R., & Campbell, C. A. (2020). Protective factors for reducing juvenile reoffending: An examination of incremental and differential predictive validity. Criminal Justice and Behavior, 47(11), 1390–1408. https://doi.org/10.1177/0093854820952115
- Bergman, L. R., & El-Khouri, B. (1987). EXACON: A Fortran 77 program for the exact analysis of single cells in a contingency table. Educational and Psychological Measurement, 47(1), 155–161. https://doi.org/10.1177/0013164487471024
- Bonta, J., & Andrews, D. A. (2016). The psychology of criminal conduct (6th ed.). Routledge.
- Borum, R., Bartel, P., & Forth, A. (2006). Manual for the structured assessment of violence risk in youth (SAVRY). Psychological Assessment Resources.
- Brand, E. F. J. M., & Van Heerde, W. K. (2004). Handleiding FPJ-lijst: forensisch profiel justitiële jeugd [Manual FPJ List: juvenile forensic profile]. Dienst Justitiële Inrichtingen.
- Campbell, C. A., Miller, W., Papp, J., Barnes, A. R., Onifade, E., & Anderson, V. R. (2019). Assessing intervention needs of juvenile probationers: An application of latent profile analysis to a risk–need–responsivity assessment model. Criminal Justice and Behavior, 46(1), 82–100. https://doi.org/10.1177/0093854818796869
- Caudill, J. W. (2010). Back on the swagger: Institutional release and recidivism timing among gang affiliates. Youth Violence and Juvenile Justice, 8(1), 58–70. https://doi.org/10.1177/1541204009339872
- Childs, K., Frick, P. J., Ryals, J. S., Lingonblad, A., & Villio, M. J. (2014). A comparison of empirically based and structured professional judgment estimation of risk using the structured assessment of violence risk in youth. Youth Violence and Juvenile Justice, 12(1), 40–57. https://doi.org/10.1177/1541204013480368
- Clark, S. L., & Muthén, B. (2009). Relating latent class analysis results to variables not included in the analysis. https://www.statmodel.com/download/relatinglca.pdf
- D’Amato, C., Campbell, C. A., Papp, J., & Miller, W. (2021). Profile analysis and risk assessment: Identifying distinct patterns of risks and needs. Youth Violence and Juvenile Justice, 19(4), 423–444. https://doi.org/10.1177/15412040211012467
- de Vries Robbé, M., Geers, M. C. K., Stapel, M., Hilterman, E. L. B., & de Vogel, V. (2014). SAPROF- Youth version. Structured assessment of protective factors for violence risk - youth version. Richtlijnen voor de beoordeling van beschermende factoren voor gewelddadig gedrag bij jeugd. Van der Hoeven Kliniek.
- de Vries Robbé, M., Geers, M. C. K., Stapel, M., Hilterman, E. L. B., & de Vogel, V. (2015). SAPROF - Youth version. Structured assessment of protective factors for violence risk - youth version. Guidelines for the assessment of protective factors for violence risk in juveniles. Van Der Hoeven Kliniek.
- de Vries Robbé, M., Veldhuizen, A., Vullings, K., Helmers, N., & van Hoof, L. (2022). Risk and protective factors for juvenile violent offending. Manuscript in preparation.
- Farrington, D. P. (1986). Age and crime. Crime and Justice-a Review of Research, 7, 189–250. https://doi.org/10.1086/449114
- Hanley, J. A., & McNeil, B. J. (1982). The meaning and use of the area under a receiver operating characteristic (ROC) curve. Radiology, 143(1), 29–36. https://doi.org/10.1148/radiology.143.1.7063747
- Harris, P. W., & Jones, P. R. (1999). Differentiating delinquent youths for program planning and evaluation. Criminal Justice and Behavior, 26(4), 403–434. https://doi.org/10.1177/0093854899026004001
- Hendriks, J., & Bijleveld, C. C. (2004). Juvenile sexual delinquents: Contrasting child abusers with peer abusers. Criminal Behaviour and Mental Health, 14(4), 238–250. https://doi.org/10.1002/cbm.591
- Hillege, S. L., Brand, E. F. J. M., Mulder, E. A., Vermeiren, R. R. J. M., & van Domburgh, L. (2017). Serious juvenile offenders: Classification into subgroups based on static and dynamic charateristics. Child and Adolescent Psychiatry and Mental Health, 11(1), 67. https://doi.org/10.1186/s13034-017-0201-4
- Hilterman, E. L., Bongers, I., Nicholls, T. L., & van Nieuwenhuizen, C. (2016). Identifying gender specific risk/need areas for male and female juvenile offenders: Factor analyses with the structured assessment of violence risk in youth (SAVRY). Law and Human Behavior, 40(1), 82–96. https://doi.org/10.1037/lhb0000158
- Hilterman, E. L. B., Vermunt, J. K., Nicholls, T. L., Bongers, I. L., & van Nieuwenhuizen, C. (2019). Profiles of SAVRY risk and protective factors within male and female juvenile offenders: A latent class and latent transition analysis. International Journal of Forensic Mental Health, 18(4), 350–364. https://doi.org/10.1080/14999013.2019.1580803
- Hoeve, M., Colins, O. F., Mulder, E. A., Loeber, R., Stams, G. J. J. M., & Vermeiren, R. R. J. M. (2015). Trauma and mental health problems in adolescent males: Differences between childhood-onset and adolescent-onset offenders. Criminal Justice and Behavior, 42(7), 685–702. https://doi.org/10.1177/0093854814558505
- Kleeven, A. T. H., de Vries Robbé, M., Mulder, E. A., & Popma, A. (2023). The validity of violence risk assessment in young adults: A comparative study of juvenile and adult risk assessment tools. Emerging Adulthood, 11(6), 1409–1422. https://doi.org/10.1177/21676968231184278
- Kleeven, A. T. H., de Vries Robbé, M., Mulder, E. A., & Popma, A. (2022). Risk assessment in juvenile and young adult offenders: Predictive validity of the SAVRY and SAPROF-YV. Assessment, 29(2), 181–197. https://doi.org/10.1177/1073191120959740
- Koh, L. L., Day, A., Klettke, B., Daffern, M., & Chu, C. M. (2020). The predictive validity of youth violence risk assessment tools: A systematic review. Psychology Crime & Law, 26(8), 776–796. https://doi.org/10.1080/1068316X.2020.1734200
- Kotelnikova, K., Lefebvre, C., Campbell, M. A., Canales, D., & Stewart, C. (2022). Intersection of personality profiles and criminogenic risk-needs in justice-involved youth. Youth Violence and Juvenile Justice, 21(3), 256–272. https://doi.org/10.1080/14999013.2021.1972061
- Latessa, E. (2011). Why the risk and needs principles are relevant to correctional programs (even to employment programs). Criminology & Public Policy, 10(4), 973–977. https://doi.org/10.1111/j.1745-9133.2011.00759.x
- Lee, J. S., & Taxman, F. S. (2020). Using latent class analysis to identify the complex needs of youth on probation. Children and Youth Services Review, 115, 105087. https://doi.org/10.1016/j.childyouth.2020.105087
- Li, D. D., Chu, C. M., Xu, X. X., Zeng, G., & Ruby, K. (2019). Risk and protective factors for probation success among youth offenders in Singapore. Youth Violence and Juvenile Justice, 17(2), 194–213. https://doi.org/10.1177/1541204018778887
- Lipsey, M. W. (2009). The primary factors that characterize effective interventions with juvenile offenders: A meta-analytic overview. Victims and Offenders, 4(2), 124–147. https://doi.org/10.1080/15564880802612573
- Lo, Y., Mendell, N., & Rubin, D. (2001). Testing the number of components in a normal mixture. Biometrika, 88, 767–778. https://doi.org/10.1093/biomet/88.3.767
- Lodewijks, H., Doreleijers, T., de Ruiter, C., & de Wit-Grouls, H. (2006). Structured assessment of violence risk in youth: Handleiding voor de gestructureerde risicotaxatie van gewelddadig gedrag bij jongeren. Rentray.
- Loeber, R., Slot, N. W., & Stouthamer-Loeber, M. (2016). A cumulative developmental model of risk and promotive factors. In R. Loeber, N. W. Slot, P. H. van der Laan, & M. Hoeve (Eds.), Tomorrow's criminals (pp. 151–180). Ashgate.
- Lopez-Romero, L., Maneiro, L., Cutrin, O., Gomez-Fraguela, J. A., Villar, P., Luengo, M. A., Sobral, J., & Romero, E. (2019). Identifying risk profiles for antisocial behavior in a Spanish sample of young offenders. International Journmal Offender Therapy Comparative Criminology, 63(10), 1896–1913. https://doi.org/10.1177/0306624X19842032
- Lösel, F., & Farrington, D. P. (2012). Direct protective and buffering protective factors in the development of youth violence. American Journal of Preventive Medicine, 43(2 Suppl 1), S8–S23. https://doi.org/10.1016/j.amepre.2012.04.029
- Lowenkamp, C. T., Latessa, E. J., & Holsinger, A. M. (2016). The risk principle in action: What have we learned from 13,676 offenders and 97 correctional programs? Crime & Delinquency, 52(1), 77–93. https://doi.org/10.1177/0011128705281747
- Maltz, M. D. (1984). Recidivism. Academic Press Inc.
- Maneiro, L., Argudo, A., & Gómez-Fraguela, X. A. (2022). Risk profiles in a Spanish sample of juvenile offenders: Implications for risk assessment and management. Psychology, Crime & Law, 1–19. https://doi.org/10.1080/1068316X.2022.2055757
- Moffitt, T. E. (1993). Adolescence-limited and life-course-persistent antisocial behavior: A developmental taxonomy. Psychological Review, 100(4), 674. https://doi.org/10.1037/0033-295X.100.4.674
- Mulder, E., Brand, E., Bullens, R., & van Marle, H. (2010a). A classification of risk factors in serious juvenile offenders and the relation between patterns of risk factors and recidivism. Criminal Behaviour and Mental Health, 20(1), 23–38. https://doi.org/10.1002/cbm.754
- Mulder, E., Brand, E., Bullens, R., & van Marle, H. (2010b). Profiling serious juvenile offenders in juvenile institutions: Change in risk factors in their population. International Journal of Forensic Mental Health, 9(2), 93–100. https://doi.org/10.1080/14999013.2010.499554
- Mulder, E., Vermunt, J., Brand, E., Bullens, R., & van Marle, H. (2012). Recidivism in subgroups of serious juvenile offenders: Different profiles, different risks? Criminal Behaviour and Mental Health, 22(2), 122–135. https://doi.org/10.1002/cbm.1819
- Mulvey, E. P., Steinberg, L., Fagan, J., Cauffman, E., Piquero, A. R., Chassin, L., Brame, R., Schubert, C. A., Hecker, T., & Losoya, S. H. (2004). Theory and research on desistance from antisocial activity among serious adolescent offenders. Youth Violence and Juvenile Justice, 2(3), 213–236. https://doi.org/10.1177/1541204004265864
- Nylund, K. L., Asparoutiov, T., & Muthen, B. O. (2007). Deciding on the number of classes in latent class analysis and growth mixture modeling: A Monte Carlo simulation study. Structural Equation Modeling-A Multidisciplinary Journal, 14(4), 535–569. https://doi.org/10.1080/10705510701575396
- Oberski, D. (2016). Mixture models: Latent profile and latent class analysis. In J. Robertson, & M. Kaptein (Eds.), Modern statistical methods for HCI (pp. 275–287). Springer.
- Olver, M. E., Stockdale, K. C., & Wormith, J. S. (2009). Risk assessment with young offenders. A meta-analysis of three assessment measures. Criminal Justice and Behavior, 36(4), 329–353. https://doi.org/10.1177/0093854809331457
- Onifade, E., Davidson, W., Livsey, S., Turke, G., Horton, C., Malinowski, J., Atkinson, D., & Wimberly, D. (2008). Risk assessment: Identifying patterns of risk in young offenders with the Youth Level of Service/Case Management Inventory. Journal of Criminal Justice, 36(2), 165–173. https://doi.org/10.1016/j.jcrimjus.2008.02.006
- Oxnam, P., & Vess, J. (2006). A personality-based typology of adolescent sexual offenders using the Millon Adolescent Clinical Inventory. New Zealand Journal of Psychology, 35(1), 36–44.
- Oxnam, P., & Vess, J. (2008). A typology of adolescent sexual offenders: Millon adolescent clinical inventory profiles, developmental factors, and offence characteristics. Journal of Forensic Psychiatry & Psychology, 19(2), 228–242. https://doi.org/10.1080/14789940701694452
- Ozkan, T. (2016). Reoffending among serious juvenile offenders: A developmental perspective. Journal of Criminal Justice, 46, 18–31. https://doi.org/10.1016/j.jcrimjus.2016.02.017
- Rice, M. E., & Harris, G. T. (1995). Violent recidicism: Assessing predictive validity. Journal of Consulting and Clinical Psychology, 63(5), 737–748. https://doi.org/10.1037/0022-006X.63.5.737
- Rogers, R. (2000). The uncritical acceptance of risk assessment in forensic practice. Law and Human Behavior, 24(5), 595–605. https://doi.org/10.1023/A:1005575113507
- Salekin, R. T., Lee, Z., Schrum Dillard, C. L., & Kubak, F. A. (2010). Child psychopathy and protective factors: IQ and motivation to change. Psychology, Public Policy, and law, 16(2), 158. https://doi.org/10.1037/a0019233
- Sameroff, A. J. (2000). Dialectical processes in developmental psychopathology. In A. J. Sameroff & M. Lewis (Eds.), Handbook of developmental psychopathology (pp. 23–40). Springer.
- Schoenfeld, D. (1982). Partial residuals for the proportional hazards regression-model. Biometrika, 69(1), 239–241. https://doi.org/10.1093/biomet/69.1.239
- Schwalbe, C. S. (2007). Risk assessment for juvenile justice: A meta-analysis. Law and Human Behavior, 31(5), 449–462. https://doi.org/10.1007/s10979-006-9071-7
- Schwalbe, C. S., Macy, R. J., Day, S. H., & Fraser, M. W. (2008). Classifying offenders. An application of latent class analysis to needs assessment in juvenile justice. Youth Violence and Juvenile Justice, 6(3), 279–294. https://doi.org/10.1177/1541204007313383
- Schwarz, G. (1978). Estimating the dimension of a model. The Annals of Statistics, 6(2), 461–464. https://doi.org/10.1214/aos/1176344136
- Souverein, F., Oostermeijer, S., Johns, D., Ross, S., van Domburgh, L., Popma, A., & Mulder, E. (2023). Small-scale, community-embedded youth justice facilities: Lessons from Dutch reforms and recommendations for cross-jurisdictional implementation. The Prison Journal, 103(5), 679–701. https://doi.org/10.1177/00328855231200638
- van Dam, C., de Bruyn, E. E. J., & Janssens, J. M. A. M. (2007). Personality, delinquency, and criminal recidivism. Adolescence, 42(168), 763–777.
- van Kordelaar, W. (2002). Beslissingsondersteuning onderzoek geestesvermogens in het strafrecht voorvolwassenen [Decision support research mental capacity in criminal justice for adults]. Kluwer.
- Viljoen, S., Viljoen, J. L., Nicholls, T. L., & De Vries Robbé, M. (2017). The role of protective factors in forensic risk assessments. In R. Roesch, & A. N. Cook (Eds.), Handbook of forensic mental health services (pp. 199–235). Routledge.
- Walker, S. C., Bishop, A. S., Nurius, P. S., & Logan-Greene, P. (2016). The heterogeneity of treatment needs for justice-involved girls. A yypology using latent class analysis. Criminal Justice and Behavior, 43(3), 323–342. https://doi.org/10.1177/0093854815615162
- Weijters, G., Verweij, S., Tollenaar, N., & Hill, J. (2019). Recidive onder justitiabelen: Verslag over de periode 2006-2018 [Recidivism among offenders in the Netherlands: Report covering the period 2006-2018]. https://www.wodc.nl/binaries/Cahier%202019-10_Volledige%20tekst_tcm28-396007.pdf