
Abstract
Context
Ferroptosis may play an essential role in lipid peroxidation and endothelial dysfunction of aortic endothelial cells (ECs) in type 2 diabetes mellitus (T2DM) with atherosclerosis (AS). Hydroxysafflor yellow A (HSYA) has shown substantial antioxidant stress and anti-ferroptosis.
Objective
This study confirms whether HSYA improves symptoms in a mouse model of T2DM/AS and elucidates the underlying mechanisms.
Materials and methods
ApoE-/- mice were fed with high fat combined with 30 mg/kg streptozotocin to establish a T2DM/AS model. Then mice were treated with intraperitoneal injections of 2.25 mg/kg HSYA for 12 weeks. Human Umbilical Vein Endothelial cells (HUVEC) induced by 33.3 mM d-glucose +100 μg/mL ox-LDL were used to construct a high lipid and high glucose cell model treated with 25 μM HSYA. The changes in oxidative stress- and ferroptosis-related markers were detected, and the regulatory effect of HSYA on the miR-429/SLC7A11 was also verified. Normal ApoE-/- mice or HUVEC cells were used as the control group.
Results
HSYA effectively reduced atherosclerotic plaque formation in the T2DM/AS mouse model and inhibited HUVEC ferroptosis, such as upregulating GSH-Px, SLC7A11 and GPX4, but inhibited ACSL4. Furthermore, HSYA also downregulated the expression of miR-429, which further regulated SLC7A11 expression. After miR-429 mimic or SLC7A11 siRNA transfection in the HUVEC, the antioxidative stress and anti-ferroptosis effects of HSYA were significantly abolished.
Conclusions
HSYA is expected to become an important health drug to prevent the occurrence and development of T2DM/AS.
Introduction
The global burden and incidence of diabetes mellitus (DM) are increasing in developed and developing countries (Ali et al. Citation2022). According to a 2022 report by the International Diabetes Federation (IDF), approximately 537 million adults (20–79 years old) worldwide have diabetes, and the number is expected to reach 783 million by 2045 (http://www.diabetesatlas.org). Diabetic patients have a 2-3× greater probability of developing atherosclerosis (AS) than other people, and AS is the pathological basis of macrovascular diseases in middle-advanced patients with diabetes. The pathogenic factors of AS are complex and generally believed to be related to endothelial dysfunction and oxidative stress (La Sala et al. Citation2019). Clinical control methods for patients with DM and AS are limited, and simple blood glucose management cannot effectively reduce the associated disability and mortality. Therefore, clarifying the pathological mechanisms and exploring valuable drug targets may support the development of clinical therapeutic drugs.
Ferroptosis is a recently discovered type of nonapoptotic cell death (Vinchi et al. Citation2020); it is driven by abnormal iron metabolism and lipid peroxidation and is closely associated with the pathogenesis of AS. Iron overload from increased iron accumulation during AS triggers reactive oxygen species (ROS) production and stimulates monocyte recruitment, leading to vascular oxidative stress and plaque formation (Vinchi et al. Citation2020). The inhibition of ferroptosis can reduce lipid peroxidation in aortic endothelial cells (ECs), alleviating ECs dysfunction and delaying AS (Bai et al. Citation2020; Yang et al. Citation2021). Bai et al. (Citation2020) reported that, in mouse aortic ECs, the inhibition of ferroptosis alleviated AS by reducing lipid peroxidation and endothelial dysfunction. Similar findings have been found in diabetic models, wherein ferroptosis was observed to cause oxidative stress and dysfunction in ECs (Luo et al. Citation2021). Meng et al. (Citation2021) confirmed that inhibiting ferroptosis might help significantly reduce the progression of AS in diabetic ApoE-/- mice with AS; moreover, using HUVECs, they further demonstrated that inhibiting ferroptosis could help reduce the occurrence of ferroptosis effectively. High glucose and high fat induce oxidative stress and vascular EC dysfunction.
Hydroxysafflor yellow A (HSYA), a single chalcone glycoside and the active ingredient of Carthamus tinctorius L. (Asteraceae), is clinically injected to prevent and treat ischemic cerebrovascular diseases. HSYA has apparent anti-inflammatory, antioxidative, and antiangiogenic functions both in vitro and in vivo (Ji et al. Citation2009; Liu et al. Citation2012) and improves AS and diabetes. Moreover, HSYA not only attenuates H2O2-induced oxidative damage in HUVECs (Xie et al. Citation2020) but also inhibits the occurrence of cellular ferroptosis caused by oxygen-glucose deprivation and reperfusion (Chen et al. Citation2022). In summary, HSYA may have protective effects against ferroptosis in cardiovascular-related tissues.
In-depth studies on noncoding RNAs (ncRNAs) have shown that natural products may play a role in disease treatment by regulating gene and ncRNA expression. In particular, miRNAs are one of the essential representatives of ncRNAs. Their classic effect is to bind the mRNAs of target genes and induce their degradation, eventually reducing the gene protein content (Gezici and Sekeroglu Citation2017). Therefore, some natural products have been proven effective in preventing or treating AS and T2DM by modifying the cellular miRNA profiles (Xu et al. Citation2017; Li et al. Citation2019).
Herein, we constructed a T2DM + AS model using ApoE-/- mice to verify the therapeutic effects of HSYA on diabetes complicated with AS. The transcriptome was subjected to high-throughput sequencing to analyze the miRNAs specifically regulated by HSYA and uncover the specific mechanisms of action between miRNAs and ferroptosis. The protective effects of HSYA on EC ferroptosis were further verified using HUVECs. Overall, we sought to clarify the roles of HSYA in alleviating T2DM + AS and explore the mechanisms by which it improves EC dysfunction by inhibiting ferroptosis.
Materials and methods
Animal experiments
Ethical approval was obtained from the Ethics Committee of Suzhou Traditional Chinese Medicine Hospital (no.: 2022-068), Suzhou, China. Twenty-four male ApoE-/--deficient C57BL/6 mice were purchased from Beijing Charles River Laboratory Animal Technology Co., Ltd. After 1 week of adaptive feeding, the fasting blood glucose (FBG) levels of the mice were tested using the ONETOUCH blood glucose monitor (Ultra; Johnson & Johnson, USA), and the basal FBG value of the mice was recorded as the 4th-week values. The mice were fed a high-fat diet (cat no. XT108C, Jiangsu Xietong Pharmaceutical Bioengineering Co., Ltd.) for 1 month. Subsequently, streptozotocin (STZ; 30 mg/kg dissolved in 0.05 mol/L citrate buffer, pH 4.5, IP) was administered to the mice for three consecutive days to construct a type 2 diabetes model, refer to the study by Xu et al. (Citation2017). The control group (nondiabetic mice) mice were injected with citrate buffer. FBG detection was performed on the fourth day after the last injection of STZ (recorded as week 1). The diabetes model was confirmed to be successfully established when the FBG level was >16.7 mmol/L (Leng et al. Citation2016). After securing the establishment of the diabetes model, the diabetic mice were randomly divided into two groups: the model group (n = 8) and the HSYA group (n = 8). Both groups of mice were fed a high-fat diet for 12 weeks. Then, the mice were simultaneously administered an intraperitoneal injection of 2.25 mg/kg HSYA [MW = 612.53, purity > 98.6%; Chengdu Must Biotechnology Co., Ltd., China) for treatment (Ma et al. Citation2019). During high-fat diet-induced AS in type 2 diabetic mice (T2DM-AS), FBG was monitored every 4 weeks. The entire experiment was completed by the 12th week. The peripheral blood of the mice was extracted to detect the total cholesterol (TC), triglyceride (TG), low-density lipoprotein cholesterol (LDL-c), and high-density lipoprotein cholesterol (HDL-c) levels. Tissues were collected to determine each group’s degree of AS progression through pathological analysis.
Biochemical index detection
At the end of the experiment, mice were anesthetized with 1.5% isoflurane and whole blood was quickly extracted from the mouse eyeballs, and serum was obtained by centrifugation. After blood collection, the mice were sacrificed. Biochemical detection kits from Solarbio Reagent Company, Beijing, were used to measure the TC (cat no. BC1980), TG (cat no. BC0625), and HDL-c (cat no. BC5320) levels. According to the manufacturer’s instructions, the LDL-c (cat no. A113-1-1) level was detected using a kit from the Nanjing Jiancheng Institute of Biology.
Oil red O staining
In the 12th week, the aortas (from the heart to the kidneys) were stripped from each group and fixed in neutral formaldehyde for 24 h, followed by oil red O staining. Briefly, the aorta was infiltrated with 60% isopropanol (diluted with water) for 10 min and then immersed in an oil red O dye solution for 10 min. Then, 60% isopropanol was used to remove the excess oil red O dye, and the aorta was rinsed with water for 3 min. The excess water on the aortic tissue was absorbed before observation and image acquisition.
In addition, the aortic tissues of three mice from each group were dehydrated with sucrose and embedded in an O.C.T tissue-embedding medium (Tissue-Tek, Japan). Then 7 µm thick frozen sections were prepared using a cryostat (CM1860, Leica). The frozen sections were fixed in neutral formaldehyde for 10 min, and then subjected to oil red O staining according to the manufacturer’s instructions (cat no. G1261, Solarbio). The sections were mounted with glycerine–gelatine and then observed and photographed under an optical microscope (DM500, Leica).
Pathological detection
The aortic tissues of 5 mice were selected from each group and fixed in neutral formaldehyde for 24 h. The tissues were then embedded in paraffin and cut into 5 μm thick sections. The sections (n = 3/group) were stained with hematoxylin–eosin after deparaffinization. After dehydration in 95% alcohol, tissue sections were transparent with xylene and sealed with neutral resin. Pathological results were obtained through light microscopy. Three sections from each group were subjected to Masson staining to observe vascular collagen deposition. For specific staining methods, refer to the instructions of the Masson staining kit (cat no. G1346, Solarbio).
Immunohistochemistry
The expression levels and distribution of the AS marker proteins intercellular adhesion molecule (ICAM) and vascular cell adhesion molecule (VCAM) in the aortic tissues of each group (n = 3) were measured using immunohistochemistry. After deparaffinization, the paraffin sections were incubated with 3% H2O2 for 20 min. Tissue antigen retrieval was performed at 121 °C for 20 min using citrate buffer (pH = 6.0). Then, 1% bovine serum albumin was added for 20 min. Rabbit anti-mouse ICAM (cat no. ab222736, Abcam) and VCAM (cat no. ab134047, Abcam) antibodies were added dropwise, and the tissues were incubated at 4 °C for 16 h. After washing away the unbound primary antibody, goat anti-rabbit IgG-HRP antibody (cat no. ab6721, Abcam) was added dropwise to the tissues and incubated at 37 °C for 1 h. 3,3’-Diaminobenzidine developer solution was used for color development. Hematoxylin was used to stain the nuclei. After dehydration with alcohol, the sections were mounted with neutral gum after the xylene became transparent. The results were photographed under an optical microscope (Leica). Statistical quantification of the positive densitometric values was performed using Image-Pro Plus 6.0.
Western blot
Aortic tissue or cells (5 × 10⁶) were added to RIPA lysis buffer (20 μL phosphatase inhibitor cocktail/mL of lysis buffer), and the tissue was homogenized with a tissue disrupter (under precooled conditions). The supernatant was collected after centrifugation at 12,000 g for 15 min at 4 °C. The collected supernatant (5 μL) was used for protein content detection using bicinchoninic acid analysis. The remaining proteins were added to the loading buffer and heated at 100 °C for 5 min. After the separation of the proteins using sodium dodecyl-sulfate polyacrylamide gel electrophoresis, the proteins were transferred to polyvinylidene fluoride membranes (Millipore, Germany). Then, the membranes were blocked with 5% non-fat milk for 2 h at room temperature. Primary antibodies [rabbit anti-mouse ICAM, VCAM, acyl-CoA synthetase long-chain family member 4 (ACSL4, cat no. ab155282), glutathione peroxidase 4 (GPX4, ab125066), solute carrier family 7 member 11 (SLC7A11, ab175186), and glyceraldehyde-3-phosphate dehydrogenase (GAPDH)] were added. The membranes were incubated at 4 °C for 16 h. Goat anti-rabbit IgG-HRP secondary antibody was added dropwise, and the membranes were incubated at room temperature for 1 h. An enhanced chemiluminescence agent was used for image development. Imaging was performed using the ChemiDoc-It Imaging System (UVP). The results were quantified using ImageJ software for densitometric values. Normalisation was performed using GAPDH for internal reference. The abovementioned antibodies were purchased from Abcam.
Oxidative stress indicator detection
Fresh aortic tissue (n = 4) was added to precooled phosphate-buffered saline at a ratio of 1:9 (m/v), and the tissue homogenate was prepared at 4 °C. The supernatant was collected after centrifugation at 3000 g for 5 min at 4 °C. The glutathione peroxidase (GSH-Px, cat no. BC1195) and malondialdehyde (MDA, cat no. BC0025) contents in the supernatant were detected. Flow cytometry (Attune NxT, Applied Biosystems) was used to detect the ROS levels (cat no. CA1410). The abovementioned kits were all purchased from Solarbio.
Iron ion content detection
The iron ion content was detected in the tissue homogenate supernatants or cell lysates in cell experiments using an Abcam iron ion detection kit (cat no. ab83366).
Cell culture and grouping
Human umbilical vein endothelial cells (HUVECs) were purchased from Zhejiang Ruyao Biotechnology Co., Ltd. HUVECs were cultured in EGM-2 medium (cat no. CC-3162, Lonza) for endothelial cells. Subculturing was performed in a 37 °C incubator containing 5% CO2. Cell grouping (cell group 1) was performed as follows: 1. HUVEC group, experimental control, without any treatment; 2. HG + ox-LDL group, supplied 33.3 mM d-glucose (You et al. Citation2019) + 100 μg/mL ox-LDL (Zhang et al. Citation2019) [ox-LDL was purchased from Yeasen Biotechnology (Shanghai) Co., Ltd.; cat no. 20605ES05] for 48 h; 3. HSYA group, HUVECs were treated with 25 μM HSYA for 48 h; 4. HG + ox-LDL + HSYA group, 33.3 mM d-glucose + 100 μg/mL ox-LDL was administered, and then the cells were simultaneously treated with 25 μM HSYA for 48 h. After the experiment, the GSH-Px, MDA, ROS, and iron ion contents in the cell lysate were detected. The expression levels of the ferroptosis-related proteins SLC7A11, GPX4, and ACSL4 were also detected using western blotting.
Cell viability assay
Cell viability was detected using a methyl thiazolyl tetrazolium (MTT) assay. The cells were seeded into each well of a 96-well plate (2 × 10⁴ cells/well) and cultured for 24 h (37 °C in an incubator with constant temperature and 5% CO2). On the first day after cell injection, the cells were treated with different concentrations of HSYA. MTT detection was performed at other time points: scheme 1, cells treated with different doses (0, 10, 25, 50, 100, 200, and 400 μM) of HSYA for 48 h; scheme 2, cells treated with 25 μM HSYA for 24, 48, and 72 h (with the activity of HUVECs at each time point as the control). Then, 10 μL of MTT reagent (Ameresco, USA) was added to the wells, and the 96-well plate was incubated at 37 °C for 4 h. The supernatant was discarded, 100 μL of dimethyl sulfoxide was added, and the absorbance value at 560 nm was detected with a microplate reader.
Lactate dehydrogenase detection
The supernatant medium of cell group 1 after treatment was taken. According to the manufacturer’s details, the lactate dehydrogenase (LDH) content was detected using Abcam’s LDH detection kit (cat no. ab102526).
Transcriptome data analysis
HUVEC cells from Model and HSYA groups were collected, and total cellular RNA extraction was performed using Trizol (Invitrogen). The expression of cellular miRNA gene transcripts was detected by high-throughput sequencing (Illumina). miRNAs closely associated with AS and ferroptosis were screened. Target genes for miRNAs potentially binding were predicted by ENCORI (https://rna.sysu.edu.cn/encori/index.php).
Real-time quantitative PCR
Total RNA was extracted from 2 × 10⁶ cells using the TRIzol method. The quantity and purity of the extracted RNA were determined by measuring the absorbance at OD260/OD280 nm. First-strand cDNA was synthesized from 2 μg of RNA using a cDNA reverse transcription kit (E044-01A, Novoprotein). qPCR detection was performed on an ABI 7500 system using SYBR green PCR master mix (Applied Biosystems). The qPCR programme was as follows: 5 min at 95 °C; 40 cycles of 15 sec; denaturation at 95 °C and 20 s extension at 60 °C; and 10 min extension at 72 °C. The relative gene expression levels were calculated using the comparative Ct method. Normalisation was performed using GAPDH as the internal reference gene. miRNA was detected based on the instructions of the miRcute miRNA one-step kit. Using U6 as an internal reference, miR-429 expression was detected using a two-step dye kit. Triplicate reactions were performed for each gene per sample. The qPCR primer design is presented in .
Table 1. qPCR Primer design.
Dual-luciferase reporter activity assay
Mutant sequences were constructed based on the predicted targeted-binding sites. A dual-luciferase reporter gene plasmid was constructed using the pIS0 plasmid, and pRL-TK was used as the internal reference plasmid. The amount of transfected nucleic acid/well was as follows: Luc-3′-UTR plasmid 200 ng; pRL-TK 50 ng; miR-429 mimic and mimic NC 2.5 μL (final concentration, 100 nM). The cells were cotransfected with either wild-type or mutant reporter gene plasmids, internal control plasmids, and miR-429 mimic or mimic NC. Then, 2 μL of Lipo2000 was added. The medium was replaced 4 h after transfection. The HUVECs were collected after 48 h and measured using Promega’s dual-luciferase reporter system. The relative luciferase activity was expressed as the ratio of firefly luciferase activity to Renilla luciferase activity. The wild-type SLC7A11 amplification primer sequence was Mlu I-upstream primer-5′-cga cgc gtt aat ttt cat ata aac agt att t-3′, Xba I-downstream primer-tgc tct aga tga tct cga act cct gac ct; the mutant SLC7A11 amplification primer sequence was Mlu I-upstream primer-5′-cga cgc gtt aat ttt cat ata atg tca taa t-3′, Xba I-downstream primer-5′-tgc tct aga tga tct cga act cct gac ct-3′; the size of the amplified product was 207 bp.
Cell transfection
The SLC7A11 siRNA sequence was designed using siDirect version 2.0 (http://sidirect2.rnai.jp/), an online design software. The cell transfection method is briefly described below. HUVECs were seeded into 10 cm dishes at a density of 5 × 10⁶ cells/well and incubated overnight at 37 °C. SLC7A11-siRNA (100 pmol), miR-429 mimic (100 nM), or miR-429 inhibitor (100 nM) were then transfected into the HUVECs using Lipofectamine RNAiMAX (Thermo). The cells were harvested 48 h after the transfection, and the transfection efficiency was detected using qPCR. SLC7A11-siRNA, miR-NC, miR-429 mimic, and miR-429 inhibitor were synthesized by Shanghai Gene Pharma Biotechnology Company. The cell grouping (cell group 2) was as follows: 1, HUVEC group; 2, HG + ox-LDL group; 3, inhibitor group (the HUVECs were transfected with miR-429 inhibitor); 4, inhibitor + si-SLC7A11 group (the HUVECs were transfected and cotransfected with miR-429 inhibitor and SLC7A11 siRNA); 5. HSYA group (the cells were treated with 25 μM HSYA for 48 h); 6. HSYA + mimic group (the cells were treated with 25 μM HSYA for 48 h after transfection with miR-429 mimic); 7. HSYA + si-SLC7A11 group (the cells were transfected with SLC7A11 siRNA, and 25 μM HSYA was added for 48 h). The cells from groups 2-7 were all induced in an environment containing 33.3 mM d-glucose + 100 μg/mL ox-LDL. Cell group 2 was subjected to MTT analysis at 24, 48, and 72 h of treatment. After the experiment, the GSH-Px, MDA, ROS, and iron ion contents in the cell lysate were detected. The expression levels of the ferroptosis-related proteins SLC7A11, GPX4, and ACSL4 were simultaneously detected by western blotting.
Statistical analysis
All data from the current study are presented as the mean ± standard deviation based on three repetitions. All data are presented using GraphPad Prism Software (version Prism 8; GraphPad Software, Inc.). Between-group comparisons were conducted using Student’s t-test. p < 0.05 was considered statistically significant.
Results
HSYA reduces aortic lipid accumulation in T2DM atherosclerotic ApoE-/- mice
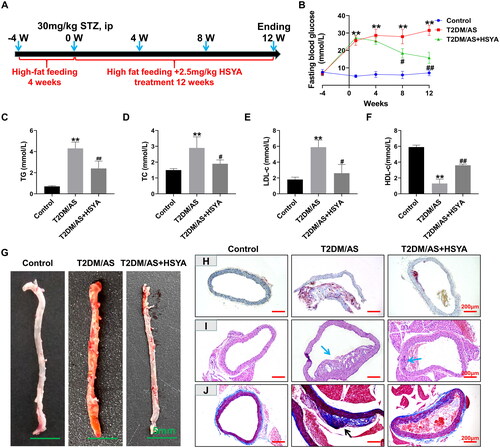
ApoE-/- mice can produce AS after administration of a high-fat diet. On this basis, STZ was administered to construct the T2DM/AS disease model. The overall experimental period was 16 weeks. presents the animal experiments and HSYA treatment time axis. The FBG value of the T2DM/AS group increased from 6.8 ± 1.4 mmol/L to 25.6 ± 1.7 mmol/L 1 week after the STZ injection and remained stable at >16.7 mmol/L over the following 11 weeks. Although the FBG value of the T2DM/AS + HSYA group increased from 6.5 ± 0.8 mmol/L to 27.2 ± 1.5 mmol/L when the STZ injection was first administered, the FBG value decreased to 15.8 ± 3.2 mmol/L after 12 weeks of continuous HSYA treatment. Compared with that in the T2DM/AS group, the difference was statistically significant (p < 0.01, ) in the T2DM/AS + HSYA group. The results of the biochemical detection of TG, TC, LDL-c, and HDL-c () showed that in the T2DM + AS model, the TG, TC, and LDL-c indexes were significantly upregulated, whereas the HDL-c index was significantly downregulated. Compared with that in the control group, the difference was statistically significant (p < 0.01) in the T2DM/AS group. After treatment with 2.25 mg/kg HSYA for 3 months, the TG, TC, LDL-c, and HDL-c indexes were effectively recovered (compared with those in the model group; p < 0.01). The results of oil red O staining of the aortic tissue showed () large amounts of oil accumulation inside the aortic vessels of the model group (orange-red appearance). However, the collection of oil was significantly reduced in the HSYA group. The pathological results (: HE staining; : Masson staining) showed that the model group had abnormal vascular endothelial hyperplasia, and large numbers of plaques were generated after lipid accumulation (, marked by blue arrows in the figure). Simultaneously, in the plaque, extensive collagen deposition was observed in the tissue (dark blue represents collagen deposition in ), as identified by the black arrows). The collagen distribution in the HSYA group was similar to that in the control group, and no collagen deposition was noted in the plaques.
Figure 1. HSYA reduces lipid accumulation in the T2DM + AS model mice (A) Operation timeline of the animal experiments; (B) ApoE-/- mice were fed a high-fat diet before induction (week-4) 4 days after the injection of 30 mg/kg STZ for 3 consecutive days (week 1). the high-fat diet induction continued until the end of the experiment (week 12). Mouse FBG test results; (C-F) at the end of the experiment, the TG, TC, LDL-c, and HDL-c levels in the serum of the mice were detected (n = 8); the whole aorta was stained with G oil red O; (H) oil red O-stained frozen sections of the aortic tissue; (I) the HE staining results of the mouse aortic tissue, with blue arrows indicating lipid plaques; (J) Masson staining results of the mouse aortic tissue, plaque collagen deposition is marked with black arrows. Compared with the control group, *p < 0.05, **p < 0.01; compared with the T2DM/AS group, #p < 0.05, ##p < 0.01.
HSYA inhibits the expression of the AS marker proteins ICAM and VCAM
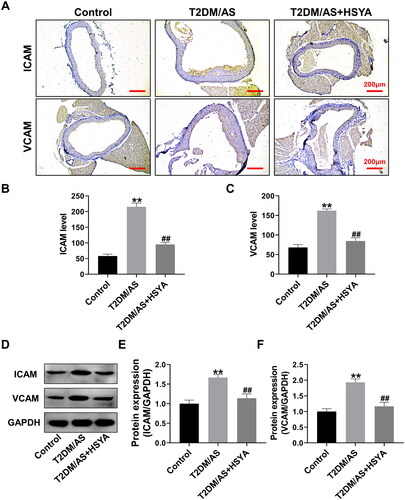
ICAM and VCAM are essential markers of AS progression (Moss and Ramji Citation2016). Therefore, in this part, we focused on detecting the expression and distribution of these proteins. Immunohistochemical experiments () showed that ICAM and VCAM were strongly expressed in the AS vascular plaque tissue. Moreover, HSYA treatment significantly inhibited the ICAM and VCAM protein expression levels in the aorta (same as that in the T2DM/AS group; p < 0.01). Western blotting () further confirmed that HSYA could significantly downregulate the ICAM and VCAM protein expression (compared with that in the T2DM/AS group; p < 0.01).
Figure 2. HSYA inhibits the expression of aortic ICAM and VCAM proteins (A) the expression intensity and distribution of ICAM and VCAM proteins in the aorta of mice in each group (n = 3) were detected by immunohistochemistry; (B andC) IPP 6.0 software was used to statistically Quantify the optical density values of the immunohistochemical detection results; (D andF) the ICAM and VCAM expression levels in the aortic tissues of the mice in each group (n = 3) were detected by western blotting, and the optical density values of the protein bands were statistically quantified using ImageJ software. **p < 0.01, *p < 0.05, compared with the control group; ##p < 0.01, #p < 0.05, compared with the T2DM/AS group; the difference was statistically significant.
HSYA inhibits aortic ferroptosis in T2DM/AS mice
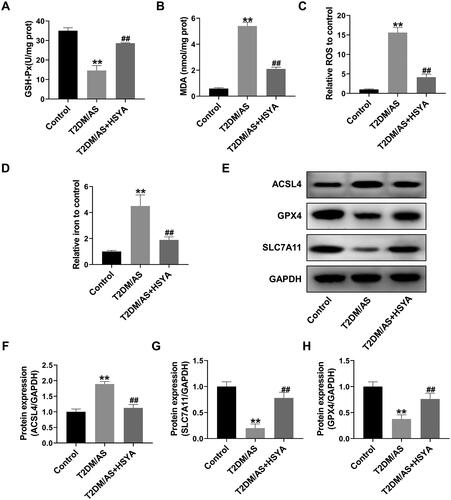
EC ferroptosis is one of the initiating factors of AS (Ouyang et al. Citation2021). Therefore, ferroptosis-related indicators in the T2DM/AS model were tested. First, lipid peroxidation-related indicators were detected. Compared with that in the control group, in the T2DM/AS group, the GSH-Px enzyme activity was significantly inhibited (), whereas the oxidative stress damage indicators MDA () and ROS were upregulated considerably (, p < 0.01). By contrast, the GSH-Px activity was upregulated considerably after HSYA treatment, whereas MDA and ROS were significantly downregulated compared with that in the T2DM/AS group (p < 0.01). Furthermore, the intracellular iron ion contents were detected (), and the results showed that HSYA significantly inhibited iron ion accumulation in the aortic tissue (compared with that in the T2DM/AS group, p < 0.01). Western blotting () showed that the ferroptosis inhibition-related proteins GPX4 and SLC7A11 were significantly upregulated because of HSYA, whereas the ferroptosis-promoting protein ACSL4 was significantly inhibited. Compared with the T2DM/AS group, the difference was statistically significant in the HSYA group (p < 0.01).
Figure 3. HSYA inhibits the occurrence of aortic ferroptosis in the T2DM + AS model mice (A–C) Biochemical detection of the GSH-Px, MDA, and ROS contents in the aortic tissue of the mice in each group (n = 4); (D) Detection of iron ion contents in the aortic tissue (n = 4); (E–H) expression levels of the ferroptosis-related proteins ACSL4, SLC7A11, and proteins in the aortic tissues of the mice in each group (n = 3) were detected by western blotting, and the optical density values of the protein bands were statistically quantified using ImageJ software. **p < 0.01, *p < 0.05, compared with the control group; ##p < 0.01, #p < 0.05, compared with the T2DM/as group; the difference was statistically significant.
HSYA inhibits high glucose and ox-LDL-induced ferroptosis in HUVECs
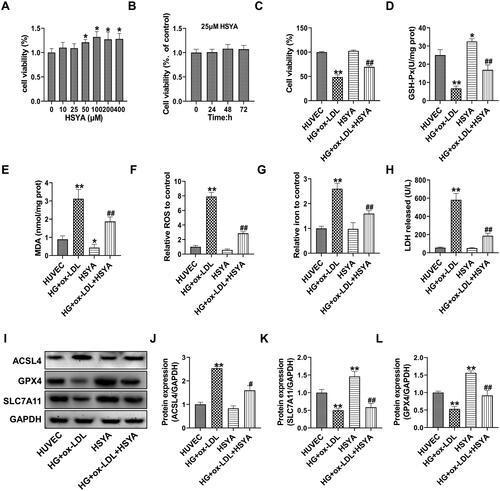
To confirm that the therapeutic effects of HSYA on T2DM-AS model mice were achieved by inhibiting the occurrence of EC ferroptosis, HUVECs were used for a unique experiment. First, the impact of HSYA on HUVEC proliferation was investigated using the MTT assay. The results showed that HSYA exerted no obvious cytotoxicity on HUVECs when used at doses of 10-400 μM. When the HSYA concentration was >50 μM, HSYA significantly increased cell viability. Treatment with 25 μM HSYA had no significant effects on the viability of the HUVECs within 24–72 h (). Therefore, in the present study, 25 μM HSYA was used as the experimental concentration in the cell experiments. After the HUVECs were treated with 33.3 mM d-glucose + 100 μg/mL ox-LDL for 48 h, the cell activity of the HG + ox-LDL group was significantly inhibited (compared with that of the control group, p < 0.01). In the HG + ox-LDL + HSYA group, the activity of the HUVECs was significantly increased under stress caused by 33.3 mM d-glucose + 100 μg/mL ox-LDL (compared with that in the HG + ox-LDL group, p < 0.01). In addition, after HSYA treatment, the GSH-Px activity was significantly increased, whereas the levels of intracellular MDA, ROS, iron ions, and LDH in the medium were inhibited considerably (compared with those in the HG + ox-LDL group, p < 0.01, ). Protein-level experiments showed that HSYA could dramatically reverse the inhibitory effects of 33.3 mM d-glucose + 100 μg/mL ox-LDL on GPX4 and the SLC7A11 proteins in HUVECs and significantly down-regulate the expression of ACSL4 protein (compared with that in the HG + ox-LDL group, p < 0.05).
Figure 4. HSYA inhibits high glucose- and high fat-induced ferroptosis in HUVECs. (A–C) MTT assay was used to detect cell viability. (D–G) Biochemical detection of the GSH-Px, MDA, ROS, and iron ion contents in the cell Lysates (n = 3). (H) Biochemical detection of the LDH content in the supernatant of the cell culture medium (n = 3). (I-L) the protein expression levels of the ferroptosis-related proteins ACSL4, SLC7A11, and GPX4 in the cells were detected by Western blotting, and the optical density values of the protein bands were statistically quantified using ImageJ software. Compared with the control group, *p < 0.05, **p < 0.01; compared with the HG + ox-LDL group, #p < 0.05, ##p < 0.01.
HSYA affects SLC7A11 gene expression by regulating the miRNA network
To determine the specific mechanisms through which HSYA regulates ferroptosis, we further analyzed the miRNA expression profiling data of the mouse aortas. We found 224 miRNAs that were significantly down-regulated by HSYA and whose background expression values were >10 in the model group. However, among the miRNAs that were significantly upregulated after HSYA treatment, only one in the HG + ox-LDL + HSYA group had a background expression value of >10. According to the volcano map () and gene differential expression heatmap (), most miRNAs in the HUVECs were down-regulated after HSYA treatment HSYA mainly down-regulated most miRNAs in the HUVECs under stress induced by 33.3 mM d-glucose + 100 μg/mL ox-LDL. showed the top 10 down-regulated miRNAs with the largest fold-change values.
Figure 5. Screening of the miRNA-mRNA network mainly regulated by HSYA in the HUVECs induced by high glucose and high-fat treatment (A) Transcriptome analysis of a volcano plot for the distribution of the differentially expressed genes; (B) Differentially expressed genes for heatmap drawing; (C) the top 10 genes with significant differences in differentially expressed genes and the background value of treated genes >10; (D–G) qPCR was used to detect the relative expression levels of the miR-429 and SLC7A11 genes in each group in the animal and cell experiment group 1; (H) miR-429 and SLC7A11 3′-UTR gene target-binding site and mutation site sequence (red font is the target-binding site, the blue bottom panel shows the mutation sequence); (I) dual-luciferase activity test results; (J andK) the relative expression levels of the miR-429 and SLC7A11 genes were detected by qPCR. **p < 0.01, *p < 0.05, compared with the control group; ##p < 0.01, compared with the HG + ox-LDL group, the difference was statistically significant.
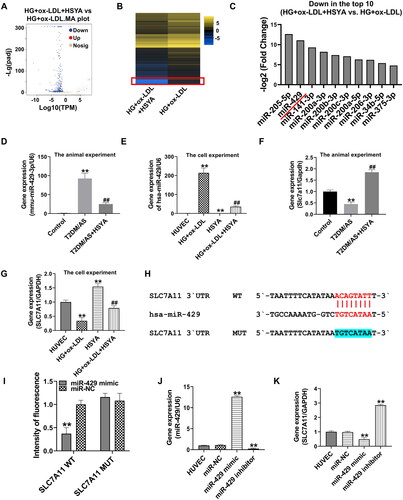
qPCR confirmed that the miR-429 gene was upregulated by 92× in the aorta of the T2DM/AS model group and that the expression level of the miR-429 gene was significantly inhibited after HSYA treatment (compared with that in the T2DM/AS group, p < 0.01, ). In the cell experiments, the miR-429 gene was upregulated by approximately 214× in HUVECs under stress induced by high glucose and ox-LDL; moreover, the miR-429 gene was significantly inhibited under the action of HSYA (compared with that in the HG + ox-LDL group, p < 0.05, ). The target prediction of the miR-429 and ferroptosis-related genes by ENCORI suggested that hsa-miR-429 has a potential target-binding effect on the SLC7A11 3′-UTR (human hsa-miR-429 and mouse mmu-miR-429-3p have a high degree of homology). In addition to performing qPCR, the expression level of the SLC7A11 gene was detected (). The SLC7A11 gene was significantly inhibited in the aortic tissue and HUVECs treated with HG + ox-LDL (compared with that in the control or HUVEC group, p < 0.01). However, after HSYA treatment, the expression level of the SLC7A11 gene was significantly upregulated (compared with that in the respective experimental HG + ox-LDL groups, p < 0.01). To verify the targeted-binding relationship between the miR-429 and SLC7A11, a mutant plasmid was constructed according to the targeted-binding site of miR-429 and SLC7A11 (see the blue highlighted part of the SLC7A11 mutation site in ), and this plasmid was used for the dual-luciferase activity experiment (). The fluorescence intensity was significantly inhibited after the co-transfection of the wild-type SLC7A11 3′-UTR plasmid and miR-429 mimic (compared with that in the SLC7A11 WT group transfected with miR-NC, p < 0.01), whereas the fluorescence intensity was not affected by the miR-429 mimic after the UTR was mutated with the miR-429 binding site. After the HUVECs were transfected with the miR-429 mimic, the miR-429 gene was significantly upregulated, whereas the SLC7A11 gene was significantly inhibited (compared with that in the HUVEC group, p < 0.01). These opposite results were obtained after the HUVECs were transfected with the miR-429 inhibitor.
HSYA protects HUVECs from ferroptosis via miR-429/SLC7A11
To further maintain the regulation of miR-429 by HSYA to target SLC7A11 expression, herein, we introduce the miR-429 mimic, miR-429 inhibitor, and si-SLC7A11 for function rescue. First, using RT-PCR, we proved that after the HUVECs were transfected with miR-429 inhibitor, the miR-429 gene level in the inhibitor group and the inhibitor + si-SLC7A11 group was significantly down-regulated (compared with that in the HG + ox-LDL group, p < 0.01); however, si-SLC7A11 transfection had no significant effect on miR-429 expression. After HSYA treatment, the miR-429 gene expression was also significantly inhibited (compared with that in the HG + ox-LDL group, p < 0.01), and transfection of the miR-429 mimic significantly reversed the inhibitory effect of HSYA on the miR-429 gene (). After the HUVECs were transfected with the miR-429 inhibitor, the SLC7A11 gene was significantly upregulated (compared with that in the HG + ox-LDL group, p < 0.01); however, it was significantly inhibited after co-transfection with si-SLC7A11 (compared with that in the inhibitor group, p < 0.01). Transfection of the miR-429 mimic or si-SLC7A11 significantly reversed the up-regulatory effect of HSYA on the SLC7A11 gene (compared with that in the HSYA group, p < 0.01, ).
Figure 6. HSYA protects HUVECs from Ferroptotic injury via miR-429/SLC7A11 (A and B) the relative expression levels of the miR-429 and SLC7A11 genes were detected by qPCR; C the cell viability was detected by MTT; D detection of the LDH content in the cell culture supernatant; (E and F) detection of GSH-Px enzyme activity and iron ion content in the cell lysate; (G–J) the protein expression levels of the ferroptosis-related proteins ACSL4, SLC7A11, and GPX4 in the cells were detected by western blotting, and the optical density values of protein bands were statistically quantified using ImageJ software. **p < 0.01, *p < 0.05, compared with the control group; ##p < 0.01, #p < 0.05, compared with the two groups connected by the line; the difference is statistically significant.
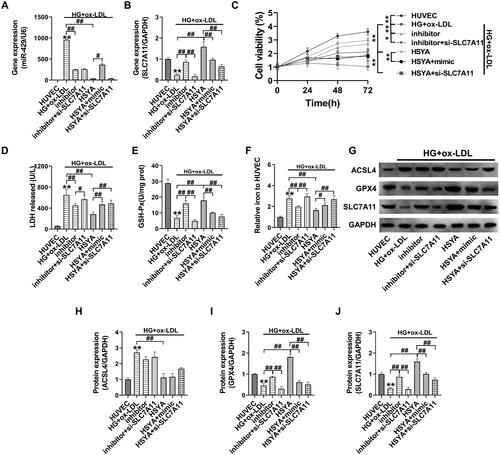
Subsequent results showed that transfection of the miR-429 inhibitor could significantly upregulate the activity of the HUVECs under high glucose + ox-LDL stress, down-regulate the LDH and iron ion contents, and upregulate the GSH-Px enzyme activity (compared with that in the HG + ox-LDL group, p < 0.01, ). Moreover, the ferroptosis-related proteins SLC7A11 and GPX4 were significantly upregulated after transfection with the miR-429 inhibitor (, compared with that in the HG + ox-LDL group, p < 0.01). The effect of the abovementioned miR-429 inhibitor was significantly reversed after co-transfection with si-SLC7A11 (inhibitor + si-SLC7A11 group compared with inhibitor group, p < 0.05). Transfection of the miR-429 mimic or si-SLC7A11 significantly reversed the up-regulation of HSYA on cell activity, upregulated the LDH and iron ion contents, and inhibited the GSH-Px enzyme activity and SLC7A11 and GPX4 protein expression (as compared with that in the HSYA group, p < 0.05). Transfection of the miR-429 inhibitor, miR-429 mimic, and si-SLC7A11 had no significant effects on the expression of the ACSL4 protein in the HUVECs.
Discussion
In this study, HSYA effectively reduced the formation of aortic atherosclerotic plaques in T2DM/AS model mice, and the expression of the atherosclerotic markers VCAM and ICAM was reduced. Based on the analysis of the pathological results, atherosclerotic plaques were obvious in the model group, and HSYA significantly reduced the formation of lipid plaques. HSYA effectively reduced oxidative stress and ferroptosis in aortic tissues. Ferroptosis is a type of cell death that is dependent on iron ions and the ROS-induced accumulation of large amounts of lipid peroxides. The massive production of ROS, far beyond the cell’s scavenging capacity, is the initiating factor. The system Xc- (SLC7A11)-GSH-GPX4 pathway is the main pathway currently known to regulate ferroptosis. SLC7A11, a major member of system Xc-, mediates the exchange of cystine and glutamate in a 1:1 ratio across the plasma membrane to synthesize glutathione (GSH). GSH is a tripeptide composed of glutamate, cysteine, and glycine and acts as an antioxidant and substrate for GPX4, which is then converted to oxidized glutathione peptide (GSSG), the major scavenger of intracellular ROS, depending on the redox capacity of GSH. Moreover, increasing GSH levels inhibit ferroptosis.
To further clarify the protective mechanisms of HSYA on ECs in the T2DM + AS model, we focused on the mechanisms of action of HUVECs. In the cell experiments, d-glucose and ox-LDL were used to simulate the T2DM + AS model. Regarding diabetes + AS cell model, Meng et al. (Citation2021) used d-glucose combined with palmitate for induction. However, elevated LDL-c levels are a significant risk factor for the development of AS. Compared with native LDL, Ox-LDL plays a more critical role in the occurrence and development of AS. Ox-LDL causes endothelial dysfunction, which leads to the expression of adhesion molecules and subendothelial monocyte recruitment (Mitra et al. Citation2011). Therefore, compared with palmitates, ox-LDL is more closely related to the occurrence of AS in vivo models. The cell experiments showed that HSYA could significantly improve the antioxidative stress and anti-ferroptosis effect of HUVEC cells under the condition of high glucose and fat. The results of the high-throughput transcriptome sequencing revealed that the miR-429 gene was significantly down-regulated in the HSYA-treated HUVECs. However, the miR-429 gene expression levels in the aortic tissue and HUVECs from the animal experiments were verified, and the results were consistent with the transcriptome data. Thus, the miR-429 gene may be a key miRNA for the HSYA treatment of T2DM + AS.
Studies have shown that the miR-429 gene is significantly upregulated in the atherosclerotic ApoE-/- mice and the down-regulated anti-apoptotic gene Bcl-2 induces EC apoptosis (Zhang T et al. Citation2015). Elevated miR-429 expression was identified as a danger sign indicating diabetes (Yu et al. Citation2016; Wei et al. Citation2021). Although the regulation of ferroptosis by miR-429 has not yet been studied, the targeted binding of the ferroptosis-related genes SLC7A11, GPX4, and ACSL4 to miR-429 has been predicted. Genes are potentially targeted binding sites. Then, when combined with a dual-luciferase reporter assay and miR-429 mimic transfection, the miR-429 inhibitor preliminarily confirmed the targeting-binding relationship between the SLC7A11 3′–UTR and hsa-miR-429 gene. The miR-429 overexpression can inhibit SLC7A11 gene expression, whereas inhibiting miR-429 results in the opposite results.
Next, the HUVECs were transfected with SLC7A11 siRNA, miR-429 mimic, and miR-429 inhibitor. The results showed that the inhibition of the viability of HUVECs, oxidative stress injury, and induction of ferroptosis induced by high glucose and high fat were reversed upon treatment with HSYA. Meanwhile, the transfection of SLC7A11 siRNA or miR-429 mimic significantly attenuated the therapeutic effects of HSYA. However, based on the protein level analysis results, the cells transfected with SLC7A11 siRNA, miR-429 mimic, and miR-429 inhibitor exerted regulatory effects on the SLC7A11 and GPX4 proteins; however, no significant changes in the regulation of the ACSL4 protein were observed. This may function as the ferroptosis-promoting pathway of ACSL4, and the SLC7A11/GPX4 glutathione metabolic pathway may not be the same [ACSL4 plays a significant role in lipid peroxide synthesis in ferroptosis (Killion et al. Citation2018; Sha et al. Citation2021)]. However, HSYA can simultaneously regulate the SLC7A11/GPX4/ACSL4 protein expression, indicating that HSYA may play an essential role in resisting ferroptosis through the miR-429/SLC7A11 axis; HSYA may also play a protective role through other pathways (Sha et al. Citation2021).
This study also has some shortcomings; it only analyzed the transcriptome of HSYA and HUVECs; however, the formation of AS usually involves a wide range of cells, such AS macrophages and vascular smooth muscle cells. The mechanism of HSYA against T2DM/AS revealed in this study is only the tip of the iceberg. Generally, mRNAs radiated by miRNA are extensive. Therefore, whether the effects of HSYA on miR-429 affect the T2DM/AS process or the protection of HUVEC cells through other pathways still needs to be studied in further detail.
Conclusions
In this study, animal and cell experiments were conducted to demonstrate the therapeutic effect of HSYA on T2DM/AS by inhibiting ferroptosis. The regulatory effect of HSYA on the miR-429/SLC7A11-ferroptosis pathway is reported for the first time, which provides a new therapeutic option for T2DM/AS prevention and treatment.
Disclosure statement
No potential conflict of interest was reported by the author(s).
Additional information
Funding
References
- Ali MK, Pearson-Stuttard J, Selvin E, Gregg EW. 2022. Interpreting global trends in type 2 diabetes complications and mortality. Diabetologia. 65(1):3–13. doi: 10.1007/s00125-021-05585-2.
- Bai T, Li M, Liu Y, Qiao Z, Wang Z. 2020. Inhibition of ferroptosis alleviates atherosclerosis through attenuating lipid peroxidation and endothelial dysfunction in mouse aortic endothelial cell. Free Radic Biol Med. 160:92–102. doi: 10.1016/j.freeradbiomed.2020.07.026.
- Chen G, Li C, Zhang L, Yang J, Meng H, Wan H, He Y. 2022. Hydroxysafflor yellow A and anhydrosafflor yellow B alleviate ferroptosis and parthanatos in PC12 cells injured by OGD/R. Free Radic Biol Med. 179:1–10. doi: 10.1016/j.freeradbiomed.2021.12.262.
- Gezici S, Sekeroglu N. 2017. Regulation of microRNAs by natural products and bioactive compounds obtained from common medicinal plants: novel strategy in cancer therapy. IJPER. 51(3s2):s483–s488. doi: 10.5530/ijper.51.3s.71.
- Ji DB, Zhang LY, Li CL, Ye J, Zhu HB. 2009. Effect of hydroxysafflor yellow A on human umbilical vein endothelial cells under hypoxia. Vascul Pharmacol. 50(3-4):137–145. doi: 10.1016/j.vph.2008.11.009.
- Killion EA, Reeves AR, El Azzouny MA, Yan QW, Surujon D, Griffin JD, Bowman TA, Wang C, Matthan NR, Klett EL, et al. 2018. A role for long-chain acyl-CoA synthetase-4 (ACSL4) in diet-induced phospholipid remodeling and obesity-associated adipocyte dysfunction. Mol Metab. 9:43–56. doi: 10.1016/j.molmet.2018.01.012.
- La Sala L, Prattichizzo F, Ceriello A. 2019. The link between diabetes and atherosclerosis. Eur J Prev Cardiol. 26(2_suppl):15–24. doi: 10.1177/2047487319878373.
- Leng W, Ouyang X, Lei X, Wu M, Chen L, Wu Q, Deng W, Liang Z. 2016. The SGLT-2 inhibitor dapagliflozin has a therapeutic effect on atherosclerosis in diabetic ApoE-/- Mice. Mediators Inflamm.2016:6305735. doi: 10.1155/2016/6305735.
- Li Y, Tian L, Sun D, Yin D. 2019. Curcumin ameliorates atherosclerosis through upregulation of miR-126. J Cell Physiol. 234(11):21049–21059. doi: 10.1002/jcp.28708.
- Liu SX, Zhang Y, Wang YF, Li XC, Xiang MX, Bian C, Chen P. 2012. Upregulation of heme oxygenase-1 expression by hydroxysafflor yellow A conferring protection from anoxia/reoxygenation-induced apoptosis in H9c2 cardiomyocytes. Int J Cardiol. 160(2):95–101. doi: 10.1016/j.ijcard.2011.03.033.
- Luo EF, Li HX, Qin YH, Qiao Y, Yan GL, Yao YY, Li LQ, Hou JT, Tang CC, Wang D. 2021. Role of ferroptosis in the process of diabetes-induced endothelial dysfunction. World J Diabetes. 12(2):124–137. doi: 10.4239/wjd.v12.i2.124.
- Ma Y, Feng C, Wang J, Chen Z, Wei P, Fan A, Wang X, Yu X, Ge D, Xie H, et al. 2019. Hydroxyl safflower yellow A regulates the tumor immune microenvironment to produce an anticancer effect in a mouse model of hepatocellular carcinoma. Oncol Lett. 17(3):3503–3510. doi: 10.3892/ol.2019.9946.
- Meng Z, Liang H, Zhao J, Gao J, Liu C, Ma X, Liu J, Liang B, Jiao X, Cao J, et al. 2021. HMOX1 upregulation promotes ferroptosis in diabetic atherosclerosis. Life Sci. 284:119935. doi: 10.1016/j.lfs.2021.119935.
- Mitra S, Goyal T, Mehta JL. 2011. Oxidized LDL, LOX-1 and atherosclerosis. Cardiovasc Drugs Ther. 25(5):419–429. doi: 10.1007/s10557-011-6341-5.
- Moss JW, Ramji DP. 2016. Cytokines: roles in atherosclerosis disease progression and potential therapeutic targets. Future Med Chem. 8(11):1317–1330. doi: 10.4155/fmc-2016-0072.
- Ouyang S, You J, Zhi C, Li P, Lin X, Tan X, Ma W, Li L, Xie W. 2021. Ferroptosis: the potential value target in atherosclerosis. Cell Death Dis. 12(8):782–791. doi: 10.1038/s41419-021-04054-3.
- Sha W, Hu F, Xi Y, Chu Y, Bu S. 2021. Mechanism of ferroptosis and its role in Type 2 Diabetes Mellitus. J Diabetes Res. 2021:9999612. doi: 10.1155/2021/9999612.
- Vinchi F, Porto G, Simmelbauer A, Altamura S, Passos ST, Garbowski M, Silva AMN, Spaich S, Seide SE, Sparla R, et al. 2020. Atherosclerosis is aggravated by iron overload and ameliorated by dietary and pharmacological iron restriction. Eur Heart J. 41(28):2681–2695. doi: 10.1093/eurheartj/ehz112.
- Wei L, Cao C, Ma X, Wang X, Wang M, Zhang P. 2021. Elevated serum and urine MiR-429 contributes to the progression of gestational diabetes mellitus. Clin Lab. 67(5). doi: 10.7754/Clin.Lab.2020.200909.
- Xie Y, Guo Y, Cao S, Xue M, Fan Z, Gao C, Jin B. 2020. Hydroxysafflor yellow A attenuates hydrogen peroxide-induced oxidative damage on human umbilical vein endothelial cells. Evid Based Complement Alternat Med. 2020:8214128. doi: 10.1155/2020/8214128.
- Xu F, Wang N, Li G, Guo W, Yang C, Liu D. 2017. Establishment and assessment of mice models of type 2 diabetes mellitus. Zhongguo Yi Xue Ke Xue Yuan Xue Bao. 39:324–329.
- Xu XH, Ding DF, Yong HJ, Dong CL, You N, Ye XL, Pan ML, Ma JH, You Q, Lu YB. 2017. Resveratrol transcriptionally regulates miRNA-18a-5p expression ameliorating diabetic nephropathy via increasing autophagy. Eur Rev Med Pharmacol Sci. 21(21):4952–4965.
- Yang K, Song H, Yin D. 2021. PDSS2 inhibits the ferroptosis of vascular endothelial cells in atherosclerosis by activating Nrf2. J Cardiovasc Pharmacol. 77(6):767–776. doi: 10.1097/FJC.0000000000001030.
- You L, Fang Z, Shen G, Wang Q, He Y, Ye S, Wang L, Hu M, Lin Y, Liu M, et al. 2019. Astragaloside IV prevents high glucose-induced cell apoptosis and inflammatory reactions through inhibition of the JNK pathway in human umbilical vein endothelial cells. Mol Med Rep. 19:1603–1612.
- Yu T, Lu XJ, Li JY, Shan TD, Huang CZ, Ouyang H, Yang HS, Xu JH, Zhong W, Xia ZS, et al. 2016. Overexpression of miR-429 impairs intestinal barrier function in diabetic mice by down-regulating occludin expression. Cell Tissue Res. 366(2):341–352. doi: 10.1007/s00441-016-2435-5.
- Zhang S, Guo S, Gao XB, Liu A, Jiang W, Chen X, Yang P, Liu LN, Shi L, Zhang Y. 2019. Matrine attenuates high-fat diet-induced in vivo and ox-LDL-induced in vitro vascular injury by regulating the PKCα/eNOS and PI3K/Akt/eNOS pathways. J Cell Mol Med. 23(4):2731–2743. doi: 10.1111/jcmm.14180.
- Zhang T, Tian F, Wang J, Jing J, Zhou SS, Chen YD. 2015. Atherosclerosis-associated endothelial cell apoptosis by miR-429-mediated down regulation of Bcl-2. Cell Physiol Biochem. 37(4):1421–1430. doi: 10.1159/000438511.