
ABSTRACT
Debate persists on light in controlled environment agriculture. To dissect the effects of conventionally used wavelengths on a crop and provide new information to this expanding food production sector, this study investigated the effects of monochromatic and combined red, blue, and amber light on lettuce growth with increasing light intensities (up to 1300 µmol·m−2·sec−1) for 18 days with a 16 h·d−1. Under amber light at PPFDs ranging from 500 to 700 µmol·m−2·sec−1, fresh mass displayed a 33.3% greater yield when compared to red light at the same PPFD. Suppressed growth was observed with either red or amber alone at high PPFD (>800 µmol·m−2·sec−1). Blue light was the least productive of the four treatments, yet lettuce plant growth was not suppressed at high intensities. No growth suppression was observed for lettuce plants grown under combined red-blue-amber light at high intensities, and these plants exhibited greater biomass yield than blue light alone. Varied degrees of pigmentation occurred under each light treatment, yet bleaching was only observed in plants grown under amber light alone at PPFD above 1000 µmol·m−2·sec−1. Findings present novel plant responses to high intensity light, setting precedence for future experiments aimed at expanding the use of LEDs in horticulture.
Introduction
Light wavelength and intensity are primary factors that contribute to plant growth and development because of their fundamental impact on photosynthetic performance (Fan et al., Citation2013; Hernández & Kubota, Citation2013; Long et al., Citation1994). The use of supplemental lighting is widespread in the horticultural industry to ensure maximum plant productivity (Liu, Citation2012; Singh et al., Citation2015), and the most conventional supplemental lighting systems are high pressure sodium (HPS) lamps and light emitting diodes (LEDs). HPS have an output peak in the amber wavelength range (590–620 nm) and deficient emission peaks in the blue and red spectra (Mitchell et al., Citation2015; Nelson et al., Citation2014). Since the early 1990s, pilot experiments with LEDs have demonstrated their potential for optimal plant growth and development (Bula et al., Citation1991; Yorio et al., Citation2001). LEDs offer monochromatic light with different peak wavelengths (Gomez et al., Citation2013; Goto, Citation2003; Wheeler, Citation2008).
HPS lamps are often used as sole-source lighting (Bergstrand & Schüssler, Citation2013; Moe, Citation1994; Van Ieperen & Trouwborst, Citation2007). They offer sufficient light intensity over large plant-growing areas and increase greenhouse temperature, which is favourable in colder climates (Brault et al., Citation1989; Gomez et al., Citation2013; Nelson et al., Citation2014). HPS lamps are economically viable because they are a mass-produced light source used in many other industries (Gomez et al., Citation2013). HPS lamps have some critical drawbacks including high heat emission (>200°C), which limits lamp proximity to plants and high intensity light growth conditions (Brault et al., Citation1989). Greenhouse growers have started using LED lighting systems, as light intensity can be controlled, and they exhibit promising capabilities with respect to low heat emission and high efficiency (Massa et al., Citation2008; Morrow, Citation2008).
LED lighting positively influences plant growth (Mitchell, Citation2015; Olle & Viršile, Citation2013; Singh et al., Citation2015; Yeh & Chung, Citation2009). Some of the first LEDs deployed in horticulture research were in the red spectrum (600–660 nm) (Bula et al., Citation1991; Mitchell et al., Citation2015), and numerous early studies have examined the effects of red to far-red (700 to 800 nm) LEDs, in conjunction with low intensity blue (400 to 500 nm) and green light (500 to 600 nm) on plant growth (Brown et al., Citation1995; Goins et al., Citation1997; Kim et al., Citation2004; Morrow, Citation2008). Subsequently, LEDs are available in a variety of wavebands ranging from ultraviolet B (>280 nm) to the near-infrared range (~1000 nm), many of which are useful in horticulture (Mitchell et al., Citation2015; Olle & Viršile, Citation2013). With ongoing and rapidly progressing technical advances made to LED efficiencies and availability, growers now have greater control over light wavelengths and intensity for crops (Bula et al., Citation1991; Gomez et al., Citation2013; Haitz & Tsao, Citation2011; Morrow, Citation2008; Stutte, Citation2009; Tennessen et al., Citation1994). To date, horticultural LED research has primarily focused on the effect of red: blue light ratios, with supplemental far-red radiation on plant growth (Deram et al., Citation2014; Fan et al., Citation2013; Martineau et al., Citation2012; Son & Oh, Citation2013).
It is important to note that the effects of particular LED wavelengths and light intensities on plant growth change according to plant species and growth stages (Mickens et al., Citation2018; Olle & Viršile, Citation2013). Additionally, many existing studies have involved light treatments with different red and blue LED ratios conducted at fixed intensities, known as photosynthetic photon flux densities (PPFDs) (Son & Oh, Citation2013; Wang et al., Citation2016; Yang et al., Citation2011). Other studies have considered fixed wavelength ratios with different PPFD (Elkins & van Iersel, Citation2020; Modarelli et al., Citation2022). However, PPFD output rarely surpasses 550 µmol·m−2·sec−1, likely because photosystem saturation occurs and the operational costs associated with electrical lighting are high (Avercheva et al., Citation2014; Baias et al., Citation2013; Erwin & Gesick, Citation2017). Light intensities from HPS lamps, LEDs, or a combination thereof, beyond a PPFD of 1000 µmol·m−2·sec−1, have seldom been reported in the literature for plant growth experimentation. Research studies with lettuce have mainly investigated the effect of light intensity mainly between 100 and 600 μmol m−2 sec−1, although a handful have examined high-intensity light (>700 μmol m−2 sec−1) (Esmaili et al., Citation2020, Citation2021). Under these various scenarios, the optimal light configurations observed only represent partial light optimisation, in terms of either ratios or PPFD.
The objective of the present study was to evaluate the effects of monochromatic red (635 nm), blue (445 nm), and phosphor-converted amber (595 nm) light, and a combined red-blue-amber (RBA) light treatment on romaine lettuce (Lactuca sativa cultivar Breen) growth, with a customised LED system capable of supplying a maximum of ~1300 µmol·m−2·sec−1 under two light configurations: (1) monochromatic wavelengths with different PPFDs, and (2) combined RBA wavelengths, with different ratios and PPFDs. Romaine lettuce was used as a model plant, as this leafy green is widely consumed for its mild flavour, crispness, and high nutritional content (Weber, Citation2016). Biomass yield (fresh and dry mass), morphology (total leaf area, leaf shape, and leaf colour), and Soil Plant Analysis Development (SPAD) values were recorded and analysed for all light treatments.
Materials and methods
Plant materials and custom-built hydroponic system
All experiments were conducted at McGill University’s Macdonald Campus in the Research Phytorium (Sainte-Anne-de-Bellevue, QC, Canada). Lettuce (L. sativa cultivar Breen; pelleted MT0 OG, Johnny’s Selected Seeds, Winslow, ME, US) seeds were germinated in rockwool cubes (25 mm × 25 mm × 30 mm; Grodan A/S, Dk-2640, Hedehusene, Denmark) in germination trays (0.28 m × 0.54 m; Mondi Products, Vancouver, BC, Canada) filled with 2 L half-strength Hoagland’s solution (Hoagland & Arnon, Citation1950), comprising nitrogen, phosphorus, potassium, calcium, magnesium, sulphur, iron, manganese, zinc, boron, copper, and molybdenum with concentrations (in mg L−1) of 110, 15, 115, 100, 24, 32, 0.5, 0.25, 0.025, 0.05, 0.007, and 0.05, respectively. Seeds were germinated in a growth chamber (TC30, Conviron Controlled Environment Ltd, Winnipeg, MB, Canada) under a photosynthetic photon flux density (PPFD) of 120–150 µmol·m−2·sec−1 supplied by cool white fluorescent lamps (4200 K, F72T8CW OSRAM Sylvania Inc., Wilmington, MA, US), with a photoperiod of 16 h·d−1. The chamber’s environment was maintained at 23/21 ± 1°C (day/night) and 50 ± 10% relative humidity. The nutrient solution was replaced every second day.
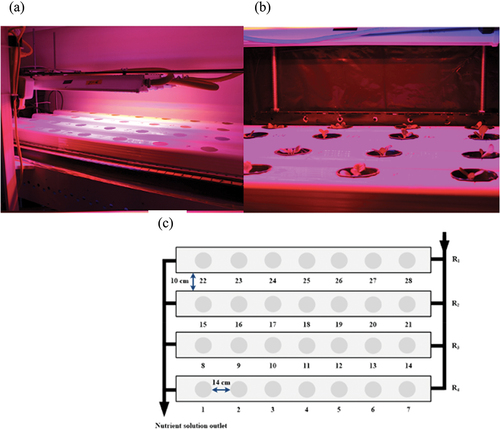
Two weeks after seeding, when the lettuce plants had developed their first two true leaves (4–6 mm in length), plants were transplanted into an adjacent growth chamber equipped with a nutrient loop system and the experimental LED lighting systems (). A thin film nutrient loop system consisted of four hydroponic channels (0.10 m × 1.27 m) installed 0.10 m apart (). Each channel provided room for seven plants, spaced 0.15 m apart (from centre to centre). A continuous recirculation closed nutrient loop system was used as reported previously (Cooper, Citation1979), to keep roots in contact with the solution. This ensured good oxygenation of the roots and adequate supply of nutrients for the plants. An air pump (Marina 200, Rolf C. Hagen Inc., Baie d’Urfé, QC, Canada) provided oxygenation to the nutrient solution. The nutrient solution from each channel was collected in the nutrient solution drainage outlet that was connected to the nutrient solution tank. The nutrient solution was pumped into the inlets from containers using submersible pumps (Aquak-ingdom SP1200 submersible pump, Guangdong, China). Fresh full-strength Hoagland’s solution was provided and replaced every 9 days with a fresh 50-L nutrient solution tank. It was pumped into the hydroponic channels every hour for 1 min during day-time hours. The air pump (Elite 802 and Marina 200, Rolf C. Hagen, QC, Canada) provided atmospheric air to the nutrient solution. The pH (Oakton waterproof pH tester 30, EuTech Instruments, Vernon Hills, IL, US) and electrical conductivity (EC) (combo EC metre, Hanna instruments, Ann Arbor, MI, US) of the nutrient solutions were maintained at 5.94 ± 0.4 and 1.38 ± 0.09 dS m−1, respectively. The environmental conditions in both growth chambers were set to 50 ± 10% relative humidity, and an air temperature of 23/21 ± 1°C (day/night). Environmental conditions, EC, and pH measurements were taken every week and were maintained between replications.
Figure 1. (a) Diagram of the experimental setup, (b) the diagram of the experimental setup with the combination of red, blue, and amber lights and (c) the closed thin film nutrient loop system hydroponic system.
LED system design and light treatments
Average PPFD from three replications of monochromatic red (635 nm), blue (445 nm), and amber (595 nm) light systems, as well as combined red-blue-amber light are presented in . The combined red-blue-amber spectrum with increasing red light was used to investigate if red light could override the effect of blue and amber light. The LED system included a frame (1.27 m × 0.75 m × 0.60 m; length, width, and height, respectively) that allowed for secure and adjustable positions of the four LED bars to obtain desired PPFD for each light treatment. Each LED bar (LED Innovation Design, Laval, QC, Canada) was equipped with 200 diodes with nominal wavelengths of 447 mm, 590 mm, and 633 nm for blue, amber, and red light, respectively, as reported by the manufacturer (Philips-Lumileds, San José, CA). Spectral distribution measurements were performed using a spectroradiometer (PS-300, Apogee instruments Inc., Logan, UT, US), revealing that the centroid wavelengths were 445 nm, 595 nm, and 635 nm for blue, amber, and red light, respectively (). Centroid wavelength measurements were completed twice throughout the experiment, and amber diodes provided a wide output spectrum in comparison to the red and blue diodes, showing a skewed output towards the red spectrum ().
Figure 2. Relative spectral distributions exhibited by the experimental red (635 nm), blue (445 nm), and amber (595 nm) LEDs.
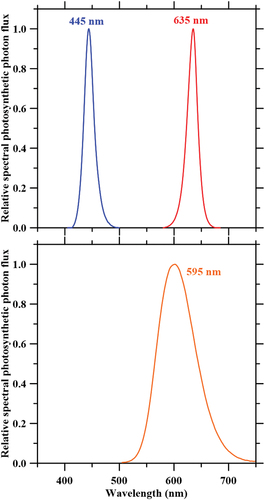
Table 1. Photosynthetic photon flux density (PPFD) and full width at half maximum (FWHM) measurements recorded for each LED light treatment.
A water-cooling circulation system (M4100C, Isotemp cooling circulator, Thermo Fisher Scientifics, Waltham, MA, US) was used to regulate the temperature of the LED bars to 10°C with a mixture of water and glycol (1:3 ratio). The LED bars were able to provide a PPFD of up to 1300 µmol·m−2·sec−1 for each of the three wavelengths alone, or in combined red-blue-amber light ratios, with a distance of 0.25 m from the diodes to the hydroponic channels. Selection of specific red and blue wavelengths was based on typical wavelengths currently used for LED lighting in horticulture. The amber LEDs were selected for their ability to supply high PPFD in the amber light spectrum (). The combined RBA light treatment was included in the experiment to emulate the HPS lighting spectrum with an LED system.
PPFD delivered by each LED bar was controlled by a current control box and Tera-Term pro 2.3 software (Ayera Technologies Inc., Modesto, CA, US). LED bars were spaced 0.10 m apart and placed 0.25 m above the hydroponic channels. PPFD measurements at each plant location were performed using a light metre (LI-250A; LI-COR Inc., Lincoln, NE, US) with an underwater quantum sensor (LI-192, LI-COR Inc.) (Deram et al., Citation2014). Prior to taking PPFD measurements, the LED bars and the cooling circulator were switched on and stabilised for 5 min. PPFD measurements were taken at the beginning and end of each treatment replication to confirm a constant PPFD (). Each measurement was repeated three times.
Experimental setup
A custom-built experimental LED system was installed in a growth chamber (TC30, Conviron Controlled Environment Ltd) to investigate different wavelengths consisting of red (635 nm), blue light (445 nm), amber light (595 nm), and the combination of red-blue-amber (RBA) on lettuce growth. Light mapping was conducted before starting the experiment, and the lights in the growth chamber were switched off to ensure that the plant growth parameters assessed were due to the different light treatments. Each plant location was additionally light mapped (at the beginning, middle, and end of each replicate) to determine the irradiance level that each plant (location) received during each replicate and ranged from ~ 33 to 1392 µmol m−2 sec−1, dependent on light wavelength and plant location. Each plant per experimental light treatment was subjected to each experimental treatment with a 16 h d−1 photoperiod for 18 days. The PPFD level was measured using a light metre (LI-250A; LI-COR Inc., Lincoln, NE, US) with an underwater quantum sensor (LI-192, LI-COR Inc., Lincoln, NE, US). To ensure each plant received consistent PPFD throughout their growth and between each replicate, the PPFD level at each plant location was determined at the beginning of the experimental run, the end of the experimental run, and once in between using the aforementioned light metre with an underwater quantum sensor. As the light distribution of the LED lights varied along the bar, the irradiance footprint of the light systems was used to establish the different PPFDs used for the study and the response curve. During replications, the lamps were repositioned to create a random variability of the irradiance level of each growth position to attempt to minimise location effect.
Plant growth (post-harvest) parameters and indices
After harvesting, plant fresh mass (FM) and dry mass (DM) were measured using a balance (APX-153, Denver Instruments, Bohemia, NY, US). To obtain DM, plants were stored at 4°C for 12 h then transferred to a freeze drier (Christ Gamma 1–16 LSC, Shropshire, UK) for 48 h. To verify dryness, plants were weighed after 48 h, and again after another 12 h, to ensure a < 1% change. Leaf shape responses to each light treatment were measured using leaves harvested at day 18 from individual plants. Leaf length (LL) and leaf width (LW) were determined using a digital Vernier calliper (Mitutoyo 500, Mitutoyo Canada Inc. Mississauga, ON, Canada). Leaf shape indices (LSI) were calculated by dividing LL by LW for each light treatment (Son & Oh, Citation2013). The average LSI of each plant was plotted against the PPFD received by each individual plant. Leaves from individual plants were separated on day 18 and the total leaf area (TLA) was measured (LI-COR 3100 Leaf Area Metre; LI-COR Inc., Lincoln, NE, USA). Chlorophyll content measurements were taken at the centre of the leaf, off the mid vein of the second fully expanded leaf of each plant using a SPAD metre (Chlorophyll Metre SPAD-502Plus, Konica Minolta, Sakai, Osaka, Japan). Individual plants grown under each different light treatment and PPFD were photographed to observe colour and morphology (Canon t4i, Tokyo, Japan).
Statistical analysis
The experimental setup consisted of 28 plants for each light treatment (amber, red, blue, and RBA) corresponding to the 28 light intensities. Each light treatment with the varying light intensities was replicated three times. Results are presented by means of three replicates. The four experimental light treatments were not performed at the same time; light treatments were conducted consecutively. Data were subjected to variance analyses and principal component analyses (PCA) using RStudio version 1.1.383 software (RStudio, Inc., Boston, MA, US). Polynomial and exponential regression methods were used to model the expected value of a dependent variable with respect to an independent variable. Tukey’s honest significant difference (HSD) test was used for multiple comparisons between spectral treatments, and mean values were obtained with significant one-way analysis of variance (ANOVA) tests (α < 0.05, unless otherwise stated).
Results
Lettuce plant fresh and dry mass yield
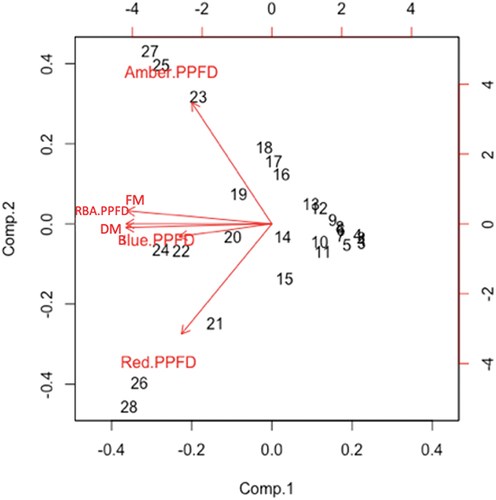
PCA were used to examine the effects of the RBA light treatment on lettuce plant growth under the full range of PPFD (39–1321 µmol·m−2·sec−1). It was determined that FM and DM were both closely related to the total RBA PPFD (regardless of ratio) and to the blue light PPFD (). Although not closely related in the PCA, red and amber light PPFD had positive yet divergent effects on FM and DM. This was demonstrated visually by curve fitting analysis that both red and amber light treatments had suppressive effects on FM and DM beyond 660 and 732 µmol·m−2·sec−1, respectively. Curve fitting analysis of FM and DM under blue light did not show suppression of FM and DM; rather, it showed a steadily increasing effect beyond 150 µmol·m−2·sec−1. With the RBA treatment only, the PPFD supplied by the blue diodes never surpassed 325.1 µmol·m−2·sec−1, while the red and amber diodes supplied well beyond these values, as high as 1000 µmol·m−2·sec−1. While suppression of FM and DM was observed under red and amber light alone at high PPFD, no FM or DM suppression occurred when blue light was present at higher RBA PPFD.
Figure 3. PCA eigenvectors for lettuce plants grown under red light (635 nm), blue light (445 nm), amber light (595 nm), combined red-blue-amber light (RBA) light treatments with full range of photosynthetic photon flux densities (PPFD; 39 to 1321 µmol·m−2·sec−1). Red light, blue light, amber light, combined red-blue-amber light, and PPFD were considered in relation to fresh mass (FM) and dry mass (DM). Numbers (1–28) on the graph represent the data points (light treatments) used in the study.
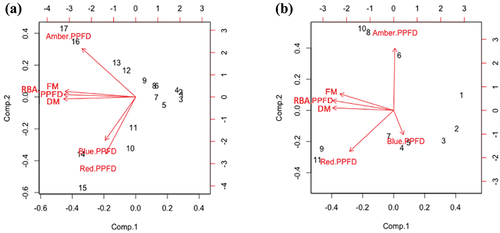
Further PCA was performed to examine the specific effects of lower intensity (39 to 441 µmol·m−2·sec−1) and higher intensity (511 to 1321 µmol·m−2·sec−1) light on FM and DM yield. Within lower intensity range, the FM and DM of lettuce plants were still closely related to total RBA PPFD (regardless of ratio), but the blue light PPFD shifted away from the close relationship seen under the full PPFD range, now showing a mutual relationship with red light PPFD (). The effect of amber light on biomass remained positive but divergent to both red and blue light PPFD. For the higher intensity range, FM and DM were closely related to total RBA PPFD (regardless of ratio). Within this higher range, FM and DM were negatively related to blue light PPFD (). It is important to note, however, that this relationship did not have an overall negative effect on FM and DM. Amber and red light PPFD were again divergent. In the PCA graph, the amber light PPFD eigenvector shifted further away from FM and DM, suggesting a suppressive effect in the higher RBA PPFD range.
Figure 4. PCA eigenvectors for lettuce plants grown under red light (635 nm), blue light (445 nm), amber light (595 nm), combined red-blue-amber light (RBA) light treatments with (a) a lower light intensity range (39 to 441 µmol·m−2·sec−1) and (b) a higher light intensity range (511 to 1321 µmol·m−2·sec−1) of photosynthetic photon flux densities (PPFDs). Red light, blue light, amber light, combined RBA light, and PPFD were considered in relation to fresh mass (FM) and dry mass (DM). Numbers (1–28) on the graph represent the data points (light treatments) used in the study.
Light intensity (PPFD) and wavelength significantly (p < 0.05) affected FM and DM of the light-treated lettuce plants. Significant differences (p < 0.05) were observed for FM and DM between the four light treatments. However, the interaction effect of PPFD and wavelength on FM and DM was not considered significant (p = 0.0569). Results showed that plants treated with amber light resulted in a significantly (p < 0.05) greater FM and DM when compared to red, blue, or RBA light treatments. There were no significant differences (p < 0.05) between FM and DM yields for blue, red, and RBA light treatments. The RBA light treatment had varied ratios of blue, red, and amber light throughout the range of PPFDs (39–1321 µmol·m−2·sec−1) tested. Ratios were normalised to the amber light for analysis. A two-way ANOVA was used to investigate the importance of the red or blue light treatments, or the interactive effects of both wavelengths on the FM and DM yield of lettuce plants. Red ratios in the RBA light treatment group were associated with significantly different FM and DM. Blue ratios did not significantly alter FM or DM (p = 0.5135 and 0.5018, respectively), and the interactive effect of the red and blue light was not considered significant (p = 0.0896).
Lettuce plants were grown under different light treatments with increasing PPFD ( and ). Significant (p < 0.05) differences in FM and DM yield were observed for the four different light treatments. Although the FM and DM were significantly higher when plants were grown under amber light compared to the other light treatments, results showed an exponential increase in FM and DM yield for plants cultivated under amber and red lights up to 700 µmol·m−2·sec−1. No significant differences were observed for measured FM and DM of plants subjected to blue light, and RBA light treatments. The highest FM (39.6 g) and DM (2.7 g) were recorded under amber light at 695 µmol·m−2·sec−1. The effects of red and amber light treatment on FM and DM over the full PPFD range showed quadratic relationships, with R2 = 0.96 and 0.85, respectively. FM and DM increased rapidly with increasing PPFD, levelled out at mid-range PPFD, and severely decreased at high PPFDs. FM and DM of lettuce plants grown under blue and RBA light treatments over the full PPFD range were fitted to a power regression curve, with R2 = 0.96 and 0.94, respectively. Both FM and DM yields increased rapidly with increasing PPFD, and they were never suppressed in the higher PPFD range (>1000 µmol·m−2·sec−1).
Figure 5. Effects of photosynthetic photon flux density (PPFD) on lettuce plant fresh mass (FM) yield when grown under red (635 nm), blue (445 nm), amber (595 nm), and combined red-blue-amber (RBA) LEDs. The daily light integral (DLI) was calculated based on the 16-h photoperiod used in this study.
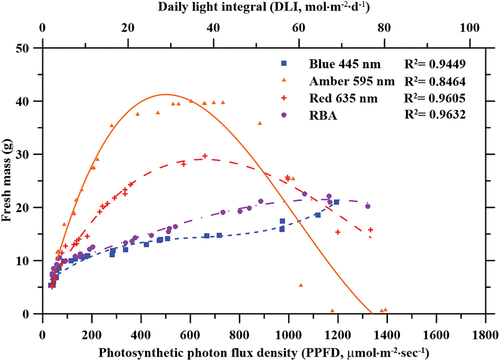
Figure 6. Effects of photosynthetic photon flux density (PPFD) on lettuce plant dry mass (DM) yield when grown under blue (445 nm), amber (595 nm), red (635 nm), and combined red-blue-amber (RBA) LEDs. The daily light integral (DLI) was calculated based on the 16-h photoperiod used in this study.
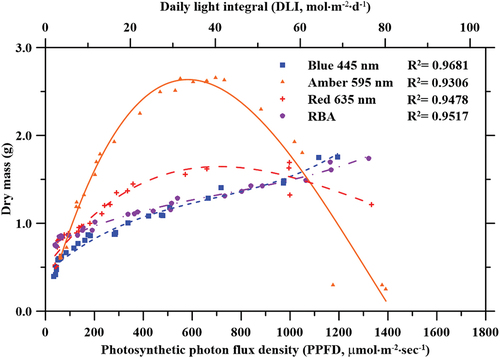
The FM of lettuce plants grown under amber light alone increased with PPFD ranging from 59 to 530 µmol·m−2·sec−1. Similar observation was made for the DM for the same plants. No differences were observed with amber light between 281 and 882 µmol·m−2·sec−1 for FM, and 552 and 732 µmol·m−2·sec−1 for DM. Decreased FM was observed at PPFD over 1000 µmol·m−2·sec−1, and decreased DM was observed when PPFD ranged between 882 and 1050 µmol·m−2·sec−1. Little growth was observed for plants grown under amber light with PPFD above 1100 µmol·m−2·sec−1. These data were fitted to quadratic curves (R2 = 0.85 and 0.93, for FM and DM, respectively) depicted in . Under amber light at PPFDs ranging from 500 to 700 µmol·m−2·sec−1, FM was 33.3% larger when compared to red light at the same PPFD. The FM yield of lettuce plants grown under red light exponentially increased with increasing PPFD up to 660 µmol·m−2·sec−1. Although the largest FM yield was observed at 660 µmol·m−2·sec−1, there were no significant difference between the FM for plants treated with red light under the intensity of 660–997 µmol·m−2·sec−1. The largest FM measurements ranged from 19.2 g to 29.7 g at PPFDs between 231 and 997 µmol·m−2·sec−1. PPFDs between 39 and 182 µmol·m−2·sec−1 and greater than 1000 µmol·m−2·sec−1 resulted in less FM. The DM of lettuce grown under red light significantly increased when PPFD ranged from 39 to 997 µmol·m−2·sec−1 but decreased when PPFD exceeded 1000 µmol·m−2·sec−1. The resulting trend was fitted to a quadratic curve (R2 = 0.96) depicted in .
The FM and DM of lettuce plants grown under blue light alone showed an initial rapid increase as PPFD increased. This was followed by a slower and consistent increase at higher PPFD. However, the FM of lettuce plants grown under blue light alone was lowest when compared to all other light treatments, and the largest plant weighed 21.0 g. Contrarily, the resulting DM of the same lettuce plants surpassed the DM of lettuce plants grown under red and RBA light treatments; the greatest DM recorded for these plants was 1.75 g. These FM and DM data were fitted to a power regression curve (R2 = 0.96). Unlike lettuce plants grown under amber and red light, the FM and DM of lettuce plants grown under blue light did not decrease at higher PPFD.
Similar to the lettuce plants grown under blue light, plants grown under the RBA light treatment showed an initial rapid increase in FM and DM as PPFD increased, followed by a subsequently slower and consistent increase at higher PPFD. FM and DM data were fitted to a power regression curve (R2 = 0.94). The maximum FM recorded under the RBA light treatment was 22.56 g at a PPFD of 1064 µmol·m−2·sec−1. Plants showed increased FM and DM under PPFDs ranging from 39 to 1064 µmol·m−2·sec−1and a decrease in DM was observed for plants treated with PPFDs above 1164 µmol·m−2·sec−1. Although this relationship is visually depicted in and , this decrease was not considered significant.
Leaf shape index (LSI)
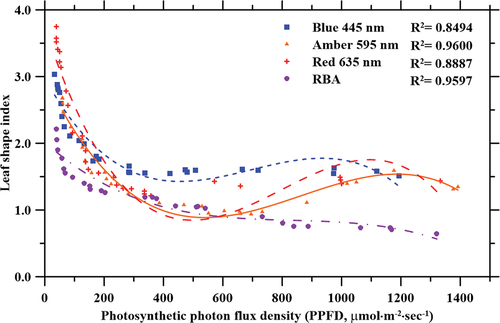
The LSI of lettuce plants was significantly influenced by both the PPFD and wavelength of each light treatment (p < 0.001), but not by the interaction effect of PPFD and wavelength. Statistical analyses of the highest LSI for all light treatments were observed within the range of 33–100 µmol·m−2·sec−1. Effect analyses of the PPFD for all the light treatments (red, blue, amber and RBA), showed that the LSI results reported for the PPFD range of 33–100 µmol·m−2·sec−1 were significantly (p < 0.05) different from the other light intensities (101–1400 µmol·m−2·sec−1) used in the study. LSI exponentially decreased as the PPFD increased to ~550 µmol·m−2·sec−1, and then increased again until the PPFD was ~1000 µmol·m−2·sec−1, creating a shoulder in the trend curves for plants grown under amber and red light treatments (). These data were fitted to polynomial curves (R2 = 0.96 and 0.89, for amber and red light, respectively). The curves demonstrate that the LSI of lettuce plants grown under blue light have a shoulder at ~900 µmol·m−2·sec−1, but the resulting third-order polynomial regression (R2 = 0.85) was not as significant under the power regression. Under RBA light treatments, LSI decreased as PPFD increased (), and these data were fitted to power regression curves (R2 = 0.96).
Figure 7. Effects of photosynthetic photon flux density (PPFD) on lettuce plant leaf shape index (LSI) when grown under blue (445 nm), amber (595 nm), red (635 nm), and combined red-blue-amber (RBA) LEDs.
Total leaf area (TLA)
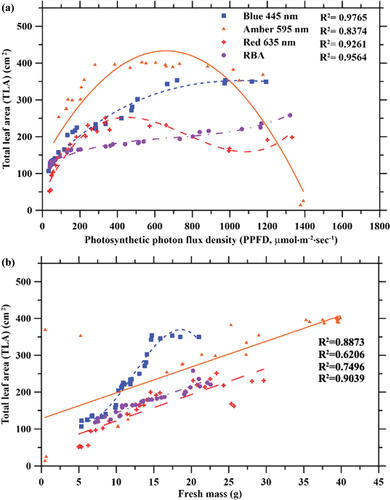
The TLA of the lettuce plants was significantly influenced by both PPFD, wavelength, and the interaction effect between PPFD and wavelength for each light treatment (p < 0.001). TLA increased with increasing PPFD when plants were grown under blue and RBA light treatments (). When grown under red light, the TLA of lettuce plants initially increased as PPFD increased, but a local maximum and subsequent local valley were observed at 335 µmol·m−2·sec−1and 995 µmol·m−2·sec−1, respectively. Among all light treatments, the largest TLA was 402.5 cm2, and this was observed in lettuce plants grown under the amber light at 530 µmol·m−2·sec−1. Similar to the FM and DM data obtained with the amber light treatment, the overall greatest TLA values were acquired with PPFDs ranging from 281 to 732 µmol·m−2·sec−1. Under blue light treatment, the largest TLA was 353.3 cm2 at 975 µmol·m−2·sec−1. Under RBA light treatment, the largest TLA was 258.1 cm2 at the highest PPFD (1321 µmol·m−2·sec−1). Results showed that for plants grown under the blue light treatment, a rapid increase occurred under lower PPFD, and little change in TLA occurred beyond 666 µmol·m−2·sec−1. Upon observation of the relationship between TLA and FM (), TLA under the blue light treatment capped at ~350 cm2 regardless of an ever-increasing FM, and this occurred at PPFDs beyond 700 µmol·m−2·sec−1. Similarly, under amber light treatment, the TLA plateaued at ~400 cm2 with PPFDs above 250 µmol·m−2·sec−1, before decreasing dramatically at PPFDs beyond ~1100 µmol·m−2·sec−1.
Figure 8. Effects of photosynthetic photon flux density (PPFD) on total leaf area (TLA) of lettuce plants grown under blue (445 nm), amber (595 nm), red (635 nm), and red-blue-amber (RBA) light treatment. In (a), curves show the relationship between PPFD and TLA. In (b), curves show the relationship between TLA and fresh mass FM.
Leaf chlorophyll content analysis by SPAD
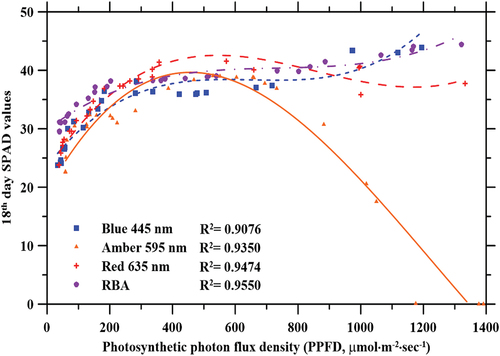
The net chlorophyll content (SPAD reading) of lettuce plants was significantly influenced by both PPFD and wavelength (p < 0.01 and p < 0.0001, respectively), and by the interaction effect between PPFD and wavelength (p < 0.01) (). Measured chlorophyll content under the blue and RBA light treatments showed similar trends, and results were fitted to a power regression curve (R2 = 0.91 and 0.96, respectively). Under these light treatments, chlorophyll content increased rapidly as PPFD increased from 30 to ~200 µmol·m−2·sec−1. Beyond a PPFD of ~200 µmol·m−2·sec−1, the increase in chlorophyll content was gradual. Data collected from lettuce plants grown under blue and RBA light treatments suggest that chlorophyll content decreased in the PPFD range of 200–500 µmol·m−2·sec−1, but a power regression analysis showed more significance than a third order polynomial analysis. Under amber light treatment, chlorophyll content data showed a similar trend to the other light treatments under low PPFDs (<500 µmol·m−2·sec−1) but decreased dramatically at higher PPFDs (>500 µmol·m−2·sec−1).
Figure 9. Effect of photosynthetic photon flux density (PPFD) on lettuce leaf SPAD measurements (chlorophyll) after an 18-day growth period under blue (445 nm), amber (595 nm), red (635 nm), and RBA light treatments.
Plant morphology and leaf coloration
Plants subjected to different wavelength treatments and PPFDs exhibited differences in morphology and leaf colour (). Longer and narrower leaves were observed when grown under red light with PPFD ranging between 38 and 127 µmol·m−2·sec−1, when compared to higher PPFD. Leaf shape (length and width) changed beyond 137 µmol·m−2·sec−1, and a change in leaf curliness was observed at PPFD between 137 and 336 µmol·m−2·sec−1. A slight change in leaf colour, in terms of red pigmentation, was observed in plants grown at PPFD above 358 µmol·m−2·sec−1 under red light.
Figure 10. Representative images of lettuce plants grown under red (635 nm), blue (445 nm), amber (595 nm), and RBA light treatments with different PPFDs. Values in the lower right corner of each photograph represent the photosynthetic photon flux density (PPFD) in µmol·m−2·sec−1.
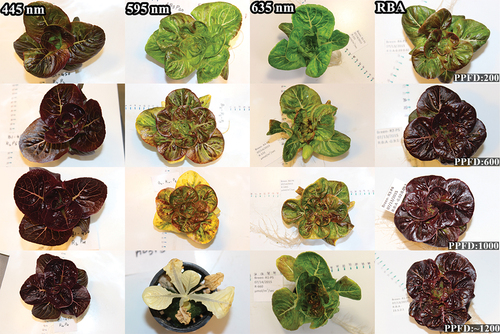
The colouration of plants grown under blue light changed from green to dark purple (red pigmentation), and this conversion began at a PPFD of 116 µmol·m−2·sec−1. This observed change in colouration, without any physical damage to the plants, was apparent for all three replicates. Plants grown under amber light exhibited a slightly different morphological appearance when compared to the three other light treatments. Specifically, longer and narrower leaves were observed for lettuce plants grown under amber light with a PPFD of 100 µmol·m−2·sec−1. As PPFD increased, leaf curliness increased without a change in leaf colour, up to 202 µmol·m−2·sec−1. When PPFD surpassed 208 µmol·m−2·sec−1, but remained below 530 µmol·m−2·sec−1, leaf colour changed to green with slightly purple-coloured regions. Beyond 468 µmol·m−2·sec−1, the lettuce plants gradually suffered from bleaching, starting at the lower leaves and migrating upwards, until a PPFD of 1176 µmol·m−2·sec−1 and beyond was reached, where the entirety of all plants became pale yellow. At this point (PPFD >1176 µmol·m−2·sec−1), the plants exhibited photo-bleaching, while growth and development were suppressed. No bleaching was observed in lettuce plants grown under blue, red, and RBA light. Different red: blue: amber ratios within the RBA light treatment, starting from 0.4: 0.2: 1 (39 µmol·m−2·sec−1) to 22.7: 1.9: 1 (1321 µmol·m−2·sec−1), resulted in differences in plant colour, shape, and growth. Yet, these observations followed similar trends in terms of leaf colour conversion (green to dark purple), as were seen in lettuce plants grown under blue light.
Discussion
Light responses
Light energy is the driver of photosynthesis and its level of intensity, or PPFD, plays an important role in deciding plant quality and morphology (Bugbee, Citation2016; Franklin et al., Citation2004; Hoenecke et al., Citation1992; Kim et al., Citation2004; Mansoori et al., Citation2023; Ouzounis et al., Citation2015; Wu et al., Citation2023). In the present study, the highest FM and DM yields were observed when lettuce plants were grown under amber light, followed by red, red-blue-amber (RBA), and blue light. In terms of FM and DM, these results indicate that amber light can readily activate photosynthetic machinery and consequently induce high plant productivity at PPFDs below 695 µmol·m−2·sec−1 more efficiently than any other light treatments used in this study. Different wavelengths have different quantum yields with respect to carbon dioxide fixation, and amber light (590–620 nm) has the highest quantum yield, whereas red and blue light are considerably less efficient (5–35%) in driving photosynthesis (Evans, Citation1987; Inada, Citation1976; McCree, Citation1972). The spectrum of the amber LED light used in this experiment had an output peak at 595 nm; this might explain the high biomass yield that we observed.
The enhanced FM observed in this study is substantiated by a confluence of recent research (Wu et al., Citation2021) highlighting the superiority of amber light over red light in stimulating photosynthetic activity and overall plant productivity on lettuce (‘Breen’). Amber light reportedly induces higher levels of secondary metabolites in cannabis (Cannabis sativa) (Morello et al., Citation2022). Additionally, supplementing low light intensity of amber light results in higher plant productivity (Gajc-Wolska et al., Citation2013; Martineau et al., Citation2012). The data collected here were compared to those from studies using HPS lamps instead, as the LED amber light spectrum in this study is relatively similar to the HPS lamp spectrum (). At moderate PPFD (<250 µmol·m−2·sec−1), higher or comparable plant productivity under HPS light is observed when compared to 460/655-nm LED light (PPFD <250 µmol·m−2·sec−1) (Bergstrand & Schüssler, Citation2013; Dueck et al., Citation2011; Gajc-Wolska et al., Citation2013; Gomez et al., Citation2013; Martineau et al., Citation2012). However, a contradictory result, in which amber light (580 to 600 nm) suppressed lettuce (L. sativa cv. Grand Rapids) growth at both 200 µmol·m−2·sec−1 and 500 µmol·m−2·sec−1, has been reported (Dougher & Bugbee, Citation2001).
In the present study, when amber PPFD surpassed 800 µmol·m−2·sec−1, FM and DM decreased dramatically, and the entirety of the plants turned pale yellow. This suggests that amber light suppresses chloroplast formation under high intensity light conditions. Mansoori et al. (Citation2023) observed that the leaves of tomato plants treated with the combination of amber and red (1:0.25) light displayed a yellowish-green colour at ~800 μmol m−2 sec−1 and leaf yellowness directly increased with increased PPFD of amber and red light. If the photosynthesis and irradiance (P/I) curve data reported in the literature and from the current study are combined, results imply that using photosynthetic capacity data to correlate plant yields for high amber light conditions is inappropriate (Domurath et al., Citation2012; Dueck et al., Citation2011; Ménard et al., Citation2005). Further, results also suggest that amber light does not invoke photoprotection mechanisms as with UV and blue light.
The underlying mechanism of this dramatic high intensity response in lettuce to amber light in lettuce is poorly understood. Several plausible explanations have been proposed (Hakala et al., Citation2005; Kok, Citation1948; Takahashi et al., Citation2010; Terashima et al., Citation2009). Under low intensity light, a high plant biomass yield may result from the scattering or detour effect in leaf tissues (Kok, Citation1948; Terashima et al., Citation2009). Green and amber light can be absorbed by unsaturated chloroplasts in the lower cell and may be utilised more efficiently than other wavelengths in the PAR spectrum (Nishio, Citation2000; Sun et al., Citation1998). The suppression of FM and DM for plants grown under high-intensity amber light might be a physical phenomenon caused by excessive light that damages photosystems, resulting in photoinhibition, loss of plant performance, and ultimately photo-bleaching (Aro et al., Citation1993; Foyer & Shigeoka, Citation2011; Murchie & Niyogi, Citation2011). Primary photodamage of PSII is associated with both UV and amber light (Hakala et al., Citation2005; Takahashi & Badger, Citation2011; Takahashi et al., Citation2010). As intensity reaches excessive light levels, the photosynthetic system releases highly toxic substances, resulting in irreversible damage to photosynthetic components by increasing reactive oxygen species, thereby minimising any further growth to the plant (Aro et al., Citation1993; Foyer & Shigeoka, Citation2011).
Red light displays maximum absorbance in the photosynthetic reaction centres (Hogewoning et al., Citation2012; McCree, Citation1972), and the positive effect of red (660 nm) light on plant growth has been reported in typical greenhouse crops such as tomato (Solanum lycopersicum), lettuce, and spinach (Spinacia oleracea) (Heo et al., Citation2012; Johkan et al., Citation2012; Son & Oh, Citation2013). Few reports examine the spectrum around 640-nm LED light, but our results suggest that 635-nm light promotes lettuce plant growth at PPFDs below ~600 µmol·m−2·sec−1. At PPFD below ~600 µmol·m−2·sec−1, both amber and red light promoted lettuce growth; however, a 40-nm change in peak wavelength resulted in lower FM and DM, by 10% to 40%. Such differences in FM and DM are not comparable to the difference between these two wavelengths in short-term spectral photosynthetic curves acquired under low light conditions (20–150 µmol·m−2·sec−1) (Inada, Citation1976; McCree, Citation1972). Our data suggest that it may not be appropriate to predict long-term plant cultivation using spectral photosynthetic curves under high light conditions, and this has been previously suggested by (Bugbee, Citation2016). It also reinforces the previous statement regarding the correlation between photosynthetic capacity and plant yield.
Findings reported herein show that lettuce plants more readily use red and amber light to improve growth and development when compared to blue light at lower PPFD (40–660 µmol·m−2·sec−1). However, the opposite is true for PPFD above ~1000 µmol·m−2·sec−1, where overall plant growth is suppressed. Blue and RBA light treatments resulted in the least growth. It is therefore apparent that combining the three wavelengths resulted in roughly an equivalent yield to that of blue light treatment, and thus, the plant did not benefit from the photosynthetic efficiencies of amber or red light alone. Growth inhibition of plants grown under blue light was previously observed in cucumber (Cucumis sativus cv. Burpee’s Pickler and cv. Lemon), pea (Pisum sativum cv. Hiderma and cv. Mammoth Melting), and zucchini (Cucurbita pepo cv. Fordhook) plants (Cosgrove, Citation1981). More recently, a reduction in growth was reported in lettuce under high ratios of blue light, at PPFDs of 200 µmol·m−2·sec−1 and 500 µmol·m−2·sec−1 (Swan & Bugbee, Citation2017). C.-X. Li et al. (Citation2017) reported that auxin repression is downregulated, while microtubule-enhancing genes are upregulated in plants grown under blue light, resulting in the suppression of total plant growth. Our RBA treatment data indicate that the presence of blue light counteracted the decrease in FM and DM that would otherwise have been affected by amber and red light at a high PPFD. This was confirmed when lettuce plants grown under RBA light had a slightly greater yield than lettuce plants grown under blue light alone. Some previous studies have shown that a minimal amount of blue light is necessary to achieve normal photosynthetic operation (Hogewoning et al., Citation2010; C.-X. Li et al., Citation2017; Trouwborst et al., Citation2010).
Many plant photoreceptors exist, including red and far-red-absorbing phytochromes, blue and UV-A-absorbing cryptochromes, as well as phototropins and the ZTL/ADO protein family (Devlin et al., Citation2007; Lariguet & Dunand, Citation2005). Evidence now predicts the existence of additional, unknown photoreceptors absorbing in other areas of the spectrum (Devlin et al., Citation2007). Based on a general assessment of FM and DM yields, and results stemming from the PCA, it is possible that plant photoreceptors may be transferring energy differently depending on a given wavelength range. For instance, a plant may use amber and red light via independent photoreceptors. It is possible that blue light has its own photoreceptors, and this mechanism is superior under certain light conditions, relative to amber and red light, by attempting to counteract the suppressive effects of high PPFD amber and red light.
Leaf shape index (LSI) and total leaf area (TLA)
LSI is a morphological characteristic used to measure the effect of different wavelengths and PPFDs on plant leaves; it can be useful when quantifying leafy green quality. This study shows that red light enhances leaf elongation at very low PPFD (39–55 µmol·m−2·sec−1), followed by the blue light, amber light, and RBA light. It has been reported that red (655 nm) light enhanced LSI and supplemental blue (455 nm) light mixed with red (655 nm) light at various ratios decreased LSI, in comparison to control lettuce (Lactuca sativa var. Sunmang and Grand Rapid TBR) plants grown under fluorescent and HPS light (Son & Oh, Citation2013). In our experiments, increased blue light PPFD resulted in higher LSI. Further to this, it has been reported that a reduction in plant TLA decreases a plant’s capacity to intercept light under limited conditions (Hernández & Kubota, Citation2016). In this work, plants grown under amber light initially showed higher TLA than that of plants grown under blue light, red light, and RBA light as PPFD increased. However, in a similar pattern exhibited by FM and DM yields, TLA decreased dramatically under amber light at very high PPFD. Overall, these plant responses will help elucidate the effect of light quality on the efficiency of energy transfer from the photoreceptor antennas to the reaction centres, and the plant’s ability to use absorbed photons from different wavelengths (Aro et al., Citation1993; Foyer & Shigeoka, Citation2011; Murchie & Niyogi, Citation2011).
Chlorophyll content and morphology
A strong, positive correlation exists between the absorbance peak of extracted chlorophyll and plant growth and development (Brougham, Citation1960; H. Li et al., Citation2012; Mizuno et al., Citation2011). The absorbance peaks for extracted chlorophyll a and b are observed between 400 nm and 500 nm and between 620 nm and 690 nm, respectively (Colmano, Citation1962). As such, it was anticipated that SPAD values in lettuce plants grown under blue, red, and RBA light would be elevated in comparison to lettuce plants grown under amber light. As expected, on the 18th day, the greatest SPAD values were observed in plants grown under RBA light, followed by plants grown under red light, blue light, and amber light. Exposure to higher intensities of amber light might induce damage to the antennas and the photosynthetic reaction centres causing chronic photoinhibition, resulting in a drastic decrease in SPAD value (Aro et al., Citation1993; Foyer & Shigeoka, Citation2011; Murchie & Niyogi, Citation2011). Schwartzbach (Citation1990) investigated the effect of 597 nm green light on the eukaryote Euglena, and determined that at saturation, green light (peak at 597 nm) was less effective than blue light for chlorophyll synthesis. Light quality, quantity, and duration are all conditions that influence plant colour and pigmentation, and these effects vary amongst cultivars (Anderson et al., Citation1995; Schwartzbach, Citation1990). In the present study, differences in leaf morphology and colour were observed in plants grown under different wavelengths and PPFDs. When Arabidopsis plants are grown under red light, leaves curl downwards; in contrast, flat leaves develop under blue light (Inoue et al., Citation2008; Kozuka et al., Citation2011). Our results show that blue light results in less leaf curliness, and that amber light causes leaf curliness at high PPFD.
The anthocyanin pigment is responsible for the red or dark purple appearance of many plants (Andersen & Jordheim, Citation2010). Studies have shown that blue light can promote anthocyanin and phenolic compound production in different lettuce cultivars with various light intensities and in combination with other light sources and wavelengths (HPS lamps, green light, fluorescent lamps, and UV-A) (Giliberto et al., Citation2005; Ouzounis et al., Citation2015; Swan & Bugbee, Citation2017). Plants grown under amber light at PPFDs between 59 and 202 µmol·m−2·sec−1 showed green colouration, with minimal red pigmentation and leaf curliness. Amber light at PPFD between 208 and 386 µmol·m−2·sec−1 induced purple colouration on the leaves of the larger plants. A gradual decrease in overall pigmentation (bleaching) was observed in plants treated with PPFD between 468 and 1050 µmol·m−2·sec−1. Plants grown under amber light at PPFD exceeding 1176 µmol·m−2·sec−1 showed intense bleaching, with a slight yellow hue (very little pigmentation).
The pigmentation of lettuce plants grown under RBA light had a higher level of red to purple colouration across the entire range of PPFD when compared to plants grown under monochromatic lights, with the exception of the blue light treatment. In this work, the addition of blue light to amber light and red light induced a gradual increase in red, and eventually purple, plant colouration. Together, these data add to the current understanding of how different light conditions influence specific physiological responses in plants. They also raise more questions with respect to LED light systems that could improve crop plant growth. Future work will be required to investigate single and interactive effects of additional LED light ratios and combined pairs, such as amber to red and amber to blue light ratios.
Conclusion
This study evaluated the effects of monochromatic red (635 nm), blue (445 nm), amber (595 nm) and combined RBA LED lights, with increasing light intensities (up to 1300 µmol·m−2·sec−1 PPFD) on lettuce growth parameters. Results show that amber light promotes plant growth at lower intensities (up to 732 µmol·m−2·sec−1) and drives photosynthesis. Data showed that at the 732 µmol·m−2·sec−1 PPFD, the FM of plants treated with amber light was 33% more than plants treated with red lights. Although an exponential decrease in fresh and dry masses, and total leaf area were observed for plants treated with amber with PPFD above 800 µmol·m−2·sec−1, amber light induced high plant productivity with the largest fresh and dry masses and leaf area at approximately 695 µmol·m−2·sec−1. Similar polynomial curves were observed for plants grown under red lights. Blue light was the least productive light system, yet lettuce plant growth was not suppressed at high intensities. Higher PPFD increased biomass for plants treated with blue and RBA lights. Differences in leaf morphology and colour were observed in plants grown under different wavelengths and PPFDs; however, bleaching was only observed in lettuce plants grown under amber light alone at PPFDs above 1000 µmol·m−2·sec−1. These findings demonstrate novel plant responses to high intensity light and different wavelengths. Emphasising the ‘amber light effect’, it appears to merit further attention in horticultural studies, equal to that bestowed on red or blue light spectra.
Author contributions
Srinivasa Reddy: Investigation, formal analysis, and writing – Original draft
Lucas McCartney: Investigation, formal analysis, writing – Review and editing
Bo-Sen Wu: Investigation, formal analysis, writing – Review and editing
Philip Wiredu Addo: Review and editing
Sarah MacPherson: Review and editing
Mark Lefsrud: Conceptualisation, supervision, writing – Review and editing
Data availability statement
The data that support the findings of this study are available on request from the corresponding author, [M. L.].
Disclosure statement
No potential conflict of interest was reported by the author(s).
Additional information
Funding
References
- Andersen, Ø. M., & Jordheim, M. (2010). Anthocyanins. Encyclopedia of Life Sciences, 1–12. https://doi.org/10.1002/9780470015902.a0001909.pub2
- Anderson, J. M., Chow, W. S., & Park, Y.-I. (1995). The grand design of photosynthesis: Acclimation of the photosynthetic apparatus to environmental cues. Photosynthesis Research, 46(1), 129–139. https://doi.org/10.1007/BF00020423
- Aro, E.-M., Virgin, I., & Andersson, B. (1993). Photoinhibition of photosystem II. Inactivation, protein damage and turnover. Biochimica et Biophysica Acta (BBA) - Bioenergetics, 1143(2), 113–134. https://doi.org/10.1016/0005-2728(93)90134-2
- Avercheva, O., Berkovich, Y. A., Smolyanina, S., Bassarskaya, E., Pogosyan, S., Ptushenko, V., Erokhin, A., & Zhigalova, T. (2014). Biochemical, photosynthetic and productive parameters of Chinese cabbage grown under blue–red LED assembly designed for space agriculture. Advances in Space Research, 53(11), 1574–1581. https://doi.org/10.1016/j.asr.2014.03.003
- Baias, M., Dumez, J.-N., Svensson, P. H., Schantz, S., Day, G. M., & Emsley, L. (2013). De Novo determination of the crystal structure of a large drug molecule by crystal structure prediction-based powder NMR crystallography. Journal of the American Chemical Society, 135(46), 17501–17507. https://doi.org/10.1021/ja4088874
- Bergstrand, K.-J., & Schüssler, H. (2013). Growth, development and photosynthesis of some horticultural plants as affected by different supplementary lighting technologies. European Journal of Horticultural Science, 119–125.
- Brault, D., Gueymard, C., Boily, R., & Gosselin, A. (1989). Contribution of HPS lighting to the heating requirements of a greenhouse. Transactions of the American Society of Agricultural Engineers, 89(4039).
- Brougham, R. (1960). The relationship between the critical leaf area, total chlorophyll content, and maximum growth-rate of some pasture and crop planst. Annals of Botany, 24(4), 463–474. https://doi.org/10.1093/oxfordjournals.aob.a083719
- Brown, C. S., Schuerger, A. C., & Sager, J. C. (1995). Growth and photomorphogenesis of pepper plants under red light-emitting diodes with supplemental blue or far-red lighting. Journal of the American Society for Horticultural Science, 120(5), 808–813. https://doi.org/10.21273/JASHS.120.5.808
- Bugbee, B. (2016). Toward an optimal spectral quality for plant growth and development: The importance of radiation capture. Acta horticulturae, 1134(1134), 1–12. https://doi.org/10.17660/ActaHortic.2016.1134.1
- Bula, R., Morrow, R., Tibbitts, T., Barta, D., Ignatius, R., & Martin, T. (1991). Light-emitting diodes as a radiation source for plants. Hort Science, 26(2), 203–205. https://doi.org/10.21273/HORTSCI.26.2.203
- Colmano, G. (1962). Visible absorption spectrum of chlorophyll a, b and β-carotene molecules mixed in monolayers at a water–air interface. Nature, 193(4822), 1287–1288. https://doi.org/10.1038/1931287a0
- Cooper, A. (1979). The ABC of NFT. Nutrient film technique. The world’s first method of crop production without a solid rooting medium. Grower Books.
- Cosgrove, D. J. (1981). Rapid suppression of growth by blue light occurrence, time course, and general characteristics. Plant Physiology, 67(3), 584–590. https://doi.org/10.1104/pp.67.3.584
- Deram, P., Lefsrud, M. G., & Orsat, V. (2014). Supplemental lighting orientation and red-to-blue ratio of light-emitting diodes for greenhouse tomato production. Hort Science, 49(4), 448–452. https://doi.org/10.21273/HORTSCI.49.4.448
- Devlin, P. F., Christie, J. M., & Terry, M. J. (2007). Many hands make light work. Journal of Experimental Botany, 58(12), 3071–3077. https://doi.org/10.1093/jxb/erm251
- Domurath, N., Schroeder, F.-G., & Glatzel, S. (2012). Light response curves of selected plants under different light conditions. Acta horticulturae, 956(956), 291–298. https://doi.org/10.17660/ActaHortic.2012.956.33
- Dougher, T. A., & Bugbee, B. (2001). Evidence for yellow light suppression of lettuce growth. Photochemistry and Photobiology, 73(2), 208–212. https://doi.org/10.1562/0031-8655(2001)073<0208:EFYLSO>2.0.CO;2
- Dueck, T., Janse, J., Eveleens, B., Kempkes, F., & Marcelis, L. (2011). Growth of tomatoes under hybrid LED and HPS lighting. Acta horticulturae, 952(952), 335–342. https://doi.org/10.17660/ActaHortic.2012.952.42
- Elkins, C., & van Iersel, M. W. (2020). Longer photoperiods with the same daily light integral increase daily electron transport through photosystem II in lettuce. Plants, 9(9), 1–14. https://doi.org/10.3390/plants9091172
- Erwin, J., & Gesick, E. (2017). Photosynthetic responses of Swiss chard, kale, and spinach cultivars to irradiance and carbon dioxide concentration. Hort Science, 52(5), 706–712. https://doi.org/10.21273/HORTSCI11799-17
- Esmaili, M., Aliniaeifard, S., Mashal, M., Ghorbanzadeh, P., Mehdi, S., Gavilan, M. U., Carrillo, F. F., Lastochkina, O., & Tao, L. (2020). CO2 enrichment and increasing light intensity till a threshold level, enhance growth and water use efficiency of lettuce plants in controlled environment. Notulae Botanicae Horti Agrobotanici Cluj-Napoca, 48(4), 2244–2262. https://doi.org/10.15835/nbha48411835
- Esmaili, M., Aliniaeifard, S., Mashal, M., Vakilian, K. A., Ghorbanzadeh, P., Azadegan, B., Seif, M., & Didaran, F. (2021). Assessment of adaptive neuro-fuzzy inference system (ANFIS) to predict production and water productivity of lettuce in response to different light intensities and CO2 concentrations. Agricultural water management, 258, 1–11. https://doi.org/10.1016/j.agwat.2021.107201
- Evans, J. (1987). The dependence of quantum yield on wavelength and growth irradiance. Australian Journal of Plant Physiology, 14(1), 69–79. https://doi.org/10.1071/PP9870069
- Fan, X.-X., Xu, Z.-G., Liu, X.-Y., Tang, C.-M., Wang, L.-W., & Han, X.-L. (2013). Effects of light intensity on the growth and leaf development of young tomato plants grown under a combination of red and blue light. Scientia Horticulturae, 153, 50–55. https://doi.org/10.1016/j.scienta.2013.01.017
- Foyer, C. H., & Shigeoka, S. (2011). Understanding oxidative stress and antioxidant functions to enhance photosynthesis. Plant Physiology, 155(1), 93–100. https://doi.org/10.1104/pp.110.166181
- Franklin, K. A., Larner, V. S., & Whitelam, G. C. (2004). The signal transducing photoreceptors of plants. The International Journal of Developmental Biology, 49(5–6), 653–664. https://doi.org/10.1387/ijdb.051989kf
- Gajc-Wolska, J., Kowalczyk, K., Metera, A., Mazur, K., Bujalski, D., & Hemka, L. (2013). Effect of supplementary lighting on selected physiological parameters and yielding of tomato plants. Folia Horticulturae, 25(2), 153–159. https://doi.org/10.2478/fhort-2013-0017
- Giliberto, L., Perrotta, G., Pallara, P., Weller, J. L., Fraser, P. D., Bramley, P. M., Fiore, A., Tavazza, M., & Giuliano, G. (2005). Manipulation of the blue light photoreceptor cryptochrome 2 in tomato affects vegetative development, flowering time, and fruit antioxidant content. Plant Physiology, 137(1), 199–208. https://doi.org/10.1104/pp.104.051987
- Goins, G., Yorio, N., Sanwo, M., & Brown, C. (1997). Photomorphogenesis, photosynthesis, and seed yield of wheat plants grown under red light-emitting diodes (LEDs) with and without supplemental blue lighting. Journal of Experimental Botany, 48(7), 1407–1413. https://doi.org/10.1093/jxb/48.7.1407
- Gomez, C., Morrow, R. C., Bourget, C. M., Massa, G. D., & Mitchell, C. A. (2013). Comparison of intracanopy light-emitting diode towers and overhead high-pressure sodium lamps for supplemental lighting of greenhouse-grown tomatoes. Hort Technology, 23(1), 93–98. https://doi.org/10.21273/HORTTECH.23.1.93
- Goto, E. (2003). Effects of light quality on growth of crop plants under artificial lighting. Environment Control in Biology, 41(2), 121–132. https://doi.org/10.2525/ecb1963.41.121
- Haitz, R., & Tsao, J. Y. (2011). Solid-state lighting: ‘the case’ 10 years after and future prospects. Physica Status Solidi (A), 208(1), 17–29. https://doi.org/10.1002/pssa.201026349
- Hakala, M., Tuominen, I., Keränen, M., Tyystjärvi, T., & Tyystjärvi, E. (2005). Evidence for the role of the oxygen-evolving manganese complex in photoinhibition of photosystem II. BBA-Bioenerg, 1706(1–2), 68–80. https://doi.org/10.1016/j.bbabio.2004.09.001
- Heo, J.-W., Kang, D.-H., Bang, H.-S., Hong, S.-G., Chun, C.-H., & Kang, K.-K. (2012). Early growth, pigmentation, protein content, and phenylalanine ammonia-lyase activity of red curled lettuces grown under different lighting conditions. Korean Journal of Horticultural Science and Technology, 30(1), 6–12. https://doi.org/10.7235/hort.2012.11118
- Hernández, R., & Kubota, C. (2013). Leds supplemental lighting for vegetable transplant production: Spectral evaluation and comparisons with HID technology. Acta horticulturae, 1037(1037), 829–835. https://doi.org/10.17660/ActaHortic.2014.1037.110
- Hernández, R., & Kubota, C. (2016). Physiological responses of cucumber seedlings under different blue and red photon flux ratios using LEDs. Environmental and Experimental Botany, 121, 66–74. https://doi.org/10.1016/j.envexpbot.2015.04.001
- Hoagland, D. R., & Arnon, D. I. (1950). The water-culture method for growing plants without soil. Circular - California Agricultural Experiment Station, 347(2nd edit), 23–32.
- Hoenecke, M., Bula, R., & Tibbitts, T. (1992). Importance of ‘blue’ photon levels for lettuce seedlings grown under red-light-emitting diodes. Hort Science, 27(5), 427–430. https://doi.org/10.21273/HORTSCI.27.5.427
- Hogewoning, S. W., Trouwborst, G., Maljaars, H., Poorter, H., van Ieperen, W., & Harbinson, J. (2010). Blue light dose–responses of leaf photosynthesis, morphology, and chemical composition of Cucumis sativus grown under different combinations of red and blue light. Journal of Experimental Botany, 61(11), 3107–3117. https://doi.org/10.1093/jxb/erq132
- Hogewoning, S. W., Wientjes, E., Douwstra, P., Trouwborst, G., van Ieperen, W., Croce, R., & Harbinson, J. (2012). Photosynthetic quantum yield dynamics: From photosystems to leaves. The Plant Cell, 24(5), 1921–1935. https://doi.org/10.1105/tpc.112.097972
- Inada, K. (1976). Action spectra for photosynthesis in higher plants. Plant & Cell Physiology, 17(2), 355–365. https://doi.org/10.1093/oxfordjournals.pcp.a075288
- Inoue, S.-I., Kinoshita, T., Takemiya, A., Doi, M., & Shimazaki, K.-I. (2008). Leaf positioning of Arabidopsis in response to blue light. Molecular Plant, 1(1), 15–26. https://doi.org/10.1093/mp/ssm001
- Johkan, M., Shoji, K., Goto, F., Hahida, S., & Yoshihara, T. (2012). Effect of green light wavelength and intensity on photomorphogenesis and photosynthesis in Lactuca sativa. Environmental and Experimental Botany, 75, 128–133. https://doi.org/10.1016/j.envexpbot.2011.08.010
- Kim, H.-H., Goins, G. D., Wheeler, R. M., & Sager, J. C. (2004). Green-light supplementation for enhanced lettuce growth under red-and blue-light-emitting diodes. Hort Science, 39(7), 1617–1622. https://doi.org/10.21273/HORTSCI.39.7.1617
- Kok, B. (1948). A critical consideration of the quantum yield of Chlorella-photosynthesis. W. Junk.
- Kozuka, T., Kong, S.-G., Doi, M., Shimazaki, K.-I., & Nagatani, A. (2011). Tissue-autonomous promotion of palisade cell development by phototropin 2 in Arabidopsis. The Plant Cell, 23(10), 3684–3695. https://doi.org/10.1105/tpc.111.085852
- Lariguet, P., & Dunand, C. (2005). Plant photoreceptors: Phylogenetic overview. Journal of Molecular Evolution, 61(4), 559–569. https://doi.org/10.1007/s00239-004-0294-2
- Li, H., Tang, C., Xu, Z., Liu, X., & Han, X. (2012). Effects of different light sources on the growth of non-heading Chinese cabbage (Brassica campestris L.). Journal of Agricultural Sciences, 4(4), 1–12. https://doi.org/10.5539/jas.v4n4p262
- Liu, W. (2012). Light environmental management for artificial protected horticulture. Agrotechnology, 1(1), 1–4. https://doi.org/10.4172/2168-9881.1000101
- Li, C.-X., Xu, Z.-G., Dong, R.-Q., Chang, S.-X., Wang, L.-Z., Khalil-Ur-Rehman, M., & Tao, J.-M. (2017). An RNA-Seq analysis of grape plantlets grown in vitro reveals different responses to blue, green, red LED light, and white fluorescent light. Frontiers in Plant Science, 8, 1–16. https://doi.org/10.3389/fpls.2017.00078
- Long, S., Humphries, S., & Falkowski, P. G. (1994). Photoinhibition of photosynthesis in nature. Annual Review of Plant Physiology & Plant Molecular Biology, 45(1), 633–662. https://doi.org/10.1146/annurev.pp.45.060194.003221
- Mansoori, M., Wu, B.-S., Addo, P. W., MacPherson, S., & Lefsrud, M. (2023). Growth responses of tomato plants to different wavelength ratios of amber, red, and blue light. Scientia Horticulturae, 322, 1–11. https://doi.org/10.1016/j.scienta.2023.112459
- Martineau, V., Lefsrud, M., Naznin, M. T., & Kopsell, D. A. (2012). Comparison of light-emitting diode and high-pressure sodium light treatments for hydroponics growth of Boston lettuce. Hort Science, 47(4), 477–482. https://doi.org/10.21273/HORTSCI.47.4.477
- Massa, G. D., Kim, H.-H., Wheeler, R. M., & Mitchell, C. A. (2008). Plant productivity in response to LED lighting. Hort Science, 43(7), 1951–1956. https://doi.org/10.21273/HORTSCI.43.7.1951
- McCree, K. J. (1972). The action spectrum, absorptance and quantum yield of photosynthesis in crop plants. Agricultural Meteorology, 9, 191–216. https://doi.org/10.1016/0002-1571(71)90022-7
- Ménard, C., Dorais, M., Hovi, T., & Gosselin, A. (2005). Developmental and physiological responses of tomato and cucumber to additional blue light. Acta horticulturae, 711(711), 291–296. https://doi.org/10.17660/ActaHortic.2006.711.39
- Mickens, M., Skoog, E., Reese, L., Barnwell, P., Spencer, L., Massa, G., & Wheeler, R. (2018). A strategic approach for investigating light recipes for ‘outredgeous’ red romaine lettuce using white and monochromatic LEDs. Life Sciences and Space Research, 19, 53–62. https://doi.org/10.1016/j.lssr.2018.09.003
- Mitchell, C. A. (2015). Academic research perspective of LEDs for the horticulture industry. Hort Science, 50(9), 1293–1296. https://doi.org/10.21273/HORTSCI.50.9.1293
- Mitchell, C. A., Dzakovich, M. P., Gomez, C., Lopez, R., Burr, J. F., Hernández, R., Kubota, C., Currey, C. J., Meng, Q., & Runkle, E. S. (2015). Light-emitting diodes in horticulture. Horticulture Research, 43, 1–87. https://doi.org/10.1002/9781119107781.ch01
- Mizuno, T., Amaki, W., & Watanabe, H. (2011). Effects of monochromatic light irradiation by LED on the growth and anthocyanin contents in leaves of cabbage seedlings. Acta horticulturae, 907, 179–184. https://doi.org/10.17660/ActaHortic.2011.907.25
- Modarelli, G. C., Paradiso, R., Arena, C., De Pascale, S., & Van Labeke, M.-C. (2022). High light intensity from blue-red LEDs enhance photosynthetic performance, plant growth, and optical properties of red lettuce in controlled environment. Horticulturae, 8(2), 1–13. https://doi.org/10.3390/horticulturae8020114
- Moe, R. (1994). Physiological aspects of supplementary lighting in horticulture. Acta horticulturae, 418(418), 17–24. https://doi.org/10.17660/ActaHortic.1997.418.1
- Morello, V., Brousseau, V. D., Wu, N., Wu, B.-S., MacPherson, S., & Lefsrud, M. (2022). Light quality impacts vertical growth rate, phytochemical yield and cannabinoid production efficiency in cannabis sativa. Plants, 11(21), 1–19. https://doi.org/10.3390/plants11212982
- Morrow, R. C. (2008). LED lighting in horticulture. Hort Science, 43(7), 1947–1950. https://doi.org/10.21273/HORTSCI.43.7.1947
- Murchie, E. H., & Niyogi, K. K. (2011). Manipulation of photoprotection to improve plant photosynthesis. Plant Physiology, 155(1), 86–92. https://doi.org/10.1104/pp.110.168831
- Nelson, J. A., Bugbee, B., & Campbell, D. A. (2014). Economic analysis of greenhouse lighting: Light emitting diodes vs. high intensity discharge fixtures. Public Library of Science ONE, 9(6), 1–10. https://doi.org/10.1371/journal.pone.0099010
- Nishio, J. (2000). Why are higher plants green? Evolution of the higher plant photosynthetic pigment complement. Plant, Cell & Environment, 23(6), 539–548. https://doi.org/10.1046/j.1365-3040.2000.00563.x
- Olle, M., & Viršile, A. (2013). The effects of light-emitting diode lighting on greenhouse plant growth and quality. Agricultural and Food Science, 22(2), 223–234. https://doi.org/10.23986/afsci.7897
- Ouzounis, T., Parjikolaei, B. R., Fretté, X., Rosenqvist, E., & Ottosen, C.-O. (2015). Predawn and high intensity application of supplemental blue light decreases the quantum yield of PSII and enhances the amount of phenolic acids, flavonoids, and pigments in Lactuca sativa. Frontiers in Plant Science, 6(19), 1–14. https://doi.org/10.3389/fpls.2015.00019
- Schwartzbach, S. D. (1990). Photocontrol of organelle biogenesis in Euglena. Photochemistry and Photobiology, 51(2), 231–254. https://doi.org/10.1111/j.1751-1097.1990.tb01708.x
- Singh, D., Basu, C., Meinhardt-Wollweber, M., & Roth, B. (2015). Leds for energy efficient greenhouse lighting. Renewable and Sustainable Energy Reviews, 49, 139–147. https://doi.org/10.1016/j.rser.2015.04.117
- Son, K.-H., & Oh, M.-M. (2013). Leaf shape, growth, and antioxidant phenolic compounds of two lettuce cultivars grown under various combinations of blue and red light-emitting diodes. Hort Science, 48(8), 988–995. https://doi.org/10.21273/HORTSCI.48.8.988
- Stutte, G. W. (2009). Light-emitting diodes for manipulating the phytochrome apparatus. Hort Science, 44(2), 231–234. https://doi.org/10.21273/HORTSCI.44.2.231
- Sun, J., Nishio, J. N., & Vogelmann, T. C. (1998). Green light drives CO2 fixation deep within leaves. Plant & Cell Physiology, 39(10), 1020–1026. https://doi.org/10.1093/oxfordjournals.pcp.a029298
- Swan, B., & Bugbee, B. (2017). Increasing blue light from LED’s reduces growth of lettuce. SAE Technical Papers, 23(3), 1–12. https://doi.org/10.4271/2009-01-2565
- Takahashi, S., & Badger, M. R. (2011). Photoprotection in plants: A new light on photosystem II damage. Trends in plant science, 16(1), 53–60. https://doi.org/10.1016/j.tplants.2010.10.001
- Takahashi, S., Milward, S. E., Yamori, W., Evans, J. R., Hillier, W., & Badger, M. R. (2010). The solar action spectrum of photosystem II damage. Plant Physiology, 153(3), 988–993. https://doi.org/10.1104/pp.110.155747
- Tennessen, D. J., Singsaas, E. L., & Sharkey, T. D. (1994). Light-emitting diodes as a light source for photosynthesis research. Photosynthesis Research, 39(1), 85–92. https://doi.org/10.1007/BF00027146
- Terashima, I., Fujita, T., Inoue, T., Chow, W. S., & Oguchi, R. (2009). Green light drives leaf photosynthesis more efficiently than red light in strong white light: Revisiting the enigmatic question of why leaves are green. Plant & Cell Physiology, 50(4), 684–697. https://doi.org/10.1093/pcp/pcp034
- Trouwborst, G., Oosterkamp, J., Hogewoning, S. W., Harbinson, J., & Van Ieperen, W. (2010). The responses of light interception, photosynthesis and fruit yield of cucumber to LED‐lighting within the canopy. Physiologia Plantarum, 138(3), 289–300. https://doi.org/10.1111/j.1399-3054.2009.01333.x
- Van Ieperen, W., & Trouwborst, G. (2007). The application of LEDs as assimilation light source in greenhouse horticulture: A simulation study. Acta horticulturae, 801(801), 1407–1414. https://doi.org/10.17660/ActaHortic.2008.801.173
- Wang, J., Lu, W., Tong, Y., & Yang, Q. (2016). Leaf morphology, photosynthetic performance, chlorophyll fluorescence, stomatal development of lettuce (lactuca sativa L.) exposed to different ratios of red light to blue light. Frontiers in Plant Science, 7, 1–10. https://doi.org/10.3389/fpls.2016.00250
- Weber, C. (2016). Nutrient content of cabbage and lettuce microgreens grown on vermicompost and hydroponic growing pads. Journal of Horticulture, 3(4), 1–5. https://doi.org/10.4172/2376-0354.1000190
- Wheeler, R. M. (2008). A historical background of plant lighting: An introduction to the workshop. Hort Science, 43(7), 1942–1943. https://doi.org/10.21273/HORTSCI.43.7.1942
- Wu, B.-S., MacPherson, S., & Lefsrud, M. (2021). Filtering light-emitting diodes to investigate amber and red spectral effects on lettuce growth. Plants, 10(6), 1–11. https://doi.org/10.3390/plants10061075
- Wu, B.-S., Mansoori, M., Trumpler, K., Addo, P. W., MacPherson, S., & Lefsrud, M. (2023). Effect of amber (595 nm) light supplemented with narrow blue (430 nm) light on tomato biomass. Plants, 12(13), 1–11. https://doi.org/10.3390/plants12132457
- Yang, Y., Xiao, P., & Yang, Q. (2011). Effects of LED light quality R/B to growth of sweet potato plantlets in vitro and energy consumptions of lighting. Acta horticulturae, (907), 403–407. https://doi.org/10.17660/ActaHortic.2011.907.68.
- Yeh, N., & Chung, J.-P. (2009). High-brightness LEDs—energy efficient lighting sources and their potential in indoor plant cultivation. Renewable and Sustainable Energy Reviews, 13(8), 2175–2180. https://doi.org/10.1016/j.rser.2009.01.027
- Yorio, N. C., Goins, G. D., Kagie, H. R., Wheeler, R. M., & Sager, J. C. (2001). Improving spinach, radish, and lettuce growth under red light-emitting diodes (LEDs) with blue light supplementation. Hort Science, 36(2), 380–383. https://doi.org/10.21273/HORTSCI.36.2.380