
Abstract
Objectives
Melancholia is a severe form of depression that is typified by greater genetic and biological influence, distinct symptomatology, and preferential response to physical treatment. This paper sought to broadly overview potential biomarkers of melancholia to benefit differential diagnosis, clinical responses and treatment outcomes. Given nuances in distinguishing melancholia as its own condition from other depressive disorder, we emphasised studies directly comparing melancholic to non-melancholic depression.
Methods
A comprehensive literature search was conducted. Key studies were identified and summarised qualitatively.
Results
105 studies in total were identified. These studies covered a wide variety of biomarkers, and largely fell into three domains: endocrinological (especially cortisol levels, particularly in response to the dexamethasone suppression test), neurological, and immunological (particularly inflammatory markers). Less extensive evidence also exists for metabolic, genetic, and cardiovascular markers.
Conclusions
Definitive conclusions were predominantly limited due to substantial heterogeneity in how included studies defined melancholia. Furthermore, this heterogeneity could be responsible for the between- and within-group variability observed in the candidate biomarkers that were examined. Therefore, clarifying these definitional parameters may help identify underlying patterns in biomarker expression to improve diagnostic and therapeutic precision for the depressive disorders.
Introduction
Despite decades of research and investigation, the nosological status of melancholia (qua ‘endogenous’, ‘endogenomorphic’, ‘psychotic’, ‘vital’, ‘typical’, ‘type A’, or ‘autonomous’ depression) (Parker and Hadzi-Pavlovic Citation1996), and specifically whether it is viewed as a categorical depressive entity (Parker et al. Citation2010) or as a more severe type of depression (Sani et al. Citation2020), remains unresolved. The latter model underpins its positioning in the DSM-5 where ‘melancholic features’ is a specifier for major depressive disorder (MDD). Several clinical reviews (Jackson Citation1986; Parker and Hadzi-Pavlovic Citation1996; Taylor and Fink Citation2006) have argued the case that melancholia is a categorical condition and that a binary model (i.e. melancholic versus a residual set of non-melancholic disorders) best classifies the depressive disorders. Melancholia’s categorical status is advanced by three ascriptions: (i) a distinctive pattern of symptoms/signs (albeit with differing diagnostic strategies weighting differing features), (ii) a preferential response to physical treatments (e.g. pharmacological, electroconvulsive therapy) as opposed to psychological interventions, and (iii) genetic and other biological determinants (as opposed to psychosocial ones) having greater relevance.
This paper overviews empirical studies that have investigated the last ascription, with a specific emphasis on studies comparing the melancholic and non-melancholic depression subtypes. Thus far, the most comprehensive biological profiling reviews of melancholia have been published in monographs (Parker and Hadzi-Pavlovic Citation1996; Taylor and Fink Citation2006), but these warrant an update given their age. Subsequent reviews have often prioritised specificity over breadth, whether that be in the class of biological markers studied (Juruena et al. Citation2018; Yang et al. Citation2018; Bruun et al. Citation2021) or restricting themselves to studies referencing the ‘melancholia’ label alone (Esposito and Buoli Citation2020) rather than also evaluating studies pursuing the previously mentioned synonyms for melancholia. Therefore, this paper is positioned as a broader synthesis of current knowledge.
Materials and methods
Given the anticipated large number of relevant publications, a hybrid approach for identifying studies was used. This consisted of a comprehensive literature search conducted in PsycINFO, MEDLINE, and Embase followed by a review of individual reference lists for all papers published from 1 January 2005 (the year before the last comprehensive review (Taylor and Fink Citation2006)) to 28 February 2023. The terms selected ( for full list) were broad enough to encompass heterogeneity in melancholia labelling (e.g. ‘melancholia’, ‘endogenous depression’). For this review, psychotic depression was also considered within this melancholia class, although there are varying views regarding whether it is a separate ‘type’ of depression, or melancholia with additional psychotic features (Parker et al. Citation1996; Parker et al. Citation1997). Authors MJS and AS independently screened each article from the search and reached consensus regarding studies included within this review by discussion. Finally, we searched the individual reference lists of the reviews mentioned previously (Parker and Hadzi-Pavlovic Citation1996; Taylor and Fink Citation2006) and those that emerged in the database search. Google Scholar and further ad hoc searches were also conducted to supplement this search strategy, and to find studies examining select biomarkers in cases where limited evidence was provided or when further context or relaxation of inclusion criteria (see below) might have provided a beneficial background for future research.
Table 1. Search strategy for MEDLINE, PsycINFO, and EMBASE.
Articles were included if they evaluated at least one biological variable and, as we were interested in potential diagnostic utility, we limited our selection to articles comparing subjects with unipolar (i.e. major depressive disorder only) melancholic (MEL) and non-melancholic depression (NMD). NMD allocation included depressive subtypes that we judged as capturing non-melancholic depression, such as dysthymia (Rhebergen et al. Citation2012) and atypical depression (Parker and Thase Citation2007). Articles were also excluded if they were not written in English, not a peer-reviewed empirical study (e.g. review, editorial, case study, conference abstract, preprint), examined non-adult patients (i.e. under 18 years old), explicitly examined populations with comorbid conditions (e.g. melancholic depressed patients with diabetes, or with an eating disorder), or only examined biological markers that emerged as a response to treatment.
Results
Overall study characteristics
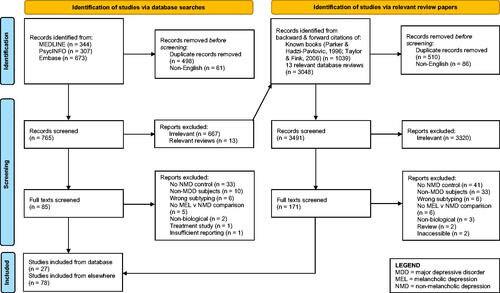
105 Studies were identified through our search process, which are outlined in . The biological measures examined within the included studies fell into three main categories: endocrine (i.e. hormone level studies), neurological (including brain circuits/activity, sensory potentials, etc.), and immunological (e.g. inflammatory markers). This is consistent with historical observations that these three systems have most often been targets for the identification of psychiatric biomarkers (Shorter and Fink Citation2010). A minority of studies with a comparatively smaller evidence base (e.g. in the fields of genetics, cardiology, proteomic markers) were also considered.
Figure 1. PRISMA flow diagram outlining the search strategy and study selection process.
Across the studies, definitional criteria for melancholia varied. The most common criteria sets were DSM criteria (from DSM-III to DSM-5), the Newcastle Endogenous Depression Diagnostic Index (NEDDI; Carney et al. Citation1965), Research Diagnostic Criteria (RDC; Spitzer et al. Citation1978), the CORE measure (Parker et al. Citation1990, Citation1994), and the Michigan index (Feinberg and Carroll Citation1982). These criteria are summarised in , but briefly, most DSM definitions highlight the primacy of anhedonia and lack of reactivity as symptoms. The RDC is similar, but also allows for two symptoms – the presence of worse mood in the mornings, and a ‘distinct quality’ of mood different from normal feelings of grief – to confer endogenous status in the absence of the former two symptoms. The DSM-III-R gives equal consideration to all its symptoms, which include clinical factors such as previous depressive episodes and treatment response. Other indices emphasised certain symptoms through either their weights or subscales. Some of these symptoms include decreased appetite and guilt for the Michigan index, weight loss, nihilistic delusions, and lack of psychogenesis for the NEDDI, and nuances of psychomotor disturbance for the CORE.
Table 2. Definitional criteria for melancholia.
Diagnostic allocations were also occasionally data-driven (Maes et al. Citation1990; Lamers et al. Citation2013), and in such latter instances, melancholia or other synonymous labels were prescribed if the data-derived classes showed symptom patterns consistent with how these conditions are usually defined by clinicians or by standardised measures. Occasionally, key melancholic symptoms formed the basis of studies rather than melancholia per se, and these have also been included for their potentially relevant findings. As differences in diagnostic decision rules may result in different findings, relevant nuances are noted here as well.
Endocrinological markers
Thirty-one studies examined endocrinological markers; these are listed in more detail in . However, we offer a summary of the main findings below.
Table 3. Summaries of studies exploring endocrinological markers of melancholia.
Hypercortisolemia, or high levels of cortisol in the body, is one of the most salient proposed biomarkers for melancholia. The dexamethasone suppression test (DST) is commonly used to measure cortisol levels and assess the function of the hypothalamic-pituitary-adrenal (HPA) axis, which helps to regulate the body’s response to stress. The DST involves giving a person a dose of dexamethasone and then measuring their cortisol levels. In general, dexamethasone suppresses cortisol production, but people with melancholic depression will not show suppression after taking dexamethasone. Below, we outline three types of DST related results: diagnostic test metrics, non-suppression rates, and post-DST cortisol levels.
DST metrics: 7 Studies (mixed results, DSM-III poor, NEDDI better)
While the seminal DST study showed strong performance (Carroll et al. Citation1981), no adjustment for confounders aside from severity (4% of variance) were made, limiting generalisability of findings. Within the six subsequent studies, two found high discrimination with the NEDDI (Davidson et al. Citation1984; Holden Citation1983), while another found modest results (Georgotas et al. Citation1986), while DSM-III studies showed mixed results (Davidson et al. Citation1984; Brown et al. Citation1988). RDC also showed poor sensitivity, whether done in plasma (Davidson et al. Citation1984) or serum (Rush et al. Citation1982) also found poor sensitivity. Typical depressive symptoms like insomnia and agitation were linked to greater likelihood of DST non-suppression (Miller and Nelson Citation1987).
DST non-suppression rates: 9 Studies (consistent differences, but modest magnitudes)
Eight of the nine studies showed significantly greater non-suppression rates in MEL patients, and the study that did not (Brown and Shuey Citation1980) had the smallest sample size of the studies, with only 6 MEL patients. Nevertheless, half of the MEL suppression rates (Amsterdam et al. Citation1989; Georgotas et al. Citation1986; Rush et al. Citation1996, Citation1997) were under 50%, indicating non-suppression itself may not be a definitive marker.
Post-DST cortisol: 7 Studies (consistent differences, mixed evidence for DSM-III)
There is consistent evidence for higher levels of cortisol levels in MEL patients post-DST. Most studies found this for at least one diagnostic criteria set, with the NEDDI (Georgotas et al. Citation1986; Hubain et al. Citation1998) and RDC (Rush et al. Citation1996; Türkçapar et al. Citation1999) being the strongest. DSM-III evidence is more mixed, though studies finding an effect (Maes, Meltzer, et al. Citation1994; Rush et al. Citation1996) tended to have more balanced and/or larger samples than those that did not (Maes, Scharpé, et al. Citation1993; Türkçapar et al. Citation1999).
Natural cortisol levels: 11 Studies (limited evidence)
While all eleven studies found higher levels of cortisol/cortisol trajectories in MEL patients, only three of these (Karlović et al. Citation2012; Lamers et al. Citation2013; Türkçapar et al. Citation1999) reached significance. Most examined plasma or serum levels, though two studies considered salivary cortisol after wakening with mixed results (Lamers et al. Citation2013; Herane-Vives et al. Citation2020). Otherwise, no patterns between the studies that purported to show an effect or not were evident.
HPA axis processes: 6 Studies (potentially exaggerated HPA processes)
Three studies by Amsterdam et al. (Citation1989) were useful in illustrating that the negative feedback cycle underlying the HPA axis (i.e. cortisol acts to excrete corticotropin-releasing hormone (CRH), which acts to excrete adrenocorticotropin hormone (ACTH), which acts to excrete cortisol etc.) can be exaggerated in MEL patients. However, no other studies examined these processes holistically. There is some evidence for higher levels of post-DST ACTH levels (Maes et al. Citation1990; Maes, Meltzer, et al. Citation1994), but the evidence for differences in natural ACTH levels are limited and mixed (Maes, Meltzer, et al. Citation1994; Cizza et al. Citation2012). Furthermore, any differences in the latter may instead be related to depression severity given the low depression severity scores in the study that did not show an effect (Cizza et al. Citation2012).
Thyroid hormones: 9 Studies (lower TSH, higher FT4, strongest evidence for DSM-III-R)
Several studies have examined for diagnostic differences in hormones related to the thyroid gland and hypothalamic-pituitary-thyroid axis. These hormones include thyroid-stimulating hormone (TSH; which is produced by the pituitary to act on the thyroid), thyrotropin-releasing hormone (TRH; which stimulates the production of TSH), and free thyroxine (which is secreted by the thyroid).
Studies examining associations between MEL and thyroid hormones varied in results according to diagnostic criteria and assay accuracy. In cases of equal depressive symptom severity between patients with MEL or NMD, studies indicated lower TSH observed in MEL patients defined by NEDDI criteria (Hubain et al. Citation1994) which did not hold if defined by DSM-IV criteria (Brouwer et al. Citation2005). Similarly, where MEL depressive symptom severity was greater than participants with NMD, lower TSH and higher FT4 for patients with MEL was observed with RDC criteria (Maes et al. Citation1990). This same pattern of lower TSH and higher FT4 for patients with MEL was consistently observed using DSM-III-R criteria (Rush et al. Citation1997; Maes, Maes et al. Citation1992; Maes, Meltzer, et al. Citation1993; Türkçapar et al. Citation1999). However, it only was only replicated once for DSM-IV and did not persist in one study when DSM-III or RDC-definitions were adopted (Türkçapar et al. Citation1999).
An alternative diagnostic test to the DST, the TRH challenge test, examines TSH response to TRH. The limited evidence found suggests the potential for greater changes in maximum TSH levels in NMD patients (Hubain et al. Citation1994), but no differences in blunting rates (Rush et al. Citation1997).
Other hormones: 2 Studies
Single studies have also examined β-endorphin/β-lipotropin (Maes, Meltzer, et al. Citation1994) and vasopressin (Gjerris et al. Citation1985), but no diagnostic differences were found.
Neurological markers
A total of 48 studies () have examined brain-based potential biomarkers of MEL and NMD depression. Studies generally varied widely in terms of the target areas and processes examined.
Table 4. Summaries of studies concerning neurological biomarkers of melancholia.
Brain morphology: 6 Studies (some weak support for PFC alteration)
Single studies have found structural differences in brain areas of patients with largely similar levels of depressive severity. This includes consistent alterations in the anterior cingulate cortex (ACC; Mertse et al. Citation2022; Pizzagalli et al. Citation2004) and subgenual prefrontal cortex (PFC; Pizzagalli et al. Citation2004), reduced white matter integrity for MEL patients (largely in the limbic system; Korgaonkar et al. Citation2011), and higher MEL pineal gland volumes (Takahashi et al. Citation2020).
Brain networks: 7 Studies (subgenual ACC connectivity differences)
All studies comparing brain network activity and connectivity found unique differences between patients with MEL or NMD. While depressive symptom severity was greater for MEL as opposed to NMD patients in one study (Hyett, Breakspear, et al. Citation2015), results indicating attentional and interoceptive changes from rest in response to negative stimuli were consistent with other papers noting distinct reductions in medial network activity and connectivity in hub regions (subgenual ACC) unique to patients with MEL as opposed to NMD (Hyett, Parker, et al. Citation2015; Guo et al. Citation2016; Workman et al. Citation2016; Zhang et al. Citation2021).
Machine learning classification: 3 Studies (high accuracy models of connectivity and homogeneity patterns)
Across three studies of whole-brain functional imaging, patients with MEL exhibited reduced connectivity and homogeneity across the pre-central and post-central gyri (Shan et al. Citation2021), middle and right superior occipital gyri (Yan, He, et al. Citation2021), and the left inferior temporal gyrus (linked to MEL specific anhedonia; Yan, Cui, et al. Citation2021). Taken together, using these parameters, machine learning models ranged from 74.6 to 83% in diagnostic accuracy of MEL. No observed differences in depressive symptom severity were observed between MEL and NMD patients (Shan et al. Citation2021; Yan, He, et al. Citation2021; Yan, Cui, et al. Citation2021).
General EEG: 4 Studies (slower EEG, less PFC activation)
Right superior and inferior frontal lobes (Broadmann areas 9–11; subgenual PFC) indicated strong beta activity for patients with MEL in two electrical tomography studies (Pizzagalli et al. Citation2002, Citation2004). Similarly, greater psychomotor retardation was associated with slower EEG activity and lower left frontal activation in patients with MEL (related to greater proneness to anger and irritability; Nieber and Schlegel Citation1992; Quinn et al. Citation2014). However, severity of depressive symptoms for participants was not reported (Pizzagalli et al. Citation2004; Nieber and Schlegel Citation1992; Quinn et al. Citation2014) which limits understanding of its influence on findings.
Neural correlates of behaviour/cognition: 5 Studies (MEL poorer oxygenation and PFC activity)
Five studies reviewing neuropsychological data across verbal fluency and response to reward largely supported MEL specific differences in performance. For both verbal fluency tasks, patients with MEL (no difference in severity to NMD) demonstrated poorer performance, with lower oxygenated haemoglobin in the temporal lobe, psychomotor retardation (Tsujii et al. Citation2014) and reduced prefrontal cortex activity (Tsujii et al. Citation2016). In the remaining three studies examining dysfunctional response to reward, where depressive symptom severity for MEL patients was greater than NMD, blunted ventral striatum activity (Foti et al. Citation2014), EEG asymmetry (Shankman et al. Citation2011), and abnormal reward processing were reported (Liu et al. Citation2016). The latter association between MEL and abnormal reward processing remained significant after accounting for depression severity (Liu et al. Citation2016), which may be due to dimensional scale used for melancholia (Thase et al. Citation1983).
Miscellaneous metabolic markers: 4 Studies (mixed, missing depression severity data)
Two studies examined glucose metabolism, and while a very small study showed no differences (Biver et al. Citation1994), another suggested lower MEL metabolism across multiple areas (Pizzagalli et al. Citation2004). A further two studies of regional cerebral blood flow showed greater activity for MEL patients in cingulate/frontal cortices (Austin et al. Citation1992) or greater and less perfusion across the right occipital and right frontal lobes respectively (Fountoulakis et al. Citation2004). However, with one exception (Pizzagalli et al. Citation2004), depression severity amongst MEL and NMD patients were unreported in these studies. Therefore, it is difficult to determine whether design or statistical considerations (i.e. low sample size) contributed to findings, as opposed to evidence for or against a categorical definition of MEL.
Sensory-evoked potentials: 4 Studies (poorer inhibitory control)
Sensory-evoked potential studies consistently found latencies in patients with MEL as opposed to NMD alone, when responding to stimuli (P240 latencies; Elton Citation1984). For both studies that examined feedback related negativity, association between a MEL diagnosis directly (Weinberg et al. Citation2016) or intrinsic features of MEL (impaired mood reactivity; Foti et al. Citation2014) were associated with poorer responses to reward and punishment tasks. Similarly, patients with MEL demonstrated poorer inhibitory control, though this did not extend to any difference in event-related potentials (Quinn et al. Citation2012). Interestingly, these associations between MEL and poorer responses to behavioural control tasks persisted when there was equivalent symptom severity in the sample (Weinberg et al. Citation2016; Quinn et al. Citation2012) and after adjusting for anhedonia and symptom severity (Foti et al. Citation2014).
Auditory-evoked potentials: 4 Studies (MEL shorter latencies and shallower amplitudes)
Physiological data that measured neural responses related to audio-event potentials, indicated signal propagation was worse for MEL patients (Fitzgerald et al. Citation2009; Kerr et al. Citation2011). Both thalamocortical modelling and wave form analyses indicated a shallower slope of auditory potentials (Fitzgerald et al. Citation2009) and D2 latency in pre-frontal areas (Kerr et al. Citation2011). Furthermore, when MEL and NMD severity were equivalent, also tended to have higher P300 latencies (Schlegel et al. Citation1991). MEL patients also showed longer latencies and decreased response during an attention task (Kemp et al. Citation2010).
Visual-evoked potentials and ocular features: 4 Studies (poorer MEL response to stimuli)
Three studies found statistically significant latencies in visually evoked potentials and eye saccades for patients with melancholia, irrespective of depression severity. These manifested as greater P100 and N80 latencies (Fotiou et al. Citation2003) or poorer accuracy (indicated by slower saccadic peak velocities and larger positional amplitudes; Winograd-Gurvich et al. Citation2006a; Winograd-Gurvich et al. Citation2006b). One further study found no diagnostic differences in electrooculogram or flash electroretinogram data, but did find that melancholic anhedonia was associated with larger wave latencies (Fountoulakis et al. Citation2005).
Sleep: 7 Studies (delayed REM onset)
Two studies (Giles et al. Citation1990; Hein et al. Citation2019) found characteristic melancholia indicators (anhedonia and non-reactive mood) were correlated with greater REM latency; that is slower onset of REM sleep and poorer sleep quality. Furthermore, ‘small world organisation’, shorter pathways were also observed for MEL patients. In both studies, MEL and NMD showed equal depressive symptom severity, providing some evidence for a discrete MEL depressive category. Five other studies, where presence of melancholia indicated greater depressive symptom severity compared to NMD patients, also found longer REM latencies for patients with MEL, although noted no difference on sleep time or slow wave sleep (Hubain et al. Citation1995). In one study, adopting a REM latency threshold produced reasonable diagnostic test metrics (Rush et al. Citation1982).
Miscellaneous: 3 Studies
No diagnostic differences were found in two studies of serum brain-derived neurotrophic factor (BDNF; Patas et al. Citation2014; Spanemberg et al. Citation2014), or midbrain densities of serotonin and dopamine transporters (Lehto et al. Citation2006).
Immunological markers
We identified twenty-four studies that examined potential immunological biomarkers, which are summarised in . Many of these examined cytokines such as interleukins (IL) and various other proteins. These cytokines have multiple properties, however, one particularly relevant to depression is their role in inflammation.
Table 5. Summaries of studies exploring immunological markers of melancholia.
Inflammation
Previous research has suggested that the immune system may play a role in the pathophysiology of depression, not only through its impact on the neuroendocrine system, but also specifically from disordered processes of inflammation (Yang et al. Citation2018). As outlined by Maes, Mihaylova, et al. (Citation2012), inflammation is often indicated by the presence of pro-inflammatory cytokines (PICs), such as IL-1 (IL-1α, IL-1β), IL-6, and tumour necrosis factor-alpha (TNFα), along with acute phase proteins (APPs) such as C-reactive protein (CRP), interferon-gamma (IFN-γ), haptoglobin, and α2-macroglobulin. Almost all the studies relevant to our topic have focussed on at least one of these compounds, however, the findings overall indicate a lack of any reliable distinguishing biomarkers between MEL and NMD patients.
Nineteen studies considered PICs. Of the twelve TNFα studies, nine produced null results. The weakness of this evidence is further emphasised by caveats of the remaining studies: one was barely significant (Karlović et al. Citation2012), another used data-driven diagnostic subtyping (Lamers et al. Citation2013), and another confirmed that greater depression severity was linked to higher TNFα (Maes, Mihaylova, et al. Citation2012). Similarly, only two of eight IL-1β studies found diagnostic differences in serum levels. One of these suggested higher IL-1β in NEDDI-defined-NMD patients (Kaestner et al. Citation2005), while the other found an effect in the opposite direction for DSM-IV defined melancholia (Huang and Lee Citation2007). Finally, with regards to IL-1α, one study that considered combined IL-1 did not find an effect (Maes, Mihaylova, et al. Citation2012), while a single study of IL-1α alone showed higher levels in DSM-IV-TR MEL patients (Sowa-Kućma et al. Citation2018).
In contrast, the evidence is somewhat stronger for IL-6 (5/11 found an effect). MEL patients may have higher levels of IL-6 in serum (Dunjic-Kostic et al. Citation2013; Karlović et al. Citation2012) and plasma (Patas et al. Citation2014), though one study using data-derived classification (Lamers et al. Citation2013) and another looking at IL-6 production (Maes, Scharpé, et al. Citation1993) found effects in the opposite direction. Aside from this, the significant and non-significant studies did not differ appreciably from each other, though Karlović et al. (Citation2012) being the only study to use a DSM-IV-TR melancholia definition.
Of the APPs, CRP was studied the most. However, only one of the twelve studies purported to show higher CRP for atypical (NMD) compared to MEL patients (Lamers et al. Citation2013). However, these groups were defined by latent class/transition analyses, and when these classes were updated with new data in a subsequent study, differences in CRP disappeared after other biomarkers were controlled for (Lamers et al. Citation2016). Except for one machine learning study that suggested CRP may be an important variable in predicting diagnosis when considered in conjunction with other immune-metabolic markers (Sánchez-Carro et al. Citation2023), the remaining studies showed no evidence for any differences. Other APPs showed mixed/limited evidence: IFNγ was consistently higher in NMD patients but only reached significance for whole blood concentrations (Rothermundt, Arolt, Fenker, et al. Citation2001) rather than serum levels (Marques-Deak et al. Citation2007; Spanemberg et al. Citation2014). Two comparable studies examining serum haptoglobin produced conflicting results (Erdem et al. Citation2011; Rothermundt, Arolt, Fenker, et al. Citation2001), and a study of serum α2-macroglobulin (Rothermundt, Arolt, Peters, et al. Citation2001) found higher levels in MEL patients. Both haptoglobin and α2-macroglobulin failed to reach significance in a regression model considering data-derived diagnostic classes (Lamers et al. Citation2016).
Finally, limited evidence from a single study suggests MEL patients could potentially have higher levels of plasma neutrophil gelatinase-associated lipocalin (NGAL) (Veltman et al. Citation2018). But once again, its ability to distinguish between diagnoses when controlling for other biomarkers has been questioned by Lamers et al. (Citation2016).
Other immunological factors
Other non-pro-inflammatory cytokines have also been studied. Two studies examined the production (Rothermundt, Arolt, Fenker, et al. Citation2001) and serum levels (Spanemberg et al. Citation2014) of both IL-2 and IL-10. No differences were found for the latter, but IL-2 production appeared to be elevated for NMD patients. Spanemberg et al. (Citation2014) also examined IL-4 and IL-17 levels and found no differences.
A few isolated studies suggest potential for other immunological biomarkers, specifically immune cells, receptors and receptor antagonists of various PICs and interleukins, neopterin (a protein involved in cell-mediated immunity), and 5-HT antibody positivity. With regards to immune cells, Rothermundt et al. suggested that NMD patients have higher overall levels of lymphocytes (Rothermundt, Arolt, Fenker, et al. Citation2001) and monocytes (Rothermundt, Arolt, Peters, et al. Citation2001). Additionally, Maes, Lambrechts, et al. (Citation1992) assessed for differences in leukocytes in those with melancholic and non-melancholic depression and reported that MEL patients had higher levels of pan-T (CD3+), pan-B (CD19+), and T-suppressor/cytotoxic (CD8+) cells (though only the latter reached statistical significance). For receptors, two studies examined serum levels of receptors associated with IL-1, IL-2, IL-6, and TNFα. Sowa-Kućma et al. (Citation2018) found IL-6R was positively associated with MEL instead of NMD patients, however, there is evidence to suggest that this effect disappears when controlling for other biomarkers (Lamers et al. Citation2016). With regards to neopterin, Maes, Mihaylova, et al. (Citation2012) reported higher serum levels of serum in MEL compared to NMD patients. Finally, the presence of antibodies against serotonin have been reported as more common in MEL patients (Maes, Ringel, et al. Citation2012).
Metabolic markers
Study characteristics and findings from metabolic studies are provided in . As discussed previously, one study by Lamers et al. (Citation2016) has often suggested many potential caveats for the biomarker evidence overall. This study used baseline data from a national cohort study consisting of 171 serum biomarkers, which were used to identify differing biological profiles melancholic and atypical depressed patients. While none of their endocrinological or immunological markers differentiated melancholia and atypical depression, multiple metabolic parameters were identified. After adjusting for multiple comparisons, melancholic compared to atypically depressed patients had higher levels of angiotensin-I-converting enzyme (ACE), mesothelin, insulin-like growth factor-binding protein 1 and 2, and lower levels of leptin, fatty-acid-binding protein, insulin, complement C3, and β2-microglobulin. Leptin and ACE have also been considered in other studies, but this evidence has either failed to find an effect for the former (Cizza et al. Citation2012; Lasserre et al. Citation2017), or offered contradictory evidence for the latter (Maes, Scharpé, et al. Citation1992). Additionally, all compounds except ACE also differentiated atypical patients from controls, and no compounds differentiated melancholic patients from controls, indicating a potential lack of specificity.
Table 6. Summaries of studies exploring metabolic markers of melancholia.
Excluding Lamers et al. (Citation2016), the most common metabolic parameters examined for were lipid concentrations and markers of oxidative stress. For the former, only isolated evidence (Eriksson et al. Citation2023; Lamers et al. Citation2013) was found across the eight studies for diagnostic differences in triglycerides and cholesterol (total, high-, and low-density) levels. For the latter, multiple oxidative stress markers were examined across three studies, with only glutathione emerging as lower in MEL patients for one study (Sánchez-Carro et al. Citation2023). Finally, Maes et al. examined tryptophan and tryptophan/competing amino acids ratios across studies, and found while pseudo-melancholic classes derived from cluster analyses had lower levels on these variables (Maes et al. Citation1990), these results were not replicated for patients diagnosed via a standardised DSM-III interview (Maes, Scharpé, et al. Citation1994). Given the status of metabolic dysregulation as more of a marker of atypical than melancholic depression (Lamers et al. Citation2013), the lack of evidence overall is not surprising.
Finally, two studies each have considered blood levels of adiponectin (Lamers et al. Citation2016; Lasserre et al. Citation2017) and zinc (Maes, D'Haese, et al. Citation1994; Styczeń et al. Citation2017). None of them showed any significant diagnostic differences.
Genetic markers
Before considering genetic markers, we note studies arguing for a stronger genetic contribution to melancholic than to non-melancholic depression. In a file audit of 138 depressed patients, Parker (Citation2021) quantified a family history of depression in first-degree and/or second-degree relatives of 92.2% in the (clinically diagnosed) MEL patients as against 41.7% for NMD patients. Further, Kendler (Citation1997) showed higher concordance rates of major depression in DSM-IV-defined MEL co-twins than in NMD co-twins. Such data indicate that melancholia has a higher genetic contribution than NMD and argue for pursuit of mechanisms.
Despite the fact that the genetics of depression in general has been extensively researched (Wray et al. Citation2018), melancholia has received little attention. Of the limited research that exists, they largely fell into two classes, the first being studies which considered the serotonin transporter gene (SERT; 5-HTT). Baune et al. (Citation2008) examined two related polymorphisms (5-HTTLPR, 5-HTT rs25531) of 5-HTT, and reported that the LL genotype and LALA haplotype of the 5-HTTLPR and 5-HTT rs25531 polymorphisms respectively were associated more with melancholic compared to atypical depression, but only amongst females. One further study (Quinn, Dobson-Stone, et al. Citation2012) suggested no differences between MEL and NMD individuals in expression of the LL genotype as against the SL or SS alternatives. The second class considers from polygenic risk scores (PRSs) computed from genome-wide association studies, but these studies found no clear differences between MEL and NMD individuals. Specifically, Selenius et al. (Citation2021) did not find any differences in PRSs for insulin receptors in the hippocampal and mesocorticolimbic regions, while Oliva et al. (Citation2023) did find a positive relationship between MDD PRS and melancholic features, but the variance explained by their model was small, and the effect disappeared after adjustment for multiple comparisons.
Aside from these comparisons, and additional null results from Quinn, Dobson-Stone, et al. (Citation2012) with regards to BDNF Val66Met expression, no other genetic studies comparing MEL to NMD patients met our inclusion criteria. However, a few other studies may have relevance. Domschke et al. (Citation2011) examined DTNBP1, the gene encoding for the dysbindin protein in patients with psychotic depression. They found four single nucleotide polymorphisms (rs1997679, rs9370822, rs4236167, and rs9370822) and their associated haplotypes which increased the risk of developing psychotic as opposed to non-psychotic depression. However, this may reflect differences between psychotic and non-psychotic melancholia rather than between melancholic and non-melancholic depression. Additionally, a study of plasma dopamine β-hydroxylase (DβH) by Cubells et al. (Citation2002) attempted to find associations between psychotic depression and multiple DβH polymorphisms but failed to find any diagnostic differences.
Cardiovascular markers
The co-occurrence of heart disease and melancholia has been noted as far back as the nineteenth century (Savage Citation1877). More recent studies have suggested a greater risk of subsequent cardiovascular disease in those with non-melancholic depression (Rantanen et al. Citation2020). However, as outlined by Penninx (Citation2017), cardiovascular factors may well be a secondary effect of lifestyle factors or other pathophysiological markers such as HPA axis dysfunction (which, as previously discussed, is seemingly more salient to melancholia).
Kemp et al. (Citation2014) found that increased heart rate was not only more evident in depressed patients overall compared to controls, but for melancholic compared to non-melancholic depressed patients as well. This was the only primary cardiovascular study that met our inclusion criteria, but one study by Rechlin (Citation1994) did suggest that DSM-III-R-defined melancholia and dysthymia could be differentiated by multiple variables associated with heart rate variability, the difference between the longest and shortest RR intervals during expiration/inspiration respectively. These were shown to be lower in melancholic patients after undergoing amitriptyline monotherapy.
Finally, four studies measured systolic and diastolic blood pressure (S/DBP). Of these, one found higher SBP and DBP in individuals with NMD (Eriksson et al. Citation2023), one found this for DBP only (Selenius et al. Citation2021), and the other two found no significant differences in either SDP or DBP (Lamers et al. Citation2013; Sánchez-Carro et al. Citation2023). Both studies with positive findings defined melancholia from DSM-IV criteria, as opposed to DSM-IV-TR (Sánchez-Carro et al. Citation2023) and data-driven approaches (Lamers et al. Citation2013). However, S/DBP was not the focus of any of these studies, and given that the numerous factors which can impact upon blood pressure were not controlled for, the evidence for S/DBP as a marker is tenuous.
Discussion
Given there is no ‘gold standard’ measure of melancholia, the current study findings largely allow for tentative macroscopic level conclusions. The biomarkers with the strongest evidence include DST-related variables (including non-suppression and raw cortisol levels), HPA dysregulation, reduced REM latency, and reduced activity in the PFC and subgenual ACC. There is also some indirect evidence for a stronger genetic contribution to melancholia (than to non-melancholic depression), though specific genetic pathways remaining unclear. Nevertheless, despite the vast amount of research undertaken, clear conclusions from this review are elusive. This is due to, amongst other reasons, the lack of consideration of depressive severity as a confounding factor, and (amongst neurological markers particularly) the wide variety of biomarker targets assessed.
We note a few further limitations. This paper aimed to broadly overview of the literature, and therefore no formal quality assessment tools were used. In future, evaluating studies using such tools, especially, review studies focussing on individual biomarkers where nuances in biomarker expression can be more adequately examined. Additionally, comparing study results is difficult considering there was also substantial variability across the diagnostic measures used. With a few exceptions (Davidson et al. Citation1984; Türkçapar et al. Citation1999) direct intra-study comparisons between diagnostic tools used were not accounted for, thus potentially limiting the generalisability of findings.
The latter limitation about diagnostic definitions highlights a key conceptual point. Any pursuit of biological markers of melancholia is potentially severely compromised by a key concern: whether ‘melancholia’ is validly defined. Indeed, diagnostic measures employed in our reviewed studies differed distinctly. Most, such as the DSM-5, weight a constellation of symptoms. However, a shortcoming of the DSM-5 definition is that some criteria (e.g. anhedonia, empty mood, psychomotor agitation/retardation) are shared across melancholic and non-melancholic major depression (i.e. they are listed as symptoms of MDD generally and melancholia specifically), thus risking a lack of differentiation. The CORE measure (Parker et al. Citation1990, Citation1994) comprises signs of psychomotor disturbance (which is positioned as a necessary feature of melancholic depression), but it only allows valid ratings at depressive nadir. Perhaps the most valid measures are ones incorporating illness correlates as well as clinical symptoms. The first example is the NEDDI (Carney et al. Citation1965) which, in addition to generating symptoms and clinical correlates weighted to melancholia, showed that scores on the melancholia factor predicted response to electroconvulsive therapy (ECT). The second is the DSM-III-R, which carries advantages for defining melancholia because in addition to listing symptoms, it includes no significant personality disturbance before the initial episode, and a previous good response to antidepressant drugs, lithium, or ECT as diagnostic criteria. While not examined in any of our reviewed studies, the Sydney Melancholia Prototypic Index (SMPI; Parker et al. Citation2013) also shows great promise, as illustrated by recent research demonstrating its strong sensitivity and specificity of 98 and 97%, respectively for the detection of melancholia amongst depressed patients (Parker and Spoelma Citation2021). Thus, to the extent that our reviewed studies involved imprecise or invalid measures of melancholia, findings would predictably be compromised. Progress would be achieved by developing a valid measure of melancholia; a task that could be assisted by referencing back to biomarker findings (i.e. iterating the dependent and independent variables).
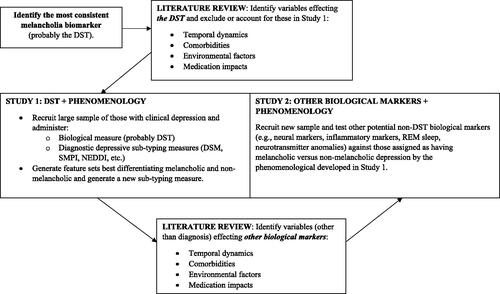
We now suggest a strategy () for pursuing the overall objective of identifying biological markers which, as noted, essentially involves iteratively reversing independent and dependent variables that have been identified through theory and empirical evidence. It would involve first selecting the most consistently identified biomarker to date, with the DST being the most likely candidate. The study paradigm would involve deriving a large sample of participants with clinically severe depressive mood states and administering the DST. Those who were non-suppressors (and perhaps having a positive family history for depression) would be compared against DST suppressors via a set of melancholia measures (i.e. DSM, SMPI) and would also complete a large questionnaire evaluating the potential salience of multiple symptoms and illness course variables weighted to melancholic depression. Analyses of the questionnaire would then generate a refined set of differentiating clinical features for the two putative (melancholic and non-melancholic) depressive classes which may or may not be superior to the SMPI. The next stage would involve obtaining a new sample of clinically depressed individuals and evaluating the salience of key candidate non-DST biological markers. The overall objective would be to determine the most valid phenomenological measure of melancholia and evaluate the relevance of candidate biomarkers against that ‘gold standard’ measure. Such a research strategy will hopefully constrain the diagnostic heterogeneity concern that underlies the research field and advance clarity as to the relevance of multiple melancholia candidate biomarkers. Of course, variability in the expression of biomarkers themselves is also a concern. Therefore, future literature reviews (and potentially further studies in the absence of evidence) which examine the potential correlates, mediators, and modifiers (i.e. temporal variates, and effects of environmental exposures or therapeutic interventions) of biomarker presentation would also be warranted in informing the methodological design of the previously outlined studies.
Figure 2. Strategy for future research into creating a biologically-informed nosology for melancholia.
Our objective in preparing this paper was to capture the vast amount of research that has been undertaken in this field. In so doing, our limited findings seem most likely to be determined by imprecise measures of melancholia that cloud interpretation of study findings. If this is a valid conclusion, then this review’s importance lies in considering the question of whether accounting for diagnostic heterogeneity will aid in furthering biomarker research. By identifying melancholia-specific biomarkers two major consequences would then be fostered. First, the diagnosis and differential diagnosis of melancholia could be advanced by moving beyond reliance on clinician assessment and/or more current versions of the DSM. Secondly, treatment specificity would be advanced. The current hypothesis that melancholia is more likely to respond to physical treatments (e.g. antidepressant drugs, ECT) might be expected to be supported. It can be further enriched by nuanced findings. For example, it may be that broad-action antidepressants (e.g. tricyclics) could be shown to be superior for treating melancholia than narrow-action antidepressants like selective serotonin reuptake inhibitors, while the role of augmenting agents (e.g. atypical antipsychotics, lithium) could also be specified.
Statement of interest
None to declare.
Acknowledgements
The contents of the published material are solely the responsibility of the individual authors and do not reflect the views of the NHMRC.
Additional information
Funding
References
- Amsterdam JD, Maislin G, Gold P, Winokur A. 1989. The assessment of abnormalities in hormonal responsiveness at multiple levels of the hypothalamic-pituitary-adrenocortical axis in depressive illness. Psychoneuroendocrinology. 14(1-2):43–62.
- Austin MP, Dougall N, Ross M, Murray C, O'Carroll RE, Moffoot A, Ebmeier KP, Goodwin GM. 1992. Single photon emission tomography with 99mTc-exametazime in major depression and the pattern of brain activity underlying the psychotic/neurotic continuum. J Affect Disord. 26(1):31–43.
- Baune BT, Hohoff C, Mortensen LS, Deckert J, Arolt V, Domschke K. 2008. Serotonin transporter polymorphism (5-HTTLPR) association with melancholic depression: a female specific effect? Depress Anxiety. 25(11):920–925.
- Biver F, Goldman S, Delvenne V, Luxen A, De Maertelaer V, Hubain P, Mendlewicz J, Lotstra F. 1994. Frontal and parietal metabolic disturbances in unipolar depression. Biol Psychiatry. 36(6):381–388.
- Brouwer JP, Appelhof BC, Hoogendijk WJG, Huyser J, Endert E, Zuketto C, Schene AH, Tijssen JGP, Van Dyck R, Wiersinga WM, et al. 2005. Thyroid and adrenal axis in major depression: a controlled study in outpatients. Eur J Endocrinol. 152(2):185–191.
- Brown WA, Shuey I. 1980. Response to dexamethasone and subtype of depression. Arch Gen Psychiatry. 37(7):747–751.
- Brown RP, Stoll PM, Stokes PE, Frances A, Sweeney J, Kocsis JH, Mann JJ. 1988. Adrenocortical hyperactivity in depression: effects of agitation, delusions, melancholia, and other illness variables. Psychiatry Res. 23(2):167–178.
- Bruun CF, Arnbjerg CJ, Kessing LV. 2021. Electroencephalographic parameters differentiating melancholic depression, non-melancholic depression, and healthy controls. A systematic review. Front Psychiat. 12:648713.
- Carney MWP, Roth M, Garside RF. 1965. The diagnosis of depressive syndromes and the prediction of E.C.T. response. Br J Psychiatry. 111(477):659–674.
- Carroll BJ, Feinberg M, Greden JF, Tarika J, Albala AA, Haskett RF, James NM, Kronfol Z, Lohr N, Steiner M, et al. 1981. A specific laboratory test for the diagnosis of melancholia: standardization, validation, and clinical utility. Arch Gen Psychiatry. 38(1):15–22.
- Cizza G, Ronsaville DS, Kleitz H, Eskandari F, Mistry S, Torvik S, Sonbolian N, Reynolds JC, Blackman MR, Gold PW, et al. 2012. Clinical subtypes of depression are associated with specific metabolic parameters and circadian endocrine profiles in women: the power study. PLOS One. 7(1):e28912.
- Cubells JF, Price LH, Meyers BS, Anderson GM, Zabetian CP, Alexopoulos GS, Nelson JC, Sanacora G, Kirwin P, Carpenter L, et al. 2002. Genotype-controlled analysis of plasma dopamine beta-hydroxylase activity in psychotic unipolar major depression. Biol Psychiatry. 51(5):358–364.
- Davidson J, Lipper S, Zung WW, Strickland R, Krishnan R, Mahorney S. 1984. Validation of four definitions of melancholia by the dexamethasone suppression test. Am J Psychiatry. 141(10):1220–1223.
- Domschke K, Lawford B, Young R, Voisey J, Morris CP, Roehrs T, Hohoff C, Birosova E, Arolt V, Baune BT. 2011. Dysbindin (DTNBP1) – a role in psychotic depression? J Psychiatr Res. 45(5):588–595.
- Dunjic-Kostic B, Ivkovic M, Radonjic NV, Petronijevic ND, Pantovic M, Damjanovic A, Poznanovic ST, Jovanovic A, Nikolic T, Jasovic-Gasic M. 2013. Melancholic and atypical major depression—connection between cytokines, psychopathology and treatment. Prog Neuropsychopharmacol Biol Psychiatry. 43:1–6.
- Elton M. 1984. A longitudinal investigation of event-related potentials in depression. Biol Psychiatry. 19(12):1635–1649.
- Erdem M, Celik C, Cayci T, Ozdemir B, Kurt YG, Akgul EO, Yaman H, Balikci A, Uzun O. 2011. Serum haptoglobin levels in patients with melancholic and nonmelancholic major depression. Prog Neuropsychopharmacol Biol Psychiatry. 35(4):944–947.
- Eriksson MD, Eriksson JG, Korhonen P, Koponen H, Salonen MK, Mikkola TM, Kajantie E, Wasenius NS, von Bonsdorff M, Kautiainen H, et al. 2023. Depressive symptoms and mortality-findings from helsinki birth cohort study. Acta Psychiatr Scand. 147(2):175–185.
- Esposito CM, Buoli M. 2020. The biological face of melancholia: are there any reliable biomarkers for this depression subtype? J Affect Disord. 266:802–809.
- Evans DL, Nemeroff CB. 1987. The clinical use of the dexamethasone suppression test in DSM-III affective disorders: correlation with the severe depressive subtypes of melancholia and psychosis. J Psychiatr Res. 21(2):185–194.
- Exner C, Lange C, Irle E. 2009. Impaired implicit learning and reduced pre-supplementary motor cortex size in early-onset major depression with melancholic features. J Affect Disord. 119(1–3):156–162.
- Feinberg M, Carroll BJ. 1982. Separation of subtypes of depression using discriminant analysis: i. separation of unipolar endogenous depression from non-endogenous depression. Br J Psychiatry. 140(4):384–391.
- Fitzgerald PB, Mellow TB, Hoy KE, Segrave R, Cooper NR, Upton DJ, Croft RJ. 2009. A study of intensity dependence of the auditory evoked potential (IDAEP) in medicated melancholic and non-melancholic depression. J Affect Disord. 117(3):212–216.
- Foti D, Carlson JM, Sauder CL, Proudfit GH. 2014. Reward dysfunction in major depression: multimodal neuroimaging evidence for refining the melancholic phenotype. Neuroimage. 101:50–58.
- Fotiou F, Fountoulakis KN, Iacovides A, Kaprinis G. 2003. Pattern-reversed visual evoked potentials in subtypes of major depression. Psychiatry Res. 118(3):259–271.
- Fountoulakis KN, Fotiou F, Iacovides A, Kaprinis G. 2005. Is there a dysfunction in the visual system of depressed patients? Ann Gen Psychiatry. 4(1):7.
- Fountoulakis KN, Iacovides A, Gerasimou G, Fotiou F, Ioannidou C, Bascialla F, Grammaticos P, Kaprinis G. 2004. The relationship of regional cerebral blood flow with subtypes of major depression. Prog Neuropsychopharmacol Biol Psychiatry. 28(3):537–546.
- Georgotas A, Stokes PE, Hapworth WE, Kim OM, Fanelli C, Stoll PM, Sinaiko E, McCue RE. 1986. The relationship of the dexamethasone suppression test to subtypes of depression and to symptomatic severity in the elderly. J Affect Disord. 10(1):51–57.
- Giles DE, Roffwarg HP, Rush AJ, Guzick DS. 1990. Age-adjusted threshold values for reduced REM latency in unipolar depression using ROC analysis. Biol Psychiatry. 27(8):841–853.
- Giles DE, Roffwarg HP, Schlesser MA, Rush AJ. 1986. Which endogenous depressive symptoms relate to REM latency reduction? Biol Psychiatry. 21(5–6):473–482.
- Gjerris A, Hammer M, Vendsborg P, Christensen NJ, Rafaelsen OJ. 1985. Cerebrospinal fluid vasopressin – changes in depression. Br J Psychiatry. 147:696–701.
- Glaus J, Vandeleur CL, von Känel R, Lasserre AM, Strippoli M-PF, Gholam-Rezaee M, Castelao E, Marques-Vidal P, Bovet P, Merikangas K, et al. 2014. Associations between mood, anxiety or substance use disorders and inflammatory markers after adjustment for multiple covariates in a population-based study. J Psychiatr Res. 58:36–45.
- Guo CC, Hyett MP, Nguyen VT, Parker GB, Breakspear MJ. 2016. Distinct neurobiological signatures of brain connectivity in depression subtypes during natural viewing of emotionally salient films. Psychol Med. 46(7):1535–1545.
- Hein M, Lanquart J-P, Loas G, Hubain P, Linkowski P. 2019. Alterations of neural network organisation during rapid eye movement sleep and slow-wave sleep in major depression: implications for diagnosis, classification, and treatment. Psychiatry Res Neuroimag. 291:71–78.
- Herane-Vives A, Young AH, Wise T, Aguirre J, de Angel V, Arnone D, Papadopoulos A, Cleare AJ. 2020. Comparison of short-term (saliva) and long-term (hair) cortisol levels in out-patients with melancholic and non-melancholic major depression. BJPsych Open. 6(3):e41.
- Holden NL. 1983. Depression and the Newcastle Scale: their relationship to the dexamethasone suppression test. Br J Psychiatry. 142(5):505–507.
- Huang T-L. 2005. Serum lipid profiles in major depression with clinical subtypes, suicide attempts and episodes. J Affect Disord. 86(1):75–79.
- Huang T-L, Lee C-T. 2007. T-helper 1/T-helper 2 cytokine imbalance and clinical phenotypes of acute-phase major depression. Psychiatry Clin Neurosci. 61(4):415–420.
- Hubain PP, Souery D, Jönck L, Staner L, Van Veeren C, Kerkhofs M, Mendlewicz J, Linkowski P. 1995. Relationship between the newcastle scale and sleep polysomnographic variables in major depression: a controlled study. Eur Neuropsychopharmacol. 5(2):129–134.
- Hubain PP, Staner L, Dramaix M, Kerkhofs M, Papadimitriou G, Mendlewicz J, Linkowski P. 1998. The dexamethasone suppression test and sleep electroencephalogram in nonbipolar major depressed inpatients: a multivariate analysis. Biol Psychiatry. 43(3):220–229.
- Hubain PP, Staner L, Dramaix M, Kerkhofs M, van Veeren C, Papadimitriou G, Mendlewicz J, Linkowski P. 1994. TSH response to TRH and EEG sleep in non-bipolar major depression: a multivariate approach. Eur Neuropsychopharmacol. 4(4):517–525.
- Hyett MP, Breakspear MJ, Friston KJ, Guo CC, Parker GB. 2015. Disrupted effective connectivity of cortical systems supporting attention and interoception in melancholia. JAMA Psychiatry. 72(4):350–358.
- Hyett MP, Parker GB, Guo CC, Zalesky A, Nguyen VT, Yuen T, Breakspear M. 2015. Scene unseen: disrupted neuronal adaptation in melancholia during emotional film viewing. Neuroimage Clin. 9:660–667.
- Hyett MP, Perry A, Breakspear M, Wen W, Parker GB. 2018. White matter alterations in the internal capsule and psychomotor impairment in melancholic depression. PLOS One. 13(4):e0195672.
- Jackson SW. 1986. Melancholia and depression: from hippocratic times to modern times. New Haven: Yale University Press.
- Juruena MF, Bocharova M, Agustini B, Young AH. 2018. Atypical depression and non-atypical depression: is HPA axis function a biomarker? A systematic review. J Affect Disord. 233:45–67.
- Kaestner F, Hettich M, Peters M, Sibrowski W, Hetzel G, Ponath G, Arolt V, Cassens U, Rothermundt M. 2005. Different activation patterns of proinflammatory cytokines in melancholic and non-melancholic major depression are associated with HPA axis activity. J Affect Disord. 87(2–3):305–311.
- Karlović D, Serretti A, Vrkić N, Martinac M, Marčinko D. 2012. Serum concentrations of CRP, IL-6, TNF-α and cortisol in major depressive disorder with melancholic or atypical features. Psychiatry Res. 198(1):74–80.
- Kemp AH, Pe Benito L, Quintana DS, Clark CR, McFarlane A, Mayur P, Harris A, Boyce P, Williams LM. 2010. Impact of depression heterogeneity on attention: an auditory oddball event related potential study. J Affect Disord. 123(1-3):202–207.
- Kemp AH, Quintana DS, Quinn CR, Hopkinson P, Harris AWF. 2014. Major depressive disorder with melancholia displays robust alterations in resting state heart rate and its variability: implications for future morbidity and mortality. Front Psychol. 5:1387.
- Kendler KS. 1997. The diagnostic validity of melancholic major depression in a population-based sample of female twins. Arch Gen Psychiatry. 54(4):299–304.
- Kerr CC, Kemp AH, Rennie CJ, Robinson PA. 2011. Thalamocortical changes in major depression probed by deconvolution and physiology-based modeling. Neuroimage. 54(4):2672–2682.
- Korgaonkar MS, Grieve SM, Koslow SH, Gabrieli JDE, Gordon E, Williams LM. 2011. Loss of white matter integrity in major depressive disorder: evidence using tract-based spatial statistical analysis of diffusion tensor imaging. Hum Brain Mapp. 32(12):2161–2171.
- Lamers F, Bot M, Jansen R, Chan MK, Cooper JD, Bahn S, Penninx BWJH. 2016. Serum proteomic profiles of depressive subtypes. Transl Psychiatry. 6(7):e851.
- Lamers F, Vogelzangs N, Merikangas KR, de Jonge P, Beekman ATF, Penninx BWJH. 2013. Evidence for a differential role of HPA-axis function, inflammation and metabolic syndrome in melancholic versus atypical depression. Mol Psychiatry. 18(6):692–699.
- Lasserre AM, Strippoli M-PF, Glaus J, Gholam-Rezaee M, Vandeleur CL, Castelao E, Marques-Vidal P, Waeber G, Vollenweider P, Preisig M. 2017. Prospective associations of depression subtypes with cardio-metabolic risk factors in the general population. Mol Psychiatry. 22(7):1026–1034.
- Lehto S, Tolmunen T, Joensuu M, Saarinen PI, Vanninen R, Ahola P, Tiihonen J, Kuikka J, Lehtonen J. 2006. Midbrain binding of [123I]nor-β-CIT in atypical depression. Prog Neuropsychopharmacol Biol Psychiatry. 30(7):1251–1255.
- Liu H, Sarapas C, Shankman SA. 2016. Anticipatory reward deficits in melancholia. J Abnorm Psychol. 125(5):631–640.
- Liu H, Wu X, Wang Y, Liu X, Peng D, Wu Y, Chen J, Su Y, Xu J, Ma X, et al. 2022. TNF-α, IL-6 and hsCRP in patients with melancholic, atypical and anxious depression: an antibody array analysis related to somatic symptoms. Gen Psychiatr. 35(4):e100844.
- Maes M, D'Haese PC, Scharpé S, D'Hondt P, Cosyns P, De Broe ME. 1994. Hypozincemia in depression. J Affect Disord. 31(2):135–140.
- Maes M, Lambrechts J, Bosmans E, Jacobs J, Suy E, Vandervorst C, De Jonckheere C, Minner B, Raus J. 1992. Evidence for a systemic immune activation during depression: results of leukocyte enumeration by flow cytometry in conjunction with monoclonal antibody staining. Psychol Med. 22(1):45–53.
- Maes M, Maes L, Schotte C, Cosyns P. 1992. A clinical and biological validation of the DSM-III melancholia diagnosis in men: results of pattern recognition methods. J Psychiatr Res. 26(3):183–196.
- Maes M, Maes L, Schotte C, Vandewoude M, Martin M, D'Hondt P, Blockx P, Scharpe S, Cosyns P. 1990. Clinical subtypes of unipolar depression: part III. Quantitative differences in various biological markers between the cluster-analytically generated nonvital and vital depression classes. Psychiatry Res. 34(1):59–75.
- Maes M, Meltzer H, Cosyns P, Calabrese J, D'Hondt P, Blockx P. 1994. Adrenocorticotropic hormone, β-endorphin and cortisol responses to oCRH in unipolar depressed patients pretreated with dexamethasone. Prog Neuropsychopharmacol Biol Psychiatry. 18(8):1273–1292.
- Maes M, Meltzer HY, Cosyns P, Suy E, Schotte C. 1993. An evaluation of basal hypothalamic-pituitary-thyroid axis function in depression: results of a large-scaled and controlled study. Psychoneuroendocrinology. 18(8):607–620.
- Maes M, Mihaylova I, Kubera M, Ringel K. 2012. Activation of cell-mediated immunity in depression: association with inflammation, melancholia, clinical staging and the fatigue and somatic symptom cluster of depression. Prog Neuropsychopharmacol Biol Psychiatry. 36(1):169–175.
- Maes M, Ringel K, Kubera M, Berk M, Rybakowski J. 2012. Increased autoimmune activity against 5-HT: a key component of depression that is associated with inflammation and activation of cell-mediated immunity, and with severity and staging of depression. J Affect Disord. 136(3):386–392.
- Maes M, Scharpé S, Meltzer HY, Bosmans E, Suy E, Calabrese J, Cosyns P. 1993. Relationships between interleukin-6 activity, acute phase proteins, and function of the hypothalamic-pituitary-adrenal axis in severe depression. Psychiatry Res. 49(1):11–27.
- Maes M, Scharpé S, Meltzer HY, Okayli G, Bosmans E, D'Hondt P, Vanden Bossche BV, Cosyns P. 1994. Increased neopterin and interferon-gamma secretion and lower availability of L-tryptophan in major depression: further evidence for an immune response. Psychiatry Res. 54(2):143–160.
- Maes M, Scharpé S, Meltzer HY, Suy E, Cosyns P, Calabrese J. 1992. Lower angiotensin I converting enzyme activity in melancholic subjects: a pilot study. Biol Psychiatry. 32(7):621–624.
- Marques-Deak AH, Neto FL, Dominguez WV, Solis AC, Kurcgant D, Sato F, Ross JM, Prado EBA. 2007. Cytokine profiles in women with different subtypes of major depressive disorder. J Psychiatr Res. 41(1–2):152–159.
- Mertse N, Denier N, Walther S, Breit S, Grosskurth E, Federspiel A, Wiest R, Bracht T. 2022. Associations between anterior cingulate thickness, cingulum bundle microstructure, melancholia and depression severity in unipolar depression. J Affect Disord. 301:437–444.
- Michopoulos I, Zervas IM, Pantelis C, Tsaltas E, Papakosta V-M, Boufidou F, Nikolaou C, Papageorgiou C, Soldatos CR, Lykouras L. 2008. Neuropsychological and hypothalamic–pituitary-axis function in female patients with melancholic and non-melancholic depression. Eur Arch Psychiatry Clin Neurosci. 258(4):217–225.
- Miller KB, Nelson JC. 1987. Does the dexamethasone suppression test relate to subtypes, factors, symptoms, or severity? Arch Gen Psychiatry. 44(9):769–774.
- Mohamed AE, El-Latif RRA, Youssef AM, Ibrahim AS. 2020. C-reactive protein and clinical subtypes of major depressive disorder at Zagazig University Hospitals. Middle East Curr Psychiatry. 27(1):35.
- Nieber D, Schlegel S. 1992. Relationships between psychomotor retardation and EEG power spectrum in major depression. Neuropsychobiology. 25(1):20–23.
- Oliva V, Fanelli G, Kasper S, Zohar J, Souery D, Montgomery S, Albani D, Forloni G, Ferentinos P, Rujescu D, et al. 2023. Melancholic features and typical neurovegetative symptoms of major depressive disorder show specific polygenic patterns. J Affect Disord. 320:534–543.
- Parker GB, Thase ME. 2007. Atypical depression: a valid subtype? J Clin Psychiatry. 68(3):e08.
- Parker G. 2021. Clinical depression: the fault not in our stars? Australas Psychiatry. 29(6):652–654.
- Parker G, Fink M, Shorter E, Taylor MA, Akiskal H, Berrios G, Bolwig T, Brown WA, Carroll B, Healy D, et al. 2010. Issues for DSM-5: whither melancholia? The case for its classification as a distinct mood disorder. Am J Psychiatry. 167(7):745–747.
- Parker G, Hadzi-Pavlovic D. 1996. Melancholia: a disorder of movement and mood: a phenomenological and neurobiological review. Cambridge, UK: Cambridge University Press.
- Parker G, Hadzi-Pavlovic D, Boyce P, Wilhelm K, Brodaty H, Mitchell P, Hickie I, Eyers K. 1990. Classifying depression by mental state signs. Br J Psychiatry. 157(1):55–65.
- Parker G, Hadzi-Pavlovic D, Wilhelm K, Hickie I, Brodaty H, Boyce P, Mitchell P, Eyers K. 1994. Defining melancholia: properties of a refined sign-based measure. Br J Psychiatry. 164(3):316–326.
- Parker G, Hickie I, Hadzi-Pavlovic D. 1996. Chapter 12, psychotic depression: clinical definition, status and the relevance of psychomotor disturbance. In: Parker G, Hadzi-Pavlovic D, editors. Melancholia: a disorder of movement and mood: a phenomenological and neurobiological review. Cambridge, UK: Cambridge University Press; p. 179–201.
- Parker G, McCraw S, Blanch B, Hadzi-Pavlovic D, Synnott H, Rees A-M. 2013. Discriminating melancholic and non-melancholic depression by prototypic clinical features. J Affect Disord. 144(3):199–207.
- Parker G, Roussos J, Mitchell P, Wilhelm K, Austin M-P, Hadzi-Pavlovic D. 1997. Distinguishing psychotic depression from melancholia. J Affect Disord. 42(2–3):155–167.
- Parker G, Spoelma MJ. 2021. Melancholia defined with the precision of a machine. J Affect Disord. 282:69–73.
- Patas K, Penninx BWJH, Bus BAA, Vogelzangs N, Molendijk ML, Elzinga BM, Bosker FJ, Oude Voshaar RC. 2014. Association between serum brain-derived neurotrophic factor and plasma interleukin-6 in major depressive disorder with melancholic features. Brain Behav Immun. 36:71–79.
- Penninx BWJH. 2017. Depression and cardiovascular disease: epidemiological evidence on their linking mechanisms. Neurosci Biobehav Rev. 74(Pt B):277–286.
- Peselow ED, Fieve RR. 1992. Depressive attributional style and the dexamethasone suppression test: relationship to the endogenous/melancholic distinction and to each other. Psychopathology. 25(4):173–182.
- Pizzagalli DA, Nitschke JB, Oakes TR, Hendrick AM, Horras KA, Larson CL, Abercrombie HC, Schaefer SM, Koger JV, Benca RM, et al. 2002. Brain electrical tomography in depression: the importance of symptom severity, anxiety, and melancholic features. Biol Psychiatry. 52(2):73–85.
- Pizzagalli DA, Oakes TR, Fox AS, Chung MK, Larson CL, Abercrombie HC, Schaefer SM, Benca RM, Davidson RJ. 2004. Functional but not structural subgenual prefrontal cortex abnormalities in melancholia. Mol Psychiatry. 9(4):325–325.
- Quinn CR, Dobson-Stone C, Outhred T, Harris A, Kemp AH. 2012. The contributions of BDNF and 5-HTT polymorphisms and early life stress to the heterogeneity of major depressive disorder: a preliminary study. Aust N Z J Psychiatry. 46(1):55–63.
- Quinn CR, Harris A, Kemp AH. 2012. The impact of depression heterogeneity on inhibitory control. Aust N Z J Psychiatry. 46(4):374–383.
- Quinn CR, Rennie CJ, Harris AWF, Kemp AH. 2014. The impact of melancholia versus non-melancholia on resting-state, EEG alpha asymmetry: eelectrophysiological evidence for depression heterogeneity. Psychiatry Res. 215(3):614–617.
- Rantanen AT, Korkeila JJA, Kautiainen H, Korhonen PE. 2020. Non-melancholic depressive symptoms increase risk for incident cardiovascular disease: a prospective study in a primary care population at risk for cardiovascular disease and type 2 diabetes. J Psychosom Res. 129:109887.
- Rechlin T. 1994. Decreased parameters of heart rate variation in amitriptyline treated patients: lower parameters in melancholic depression than in neurotic depression: a biological marker? Biol Psychiatry. 36(10):705–707.
- Regonia PR, Takamura M, Nakano T, Ichikawa N, Fermin A, Okada G, Okamoto Y, Yamawaki S, Ikeda K, Yoshimoto J. 2021. Modelling heterogeneous brain dynamics of depression and melancholia using energy landscape analysis. Front Psychiatry. 12:780997.
- Rhebergen D, Graham R, Hadzi-Pavlovic D, Stek M, Friend P, Barrett M, Parker G. 2012. The categorisation of dysthymic disorder: can its constituents be meaningfully apportioned? J Affect Disord. 143(1-3):179–186.
- Riemann D, Hohagen F, Bahro M, Berger M. 1994. Sleep in depression: the influence of age, gender and diagnostic subtype on baseline sleep and the cholinergic REM induction test with RS 86. Eur Arch Psychiatry Clin Neurosci. 243(5):279–290.
- Rothermundt M, Arolt V, Fenker J, Gutbrodt H, Peters M, Kirchner H. 2001. Different immune patterns in melancholic and non-melancholic major depression. Eur Arch Psychiatry Clin Neurosci. 251(2):90–97.
- Rothermundt M, Arolt V, Peters M, Gutbrodt H, Fenker J, Kersting A, Kirchner H. 2001. Inflammatory markers in major depression and melancholia. J Affect Disord. 63(1–3):93–102.
- Rudaz DA, Vandeleur CL, Gebreab SZ, Gholam-Rezaee M, Strippoli M-PF, Lasserre AM, Glaus J, Castelao E, Pistis G, von Känel R, et al. 2017. Partially distinct combinations of psychological, metabolic and inflammatory risk factors are prospectively associated with the onset of the subtypes of major depressive disorder in midlife. J Affect Disord. 222:195–203.
- Rush AJ, Giles DE, Roffwarg HP, Parker CR. 1982. Sleep EEG and dexamethasone suppression test findings in outpatients with unipolar major depressive disorders. Biol Psychiatry. 17(3):327–341.
- Rush AJ, Giles DE, Schlesser MA, Orsulak PJ, Parker CR, Weissenburger JE, Crowley GT, Khatami M, Vasavada N. 1996. The dexamethasone suppression test in patients with mood disorders. J Clin Psychiatry. 57(10):470–484.
- Rush AJ, Giles DE, Schlesser MA, Orsulak PJ, Weissenburger JE, Fulton CL, Fairchild CJ, Roffwarg HP. 1997. Dexamethasone response, thyrotropin-releasing hormone stimulation, rapid eye movement latency, and subtypes of depression. Biol Psychiatry. 41(9):915–928.
- Sánchez-Carro Y, de la Torre-Luque A, Leal-Leturia I, Salvat-Pujol N, Massaneda C, de Arriba-Arnau A, Urretavizcaya M, Pérez-Solà V, Toll A, Martínez-Ruiz A, et al. 2023. Importance of immunometabolic markers for the classification of patients with major depressive disorder using machine learning. Prog Neuropsychopharmacol Biol Psychiatry. 121:110674.
- Sani G, Tondo L, Undurraga J, Vazquez GH, Salvatore P, Baldessarini RJ. 2020. Melancholia: does this ancient concept have contemporary utility? Int Rev Psychiatry. 32(5–6):466–470.
- Savage GH. 1877. Cases of heart disease with melancholia. J Psychol Med Ment Pathol. 3(Pt 1):162–165.
- Schlegel S, Nieber D, Herrmann C, Bakauski E. 1991. Latencies of the P300 component of the auditory event-related potential in depression are related to the Bech-Rafaelsen Melancholia Scale but not to the Hamilton Rating Scale for depression. Acta Psychiatr Scand. 83(6):438–440.
- Selenius JS, Silveira PP, Salonen M, Kautiainen H, von Bonsdorff M, Kajantie E, Lahti J, Eriksson JG, Wasenius NS. 2021. The relationship between health-related quality of life and melancholic depressive symptoms is modified by brain insulin receptor gene network. Sci Rep. 11(1):21588.
- Shan X, Cui X, Liu F, Li H, Huang R, Tang Y, Chen J, Zhao J, Guo W, Xie G. 2021. Shared and distinct homotopic connectivity changes in melancholic and non-melancholic depression. J Affect Disord. 287:268–275.
- Shankman SA, Sarapas C, Klein DN. 2011. The effect of pre- vs. post-reward attainment on EEG asymmetry in melancholic depression. Int J Psychophysiol. 79(2):287–295.
- Shorter E, Fink M. 2010. Endocrine psychiatry: solving the riddle of melancholia. New York, NY: Oxford University Press.
- Sowa-Kućma M, Styczeń K, Siwek M, Misztak P, Nowak RJ, Dudek D, Rybakowski JK, Nowak G, Maes M. 2018. Lipid peroxidation and immune biomarkers are associated with major depression and its phenotypes, including treatment-resistant depression and melancholia. Neurotox Res. 33(2):448–460.
- Spanemberg L, Caldieraro MA, Vares EA, Wollenhaupt-Aguiar B, Kauer-Sant’Anna M, Kawamoto SY, Galvao E, Parker G, Fleck MP. 2014. Biological differences between melancholic and nonmelancholic depression subtyped by the CORE measure. Neuropsychiatr Dis Treat. 10:1523–1531.
- Spitzer RL, Endicott J, Robins E. 1978. Research diagnostic criteria: rationale and reliability. Arch Gen Psychiatry. 35(6):773–782.
- Styczeń K, Sowa-Kućma M, Siwek M, Dudek D, Reczyński W, Szewczyk B, Misztak P, Topór-Mądry R, Opoka W, Nowak G. 2017. The serum zinc concentration as a potential biological marker in patients with major depressive disorder. Metab Brain Dis. 32(1):97–103.
- Takahashi T, Nishikawa Y, Yücel M, Whittle S, Lorenzetti V, Walterfang M, Sasabayashi D, Suzuki M, Pantelis C, Allen NB. 2016. Olfactory sulcus morphology in patients with current and past major depression. Psychiatry Res Neuroimaging. 255:60–65.
- Takahashi T, Sasabayashi D, Yücel M, Whittle S, Lorenzetti V, Walterfang M, Suzuki M, Pantelis C, Malhi GS, Allen NB. 2020. Pineal gland volume in major depressive and bipolar disorders. Front Psychiatry. 11:450.
- Taylor MA, Fink M. 2006. Melancholia: the diagnosis, pathophysiology, and treatment of depressive illness. Cambridge, UK: Cambridge University Press.
- Thase ME, Hersen M, Bellack AS, Himmelhoch JM, Kupfer DJ. 1983. Validation of a Hamilton subscale for endogenomorphic depression. J Affect Disord. 5(3):267–278.
- Tsujii N, Mikawa W, Akashi H, Tsujimoto E, Adachi T, Kirime E, Takaya M, Yanagi M, Shirakawa O. 2014. Right temporal activation differs between melancholia and nonmelancholic depression: a multichannel near-infrared spectroscopy study. J Psychiatr Res. 55:1–7.
- Tsujii N, Mikawa W, Tsujimoto E, Akashi H, Adachi T, Kirime E, Shirakawa O. 2016. Relationship between prefrontal hemodynamic responses and quality of life differs between melancholia and non-melancholic depression. Psychiatry Res Neuroimaging. 253:26–35.
- Türkçapar MH, Akdemir A, Örsel SD, Demirergi N, Sirin A, Kiliç EZ, Özbay MH. 1999. The validity of diagnosis of melancholic depression according to different diagnostic systems. J Affect Disord. 54(1–2):101–107.
- Veltman EM, Lamers F, Comijs HC, Stek ML, van der Mast RC, Rhebergen D. 2018. Inflammatory markers and cortisol parameters across depressive subtypes in an older cohort. J Affect Disord. 234:54–58.
- Vogelzangs N, Comijs HC, Oude Voshaar RC, Stek ML, Penninx BWJH. 2014. Late-life depression symptom profiles are differentially associated with immunometabolic functioning. Brain Behav Immun. 41:109–115.
- Weinberg A, Liu H, Shankman SA. 2016. Blunted neural response to errors as a trait marker of melancholic depression. Biol Psychol. 113:100–107.
- Winograd-Gurvich C, Georgiou-Karistianis N, Fitzgerald PB, Millist L, White OB. 2006a. Ocular motor differences between melancholic and non-melancholic depression. J Affect Disord. 93(1–3):193–203.
- Winograd-Gurvich C, Georgiou-Karistianis N, Fitzgerald PB, Millist L, White OB. 2006b. Self-paced and reprogrammed saccades: differences between melancholic and non-melancholic depression. Neurosci Res. 56(3):253–260.
- Workman CI, Lythe KE, McKie S, Moll J, Gethin JA, Deakin JFW, Elliott R, Zahn R. 2016. Subgenual cingulate–amygdala functional disconnection and vulnerability to melancholic depression. Neuropsychopharmacology. 41(8):2082–2090.
- Wray NR, Ripke S, Mattheisen M, Trzaskowski M, Byrne EM, Abdellaoui A, Adams MJ, Agerbo E, Air TM, Andlauer TMF, et al. 2018. Genome-wide association analyses identify 44 risk variants and refine the genetic architecture of major depression. Nat Genet. 50(5):668–681.
- Yan M, Cui X, Liu F, Li H, Huang R, Tang Y, Chen J, Zhao J, Xie G, Guo W. 2021. Abnormal default-mode network homogeneity in melancholic and nonmelancholic major depressive disorder at rest. Neural Plast. 2021:6653309.
- Yan M, He Y, Cui X, Liu F, Li H, Huang R, Tang Y, Chen J, Zhao J, Xie G, et al. 2021. Disrupted regional homogeneity in melancholic and non-melancholic major depressive disorder at rest. Front Psychiatry. 12:618805.
- Yang C, Tiemessen KM, Bosker FJ, Wardenaar KJ, Lie J, Schoevers RA. 2018. Interleukin, tumor necrosis factor-α and C-reactive protein profiles in melancholic and non-melancholic depression: a systematic review. J Psychosom Res. 111:58–68.
- Zhang Y, Cui X, Ou Y, Liu F, Li H, Chen J, Zhao J, Xie G, Guo W. 2021. Differentiating melancholic and non-melancholic major depressive disorder using fractional amplitude of low-frequency fluctuations. Front Psychiatry. 12:763770.