
 ?Mathematical formulae have been encoded as MathML and are displayed in this HTML version using MathJax in order to improve their display. Uncheck the box to turn MathJax off. This feature requires Javascript. Click on a formula to zoom.
ABSTRACT
Understanding factors that affect the clustering and association of antibodies molecules in solution is critical to their development as therapeutics. For 19 different monoclonal antibody (mAb) solutions, we measured the viscosities, the second virial coefficients, the Kirkwood-Buff integrals, and the cluster distributions of the antibody molecules as functions of protein concentration. Solutions were modeled using the statistical-physics Wertheim liquid-solution theory, representing antibodies as Y-shaped molecular structures of seven beads each. We found that high-viscosity solutions result from more antibody molecules per cluster. Multi-body properties such as viscosity are well predicted experimentally by the 2-body Kirkwood-Buff quantity, G22, but not by the second virial coefficient, B22, and well-predicted theoretically from the Wertheim protein–protein sticking energy. Weakly interacting antibodies are rate-limited by nucleation; strongly interacting ones by propagation. This approach gives a way to relate micro to macro properties of solutions of associating proteins.
Introduction
Over the past several decades monoclonal antibodies (mAbs) have become one of the fastest-growing categories of therapeutics. mAbs are currently the most widely marketed biologic and the market value for mAbs is predicted to exceed $300 billion in 2025.Citation1 They are used to treat cancers, autoimmunity diseases, metabolic disorders and emerging infectious diseases. This broad range of applicability is due to their high binding affinity and specificity, long circulation half-life, and easy manufacturing.Citation1,Citation2 Unlike most traditional drugs, biological therapeutics are delivered to patients as liquids.Citation3 For mAbs to be effective for therapeutic use, they need to be administered to a patient in a relatively large dose. For subcutaneous injection, the maximum volume that can be delivered per dose in such cases is limited, thus requiring high mAb concentrations (e.g., as high as 175–200 mg/ml).Citation4 High viscosity of antibody solutions at these concentrations causes difficulties in manufacturing and administration of these therapeutics.Citation4–6
In formulating biological drugs, it is desirable to create solutions that have high antibody concentrations and yet low viscosities, implying minimal association. We are interested in how the macroscale properties of liquid solutions of proteins, particularly monoclonal antibody (mAb) molecules, arise from their underlying intermolecular interactions. In several previous studies, it was observed that antibody association correlates with net hydrophobicity and hydrophobic patches,Citation7,Citation8 with net charge on the proteins,Citation7–9 and with charge asymmetry.Citation10 For example, by taking into account the hydrophobicity and charge of the amino acids in the protein sequence, Sankar et al. developed an algorithm called AggScore that identifies aggregation-prone regions in several well-studied proteins.Citation11 Mutational studies show that protein aggregation propensity correlates with positively charged surface residues (the more positive protein surfaces are, the less soluble the proteins are), the ratio of lysine to arginine content, and exposed hydrophobic patches.Citation12 While net charge matters, the distribution of charges, for example reflected in the dipole moment,Citation13 particularly at high mAb concentrations is also important.Citation14,Citation15
Past insights into the intermolecular interactions in protein associations have come from: (1) experiments on solution viscosities, liquid–liquid phase equilibria, second virial coefficients, and scattering structure factorsCitation9,Citation16–18; (2) atomistic molecular simulations (often by Molecular Dynamics, MD) using physics-based forcefields with appropriate solvation modelsCitation16,Citation17,Citation19–22; and (3) coarse-grained statistical mechanical solution theories.Citation23–27 Here, we combine coarse-grained Wertheim thermodynamic perturbation theoryCitation28,Citation29 with experimental data provided by Regeneron on 19 mAb systems. This Wertheim approach offers advantages over atomistic simulations, as it gives solution properties, such as viscosities, liquid phase properties and virial coefficients that are too computationally challenging for atomistic simulations. It also goes beyond experimental data alone in giving insights into cluster distributions and the energies and entropies that drive them. These quantities are otherwise difficult to determine. For example, for determination of cluster size distribution, experimental techniques, such as composition-gradient multi-angle static light scattering (CG-MALS),Citation30 and analytical ultracentrifugationCitation31 are commonly used, but both require calibration standards, are limited with the detector resolution, the separation techniques are known to alter the nature of sample components, and the interpretation of the results is model dependent. Alternatively, attempts have been made to determine the cluster distribution in protein solutions using coarse-grained computer simulations.Citation17,Citation20,Citation32–34 The computer simulations, however, are time-consuming, and their results depend on the protein model. Statistical mechanics on the other hand provides the basis for calculating the protein cluster size distribution quickly, and accurately. Below, we first describe our theoretical approach.
Methods
The 7-bead wertheim model of antibody association
Liquid-state statistical mechanics theories are recipes for computing macroscale solution properties from the microscale interactions of the underlying molecules. However, protein solutions pose two challenges for such approaches: (1) they often treat the solute (protein) as spheres, having minimal structure-property relationships and (2) such theories are usually low-density expansions dominated by few-particle interactions. Yet, proteins are often associated into multi-protein clusters. To address these two problems, we have recentlyCitation25,Citation26 applied the Wertheim solution theory of strongly associating liquidsCitation28 and we represent the molecular structure at a course-grained level; each antibody molecule has 7 beads forming a Y shape; see Kastelic et al.Citation27 (). The model can then be treated with the associative Wertheim thermodynamic perturbation theoryCitation28,Citation29 to obtain the free energy, and related thermodynamic properties, as well as cluster size distribution.The latter can be, in combination with relations from polymer physics converted to the solution viscosity.Citation27,Citation32 The model and theory have been successfully used to analyze the viscosity data of mAb solutions at different conditions, and in the presence of different excipients.Citation27,Citation32 At the moment, however, the model, in-spite its successes, is missing its predictive value; the parameters for the model, as well as those for evaluating the contribution of different size aggregates to viscosity, were obtained by fitting the theoretical results to the experimental data. Details of 7-bead Wertheim theory are given in the SI.
Figure 1. 7-bead model of antibody associations.
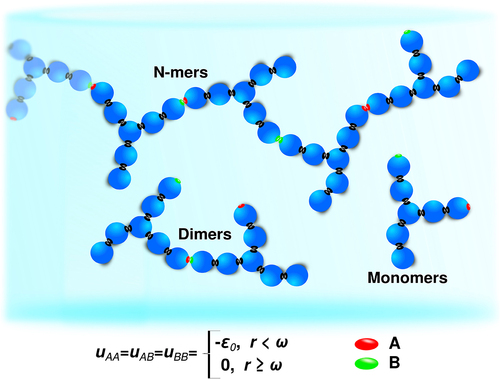
Red and green patches are interaction sites through which molecules attract each-other via square-well attractive potential.Citation27 The gray patches represent infinite attractive interaction providing the hard spheres to be glued together, and forming a Y-shape molecule characteristic for antibodies. All the spheres are of the same size, and namely of diameter 2 nm to add up to the hydrodynamic radius of 5 nm as observed experimentally (RH = 2.5σ). Following the experimental findings, molecules self-associate only through A and B interaction sites that are of the same strength (symmetric antibody molecule). uKK represents the interactions strength between two k interaction sites on the protein surface that are separated by a distance r.
Here is how we apply the 7-bead Wertheim theory in the present work. First, we require an interaction distance (ω), which we take to be the same as in previous work (namely, ω = 0.18 nm which roughly corresponds to the length of a hydrogen bond.Citation27 Next, in full generality, the theory allows for three different types of interactions: AA, BB, and AB. Here, given that the data does not give sufficient granularity, we assume only a single type of energetic attractive interaction: εAA = εAB = ε0. The attractive interactions between molecules being the cause for the self-association process leading to the formation of different size clusters in the solution, we have used the experimentally determined cluster-size distributions of the 19 mAb at low concentrations as a reference, and adjusted the interaction strength parameter to obtain the best agreement between theoretical and experimental data. This was shown previously to give excellent results for systems with strongly attractive directional forces, such as proteins and antibodies.Citation28,Citation29
We are interested in the populations, P(n), i.e., the mass fractions of the different clusters containing n antibody molecules each. The results are shown in Figure S1, and the set of interaction parameters is given in Table S1. Then, from P(n) we compute the viscosities usingCitation12:
where η0 is the viscosity of the solvent, γ is the mass concentration of the solution, and where c, and d are constants describing how clusters contribute to viscosity. This model has been found to successfully describe the viscosities of antibody solutions of different pH, and with different salt concentrations, and different excipients.Citation17,Citation20,Citation27,Citation32 In previous work different sets of c and d values have been used, obtained by fitting the calculated viscosity to experimental data. In the procedure, the interaction parameter, ε0, and c and d values have been simultaneously modified, not considering the information regarding the experimental cluster distribution. In this work we have used the experimental cluster distributions from this work, as well as the ones obtained previously through combining SAXS measurements and computer simulations,Citation32,Citation33 and determined the c and d parameters in the EquationEquation (1)(1)
(1) to properly transfer the cluster distributions to the experimentally determined viscosities. An important finding was that the c and d parameters are universal, not depending on the mAb, neither on the conditions in the solution. The values obtained were c=(0.017 ± 0.003)mL/mg, d=(0.5 ± 0.1), and allow a reliable conversion of cluster-size distribution to viscosities (± indicates the standard deviation throughout the text.). The values previously used to calculate the viscosity for a 7-bead model (c = 0.01205 mL/mg, and d = 0.3762)Citation27 also fall within the determined values.
To further interpret these values, we first rewrite EquationEquation (1)(1)
(1) in a form similar to Mooney’s well-known empirical viscosity equation for hard spheresCitation35 in which
is proportional to
, (
is the intrinsic viscosity of n-mer cluster, and Φn is its volume fraction):
where γn = γP (n) and represents the mass concentration of a cluster consisting of n monomers. Comparing the two expressions we can see that nd plays the role of the intrinsic viscosity, [η], which is, for a n-mer cluster at low shear rates, written asCitation34 [η]n ∝ n(3−df)/df.Citation34 df is the so-called fractal dimension which has values between 1 (for linear clusters), and 3 (for compact spherical clusters),Citation36 corresponding to values of d between 0.5 (linear clusters), and 0 (spherical clusters). Our value 0.5 implies the presence of extended linear clusters in the solutions which is consistent with our model. Constant c, on the other hand, can be considered as a sort of proportionality constant, and is related to the intrinsic viscosity of the monomers. Our value 0.017 mL/mg is close to the experimentally obtained intrinsic viscosity, which has been found to be around 0.01 mL/mg for various mAbs.Citation37,Citation38 The importance of the cluster shape for the viscosity of the mAb solutions has also recently been shown by Dandekar et al.Citation39
Results
This model captures well the experimental antibody viscosity curves
The solution viscosities computed by the 7-bead Wertheim theory with the experimental data on Regeneron’s 19 antibody systems are shown in .
Figure 2. Viscosities as a function of antibody concentrations. In all cases the lines represent the results for the model, and the symbols were obtained experimentally. For each sample, the viscosity has been measured 10 times, the results given are arithmetic averages, the error bars approximately corresponding to the size of the symbols. All results applied to mAbs in pure water at 293 K.
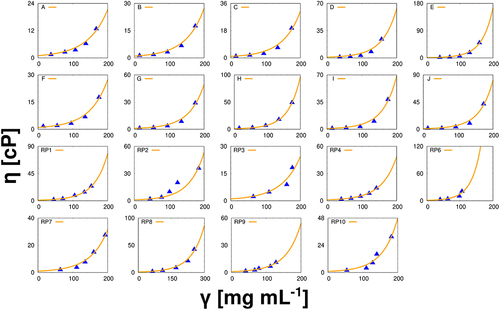
For all 19 mAbs, an excellent agreement between experimental and theoretical viscosities is obtained, which enabled us to use the information about the cluster distribution from the theory for further insights into the mechanism of cluster formation in mAb solutions.
Bigger clusters contribute more to the viscosity
Our modeling predicts that different antibodies have different distributions of cluster sizes (; see the Supporting Information (SI) for all 19 systems).
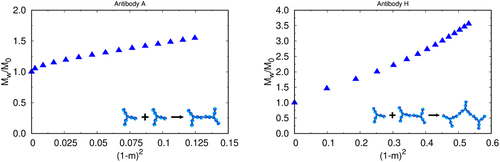
Figure 3. Cluster size distribution vs. protein concentration. Theoretical predictions for normalized mass fraction distribution of clusters of size n, P(n) for our model as a function of concentration for two mAbs (A – left, and H – right). The results for all mAbs studied here are given in SI (fig SI 2).
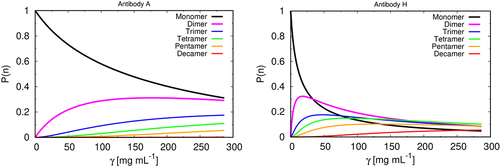
Two antibodies, A and H, show the paradigmatic extremes among the 19 systems we studied. Although mAbs A and H belong to the same antibody isotype, IgG1, A-like molecules form mostly monomers and dimers over the full concentration range, whereas H-like molecules form higher-order clusters at higher concentrations. Both scenarios occur regardless to the mAb class, IgG1 (mAbs A, F, and H, and RP7, RP8, RP9, and RP10), or IgG4 (mAbs B, C, D, E, G, I, and J, and RP1, RP2, RP3, RP4, and RP6), confirming predictions that the Fc region of mAbs plays a minor role in protein–protein interaction. Confirmation of this observation lies in the fact that Fc regions of the remaining mAbs do not differ significantly from each other, but nevertheless these antibodies clearly show different viscosities.
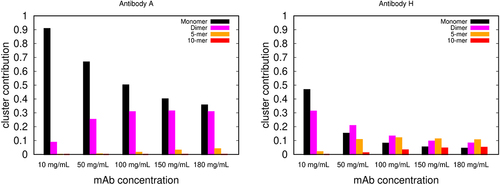
shows the more granular breakdown from the model of how much each of the cluster types contributes to the viscosity (all 19 are given in Figure S3). All results of cluster sizes vs. viscosity simply reflect the intermolecular interaction strength (weaker in A-like antibodies, stronger in H-like antibodies).
Figure 4. The relative contributions of different-sized clusters to viscosity. Predictions of the wertheim model for the relative contributions of protein monomers, dimers, 5-mers and 10-mers to the solution viscosities, vs protein concentration, for mAb A, and mAb H. The contributions to the viscosity of other size clusters (trimers to 9-mers, and higher order oligomers) are not shown in the figure.
Cluster-size distributions reflect their kinetic assembly mechanism
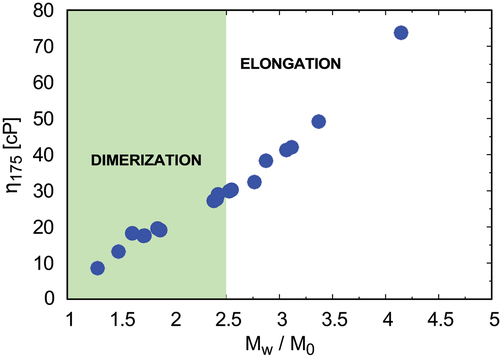
Roberts et al. have shown how cluster-size distributions in protein solutions can be related to their kinetic mechanisms of cluster formation through the Lumry – Eyring nucleated polymerization theory.Citation40,Citation41 In short, the rate limiting step to cluster formation can either be the nucleation step or the elongation step. According to this theory, the aggregate growth mechanism can be determined from a plot of the weight average molecular weight, including monomers and aggregates in solution, Mtot/Mmon vs (1−m)Citation2 (m is the fraction of monomers, compared to the initial value, Mtot is the total weight-average molecular weight, w and Mmon is the monomer molecular weight.Citation41 When this plot is linear, it means aggregates grow primarily through monomer addition to an already existing aggregate (the so-called chain polymerization (CP) case). Otherwise, the mechanism is nucleation dominated (ND) and the aggregates do not reach sizes larger than dimers and small oligomers. An upturn in these types of plots represents the growth of aggregates by aggregate – aggregate condensation polymerization (AP).Citation41 shows Lumry – Eyring plots, computed in the 7-bead Wertheim model, for antibodies A and H (remainder are shown in Figure S4).
Figure 5. Lumry – Eyring plots for learning the rate-limiting steps of formation, for mAb a (left) and mAb H (right) as obtained by our model treated with wertheim perturbation theory. A forms by the ND mechanism, while H forms from the CP mechanism.
For mAb A, the clusters form directly from monomers (ND), so dimers prevail in the solution. For mAb H, the clusters form by elongation (CP), where new monomers preferentially bind to already formed chains rather than to other monomers. By analyzing the data for all 19 mAbs studied in this work we found that the nucleation dominant mechanism gives lower viscosities, while elongation mechanism gives larger viscosity increases with protein concentration (). One implication is that viscosity could be reduced by energetically or sterically restricting one Fab arm, which would limit its ability to propagate in growing chains.
Figure 6. Solutions of lower viscosities are nucleation-rate-limited; higher viscosities are propagation limited, as determined from Lumry – Eyring plots. For mAbs A, B, F, C, RP3, RP7, and RP8, nucleation is the dominant mechanism for cluster formation. For mAbs G, D, I, J, H, E, RP1, RP2, RP4, RP6, RP9, and RP10, elongation following initial dimerization is rate limiting.
Discussion
Predicting concentrated solutions from dilute-solution measurements
The ability to interpret multi-body properties of colloid solutions in terms of 2-body properties that can be measured or modeled more easily and in dilute solutions has long been desired. Could we predict liquid-phase equilibria and viscosities, for example, from simply knowing pairwise protein interactions in dilute solutions through measuring the second virial coefficient, B22, or obtained from the scattering of light or neutrons, or from equilibrium analytical ultracentrifugation, self-interaction chromatography, or osmotic pressure experiments.Citation22,Citation42–46B22 can be expressed as an integral over solute–solute pair distribution function, g22, in the limit of low solute concentrationCitation47:
where u22 is the orientation-averaged pair potential between two solute (protein) molecules. Negative B22 values indicate a net attraction while positive values indicate protein-protein repulsion.Citation43 However, B22 is sometimes considered a surrogate simple measurement that could predict higher-concentration behaviors, a more principled quantity for higher concentrations is the corresponding Kirkwood – Buff integral, G22:
where u22 is replaced by the potential of mean force, W22, and <g22(r)> is the average molecular pair correlation function.Citation9,Citation13,Citation19,Citation42,Citation43,Citation48,Citation49 Similarly as B22, negative values of -G22 indicate a net attraction while positive values indicate net protein–protein repulsion. As such, the protein–protein Kirkwood-Buff integral is a measure of the net protein–protein interaction strength in the solvent.Citation50 In short, the difference is that B22 describes two proteins interacting in the absence of solvent while G22 describes the interactions in the presence of solvent.
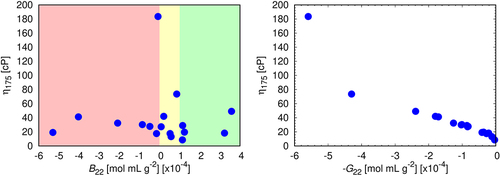
(and Table S2) tests whether either of these two pairwise quantities, B22 or G22, is a predictor of solution viscosities for our set of 19 antibodies at the mAb concentration of 175 mg/mL. The results shown here are clear: G22 is an excellent predictor of concentrated solution viscosities, while B22 is not correlated at all. This result is consistent with earlier work Citation9,Citation13,Citation19,Citation42,Citation48,Citation49 and indicates the importance of using the Kirkwood-Buff integral, G22, which can be determined by static light scatteringCitation13 or SAXS/SANS measurements.Citation33 This is consistent with the findings of Ghosh et al.,Citation49 and Barnett et al.,Citation51 who found G22 may offer semiquantitative means to predict aggregation mechanism
Figure 7. Left: B22 is not predictive of solution viscosities. Right: G22 is predictive. Correlations between experimental viscosities at mAb concentration 175 mg/mL. The colors indicate ranges of B22 that are experimentally considered for classification of colloidal stability of antibodies: green – repulsive, yellow – near ideal, red – attractive. For each sample, B22 has been measured in triplicates, the error bars approximately corresponding to the size of the symbols.
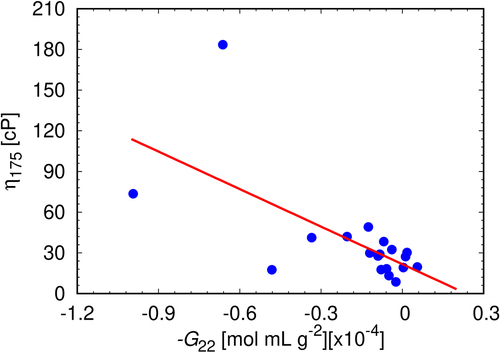
To test the possible importance of G22, as a predictor of solution viscosities, the coefficient was determined experimentally for all 19 mAbs under investigation at different mAb concentrations. We determined that the G22 remains approximately constant above mAb concentration 80 mg/mL (the results are for concentration 80 mg/mL given in Table S2, and the concentration dependence in Figure S5). This indicates that the net protein–protein interaction remains constant beyond this concentration. From it can be seen that, as predicted by our theory, the viscosities at high mAb concentration are correlated to G22, indicating the importance of the mAb-mAb interactions that are beyond pair-wise ones.
Figure 8. The correlation between experimental viscosities at mAb concentration 175 mg/mL and experimentally determined G22 coefficients at mAb concentration 80 mg/mL. For each sample, G22 has been measured in triplicates, the error bars approximately corresponding to the size of the symbols. The linear fit (red line) is represented by the equation y = −92.25x + 21.66; Pearson’s r = −0.65.
What types of interaction dominate antibody associations in solution?
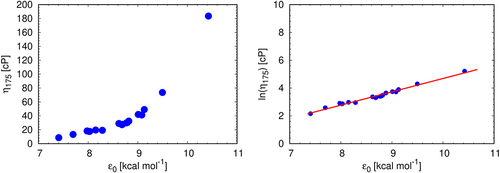
Our 7-bead Wertheim model has one parameter, ε0, representing the protein–protein short-ranged attraction energy between the particular sites indicated in . First we note, as shows, that predicted solution viscosities correlate quite well with this interaction strength. In particular, it can be well fit using the relationship: ln(η(175 mg/mL)/cP) = −4.902 + 0.9588 (ε0/(kcal/mol)) (similar relationships can be obtained for other mAb concentrations).
Figure 9. Solution viscosities correlate with, ε0, the protein-protein affinity of the model at mAb concentration 175 mg/mL. Pearson’s r for the right panel is 0.99.
In this way, the Wertheim theory reduces the prediction of macroscopic solution behavior to the microscopics of the intermolecular interactions through a single fitting parameter, the attraction strength. Interestingly, the above relation resembles the shear viscosity model where viscosity is a thermally activated process in which a molecule, in order to move to a neighboring free space, has to overcome activation energy barrier, Ea, created by the resistance of the surrounding building units (ln(η) = lnAs + Ea/RT).Citation42,Citation52,Citation53 Within this theory our association parameter reflects the microstructure of the solution, its configurational entropy in particular (e.g. the configurational entropy of the solution is inversely proportional to activation energy,Citation54 and could in principle be determined from the temperature dependence of the solution viscosity. We will investigate this further in our future work.
Even though the interaction parameter of our model only describes an average local interaction, and as a single parameter cannot comprise different types of interactions known to define the colloidal stability of protein solutions, the parameter was found to be directly correlated to the high concentration solution viscosity (). Several studies exist where this quantity has been predicted from the above mentioned mAb properties. We therefore examined the possible correlations between the physical properties of the 19 mAbs studied here, and the interaction parameter of our model; details are given in SI. Even though previous studies that combine homology modeling with different machine learning techniques have found correlations with mAb molecule properties, such as hydrophobicity, charge symmetry, and net charge,Citation2,Citation9,Citation10,Citation12,Citation55–58 no conclusive correlations are observed here, even when each mAb isotype is evaluated separately (see SI for details).
Conclusions
We studied the association of monoclonal antibody molecules in liquid solutions, through comprehensive experiments on 19 systems combined with a 7-bead liquid statistical mechanics theory. Some antibodies are stickier than others. The stickiest ones tend to associate into larger clusters, leading to disproportionately higher-viscosity solutions. Viscosities and other multi-body properties can be anticipated quantitatively through experiments on simpler protein pairwise properties in dilute solution, such as the Kirkwood-Buff property, G22. Correspondingly, the sticking energy quantity in the theory is also directly, but nonlinearly, predictive of multi-body properties. Finally, when combined with the Lumry-Eyring theory, we can predict the kinetic cluster formation mechanism. Weak binders tend to be nucleation-rate-limited and strong binders are propagation-rate-limited.
Supporting information
Supporting information consists of details on experimental procedures, additional theoretical background, additional figures of our detailed mAb analysis and also results of homology modeling.
Supplemental Material
Download MS Word (2.5 MB)Acknowledgments
S.B., K.A.D., and B.H.-L. acknowledge the support from the National Institutes of Health (NIH) RM1 award “Solvation modeling for next-gen biomolecule simulations” (grant No. RM1GM135136).
Disclosure statement
No potential conflict of interest was reported by the author(s).
Supplementary material
Supplemental data for this article can be accessed online at https://doi.org/10.1080/19420862.2024.2339582
Additional information
Funding
References
- El Abd Y, Tabll A, Smolic R, Smolic M. Mini-review: the market growth of diagnostic and therapeutic monoclonal antibodies – SARS CoV-2 as an example. Hum Antibodies. 2022;30(1):15–9. doi:10.3233/HAB-211513.
- Li W, Prabakaran P, Zao Chen W, Zhu Z, Feng Y, Dimitrov DS. Antibody aggregation: insights from sequence and structure. Antibodies. 2016;5(3):19. doi:10.3390/antib5030019.
- Anselmo AC, Mitragotri S. An overview of clinical and commercial impact of drug delivery systems. J Control Release. 2014;190:15–28. doi:10.1016/j.jconrel.2014.03.053.
- Roberts CJ. Protein aggregation and its impact on product quality. Curr Opin Biotechnol. 2014;30:211–17. doi:10.1016/j.copbio.2014.08.001.
- Kanai S, Liu J, Patapoff TW, Shire SJ. Reversible self-association of a concentrated monoclonal antibody solution mediated by fab–fab interaction that impacts solution viscosity. J Pharm Sci. 2008;97(10):4219–27. doi:10.1002/jps.21322.
- Page S, Khan T, Kühl P, Schwach G, Storch K, Chokshi H. Patient centricity driving formulation innovation: improvements in patient care facilitated by novel therapeutics and drug delivery technologies. Annu Rev Pharmacol Toxicol. 2022;62(1):341–63. PMID: 34990203. doi: 10.1146/annurev-pharmtox-052120-093517.
- Meyer RM, Berger L, Nerkamp J, Scheler S, Nehring S, Friess W. Identification of monoclonal antibody variants involved in aggregate formation – part 1: charge variants. Eur J Pharm Biopharm. 2021;158:123–31. doi:10.1016/j.ejpb.2020.10.020.
- Meyer RM, Berger L, Nerkamp J, Scheler S, Nehring S, Friess W. Identification of monoclonal antibody variants involved in aggregate formation – part 2: hydrophobicity variants. Eur J Pharm Biopharm. 2021;160:134–42. doi:10.1016/j.ejpb.2021.01.006.
- Woldeyes MA, Qi W, Razinkov VI, Furst EM, Roberts C. How well do low- and high-concentration protein interactions predict solution viscosities of monoclonal antibodies? J Pharm Sci. 2019;108(1):142–54. doi:10.1016/j.xphs.2018.07.007.
- Sharma VK, Patapoff TW, Kabakoff B, Pai S, Hilario E, Zhang B, Li C, Borisov O, Kelley RF, Chorny I. et al. In silico selection of therapeutic antibodies for development: viscosity, clearance, and chemical stability. Proc Natl Acad Sci USA. 2014;111(52):18601–06. doi:10.1073/pnas.1421779112.
- Sankar K, K SR Jr., Carl SM, Day T, Maier JKX. AggScore: prediction of aggregation-prone regions in proteins based on the distribution of surface patches. Proteins. 2018;86(11):1147–56. doi:10.1002/prot.25594.
- Kuroda D, Tsumoto K. Engineering stability, viscosity, and immunogenicity of antibodies by computational design. J Pharm Sci. 2020;109(5):1631–51. doi:10.1016/j.xphs.2020.01.011.
- Calero-Rubio C, Saluja A, Sahin E, Roberts CJ. Predicting high-concentration interactions of monoclonal antibody solutions: comparison of theoretical approaches for strongly attractive versus repulsive conditions. J Phys Chem B. 2019;123(27):5709–20. doi:10.1021/acs.jpcb.9b03779.
- Yadav S, Shire SJ, Kalonia DS. Factors affecting the viscosity in high concentration solutions of different monoclonal antibodies. J Pharm Sci. 2010;99(12):4812–29. doi:10.1002/jps.22190.
- Ferreira GM, Shahfar H, Sathish HA, R RL Jr., Roberts CJ. Identifying key residues that drive strong electrostatic attractions between therapeutic antibodies. J Phys Chem B. 2019;123(50):10642–53. doi:10.1021/acs.jpcb.9b08355.
- Shahfar H, Forder JK, Roberts CJ. Toward a suite of coarse-grained models for molecular simulation of monoclonal antibodies and therapeutic proteins. J Phys Chem B. 2021;125(14):3574–88. doi:10.1021/acs.jpcb.1c01903.
- Chowdhury A, Bollinger JA, Dear BJ, Cheung JK, Johnston KP, Truskett TM. Coarse-grained molecular dynamics simulations for understanding the impact of short-range anisotropic attractions on structure and viscosity of concentrated monoclonal antibody solutions. Mol Pharmaceutics. 2020;17(5):1748–56. doi:10.1021/acs.molpharmaceut.9b00960.
- Lanzaro A, Roche A, Sibanda N, Corbett D, Davis P, Shah M, Pathak JA, Uddin S, van der Walle CF, Yuan X-F. et al. Cluster percolation causes shear thinning behavior in concentrated solutions of monoclonal antibodies. Mol Pharmaceutics. 2021;18(7):2669–82. doi:10.1021/acs.molpharmaceut.1c00198.
- Calero-Rubio C, S A, Roberts CJ. Coarse-grained antibody models for “weak” protein–protein interactions from low to high concentrations. J Phys Chem B. 2016;120(27):6592–605. doi:10.1021/acs.jpcb.6b04907.
- Chowdhury A, Guruprasad G, Chen AT, Karouta CA, Blanco MA, Truskett TM, Johnston KP. Protein-protein interactions, clustering, and rheology for bovine IgG up to high concentrations characterized by small angle X-Ray scattering and molecular dynamics simulations. J Pharm Sci. 2020;109(1):696–708. doi:10.1016/j.xphs.2019.11.001.
- Skar-Gislinge N, Ronti M, Garting T, Rischel C, Schurtenberger P, Zaccarelli E, Stradner A. A colloid approach to self-assembling antibodies. Mol Pharmaceutics. 2019;16(6):2394–404. doi:10.1021/acs.molpharmaceut.9b00019.
- Ferreira GM, Calero-Rubio C, Sathish HA, R RL Jr., Roberts CJ. Electrostatically mediated protein-protein interactions for monoclonal antibodies: a combined experimental and coarse-grained molecular modeling approach. J Pharm Sci. 2019;108(1):120–32. doi:10.1016/j.xphs.2018.11.004.
- Izadi S, Patapoff TW, Walters BT. Multiscale coarse-grained approach to investigate self-association of antibodies. Biophys J. 2020;118(11):2741–54. doi:10.1016/j.bpj.2020.04.022.
- Chaudhri A, Zarraga IE, Kamerzell TJ, Brandt JP, Patapoff TW, Shire SJ, Voth GA. Coarse-grained modeling of the self-association of therapeutic monoclonal antibodies. J Phys Chem B. 2012;116(28):8045–57. doi:10.1021/jp301140u.
- Kastelic M, Kalyuzhnyi YV, Hribar-Lee B, Dill KA, Vlachy V. Protein aggregation in salt solutions. Proc Natl Acad Sci USA. 2015;112(21):6766–70. doi:10.1073/pnas.1507303112.
- Kastelic M, Kalyuzhnyi YV, Vlachy V. Modeling phase transitions in mixtures of β–γ lens crystallins. Soft Matter. 2016;12(35):7289–98. doi:10.1039/C6SM01513A.
- Kastelic M, Dill KA, Kalyuzhnyi YV, Vlachy V. Controlling the viscosities of antibody solutions through control of their binding sites. J Mol Liq. 2018;270:234–42. Modern trends in theory of electrolyte solutions. In memory of Lesser Blum. doi:10.1016/j.molliq.2017.11.106.
- Wertheim MS. Fluids of dimerizing hard spheres, and fluid mixtures of hard spheres and dispheres. J Chem Phys. 1986;85(5):2929–36. doi:10.1063/1.451002.
- Brudar S, Hribar-Lee B. Effect of buffer on protein stability in aqueous solutions: a simple protein aggregation model. J Phys Chem B. 2021;125(10):2504–12. doi:10.1021/acs.jpcb.0c10339.
- Gentiluomo L, Roessner D, Streicher W, Mahapatra S, Harris P, Frieß W. Characterization of native reversible self-association of a monoclonal antibody mediated by fab-fab interaction. J Pharm Sci. 2020;109(1):443–51. doi:10.1016/j.xphs.2019.09.021.
- Lebowitz J, Lewis MS, Schuck P. Modern analytical ultracentrifugation in protein science: A tutorial review. Protein Sci. 2002;11(9):2067–79. doi:10.1110/ps.0207702.
- Dear BJ, Bollinger JA, Chowdhury A, Hung JJ, Wilks LR, Karouta CA, Ramachandran K, Shay TY, Nieto MP, Sharma A. et al. X-ray scattering and coarse-grained simulations for clustering and interactions of monoclonal antibodies at high concentrations. J Phys Chem B. 2019;123(25):5274–90. doi:10.1021/acs.jpcb.9b04478.
- Hung JJ, Dear BJ, Karouta CA, Chowdhury AA, Godfrin PD, Bollinger JA, Nieto MP, Wilks LR, Shay TY, Ramachandran K. et al. Protein–protein interactions of highly concentrated monoclonal antibody solutions via static light scattering and influence on the viscosity. J Phys Chem B. 2019;123(4):739–55. doi:10.1021/acs.jpcb.8b09527.
- Chowdhury A, Manohar N, Guruprasad G, Chen AT, Lanzaro A, Blanco M, Johnston KP, Truskett TM. Characterizing experimental monoclonal antibody interactions and clustering using a coarse-grained simulation library and a viscosity model. J Phys Chem B. 2023;127(5):1120–37. doi:10.1021/acs.jpcb.2c07616.
- Mooney M. The viscosity of a concentrated suspension of spherical particles. J Colloid Sci. 1951;6(2):162–70. doi:10.1016/0095-8522(51)90036-0.
- Lazzari S, Nicoud L, Jaquet B, Lattuada M, Morbidelli M. Fractal-like structures in colloid science. Adv Colloid Interface Sci. 2016;235:1–13. doi:10.1016/j.cis.2016.05.002.
- Roche A, Gentiluomo L, Sibanda N, Roessner D, Friess W, Trainoff SP, Curtis R. Towards an improved prediction of concentrated antibody solution viscosity using the Huggins coefficient. J Colloid Interface Sci. 2022;607:1813–24. doi:10.1016/j.jcis.2021.08.191.
- Pindrus MA, Shire SJ, Yadav S, Kalonia DS. Challenges in determining intrinsic viscosity under low ionic strength solution conditions. Pharm Res. 2017;34(4):836–46. doi:10.1007/s11095-017-2112-8.
- Dandekar R, Ardekani AM. New model to predict the concentration-dependent viscosity of monoclonal antibody solutions. Mol Pharm. 2021;18(12):4385–92. PMID: 34699237. doi: 10.1021/acs.molpharmaceut.1c00561.
- Li Y, Roberts CJ. Lumry-eyring nucleated-polymerization model of protein aggregation kinetics. 2. Competing growth via condensation and chain polymerization. J Phys Chem B. 2009;113(19):7020–32. doi:10.1021/jp8083088.
- Kim N, Remmele RLJ, Liu D, Razinkov VI, Fernandez EJ, Roberts CJ. Aggregation of anti-streptavidin immunoglobulin gamma-1 involves fab unfolding and competing growth pathways mediated by pH and salt concentration. Biophys Chem. 2013;172:26–36. doi:10.1016/j.bpc.2012.12.004.
- Woldeyes MA, Qi W, Razinkov VI, Furst EM, Roberts CJ. Temperature dependence of protein solution viscosity and protein–protein interactions: insights into the origins of high-viscosity protein solutions. Mol Pharmaceutics. 2020;17(12):4473–82. doi:10.1021/acs.molpharmaceut.0c00552.
- Quigley A, Williams D. The second virial coefficient as a predictor of protein aggregation propensity: a self-interaction chromatography study. Eur J Pharm Biopharm. 2015;96:282–90. doi:10.1016/j.ejpb.2015.07.025.
- Li Y, Ogunnaike BA, Roberts CJ. Multi-variate approach to global protein aggregation behavior and kinetics: effects of pH, NaCl, and temperature for alpha-chymotrypsinogen A. J Pharm Sci. 2010;99(2):645–62. doi:10.1002/jps.21869.
- Lilyestrom WG, Yadav S, Shire SJ, Scherer TM. Monoclonal antibody self-association, cluster formation, and rheology at high concentrations. J Phys Chem B. 2013;117(21):6373–84. doi:10.1021/jp4008152.
- Pathak JA, Nugent S, Bender MF, Roberts CJ, Curtis RJ, Douglas JF. Comparison of huggins coefficients and osmotic second virial coefficients of buffered solutions of monoclonal antibodies. Polymers. 2021;13(4):601. doi:10.3390/polym13040601.
- Roberts CJ, Das TK, Sahin E. Predicting solution aggregation rates for therapeutic proteins: approaches and challenges. Int J Pharm. 2011;418(2):318–33. A priori Performance Predictions. doi: 10.1016/j.ijpharm.2011.03.064.
- Woldeyes MA, Calero-Rubio C, Furst EM, Roberts CJ. Predicting protein interactions of concentrated globular protein solutions using colloidal models. J Phys Chem B. 2017;121(18):4756–67. doi:10.1021/acs.jpcb.7b02183.
- Ghosh R, Calero-Rubio C, Saluja A, Roberts CJ. Relating protein–protein interactions and aggregation rates from low to high concentrations. J Pharm Sci. 2016;105(3):1086–96. doi:10.1016/j.xphs.2016.01.004.
- Blanco MA, Perevozchikova T, Martorana V, Manno M, Roberts CJ. Protein–protein interactions in dilute to concentrated solutions: α-chymotrypsinogen in acidic conditions. J Phys Chem B. 2014;118(22):5817–31. doi:10.1021/jp412301h.
- Barnett GV, Razinkov VI, Kerwin BA, Laue TM, Woodka AH, Butler PD, Perevozchikova T, Roberts CJ. Specific-ion effects on the aggregation mechanisms and protein-protein interactions for anti-streptavidin immunoglobulin gamma-1. J Phys Chem B. 2015;119(18):5793–804. doi:10.1021/acs.jpcb.5b01881.
- Avramov I. Viscosity activation energy. Phys Chem Glas: Eur J Glass Sci Technol B. 2007;48:61–63.
- Loskutov VV. Concentration dependence of the viscosity activation energy of aqueous ethylene glycol mixtures. J Solution Chem. 2021;50(3):427–42. doi:10.1007/s10953-021-01069-4.
- Toplis MJ. Quantitative links between microscopic properties and viscosity of liquids in the system SiO2–Na2O. Chem Geol. 2001;174(1–3):321–31. doi:10.1016/S0009-2541(00)00323-5.
- Tomar DS, Kumar S, Singh SK, Goswami S, Li L. Molecular basis of high viscosity in concentrated antibody solutions: strategies for high concentration drug product development. Mabs-austin. 2016;8(2):216–28. doi:10.1080/19420862.2015.1128606.
- Chennamsetty N, Voynov V, Kayser V, Helk B, Trout BL. Prediction of aggregation prone regions of therapeutic proteins. J Phys Chem B. 2010;114(19):6614–24. doi:10.1021/jp911706q.
- Lai P-K, Fernando A, Cloutier TK, Gokarn YR, Zhang J, Schwenger WJ, Chari RVJ, Calero-Rubio C, Trout BL. Machine learning applied to determine the molecular descriptors responsible for the viscosity behavior of concentrated therapeutic antibodies. Mol Pharmaceutics. 2021;2021(3):1167–75. doi:10.1021/acs.molpharmaceut.0c01073.
- Norman RA, Ambrosetti F, Bonvin AM, Colwell LJ, Kelm S, Kumar S, Krawczyk K. Computational approaches to therapeutic antibody design: established methods and emerging trends. Brief Bioinform. 2020;21(5):1549–67. doi:10.1093/bib/bbz095.