
ABSTRACT
Peptide mapping with mass spectrometry (MS) is an important tool for protein characterization in the biopharmaceutical industry. Historically, peptide mapping monitors post-translational modifications (PTMs) of protein products and process intermediates during development. Multi-attribute monitoring (MAM) methods have been used previously in commercial release and stability testing panels to ensure control of selected critical quality attributes (CQAs). Our goal is to use MAM methods as part of an overall analytical testing strategy specifically focused on CQAs, while removing or replacing historical separation methods that do not effectively distinguish CQAs from non-CQAs due to co-elution. For example, in this study, we developed a strategy to replace a profile-based ion-exchange chromatography (IEC) method using a MAM method in combination with traditional purity methods to ensure control of charge variant CQAs for a commercial antibody (mAb) drug product (DP). To support this change in commercial testing strategy, the charge variant CQAs were identified and characterized during development by high-resolution LC-MS and LC-MS/MS. The charge variant CQAs included PTMs, high molecular weight species, and low molecular weight species. Thus, removal of the IEC method from the DP specification was achieved using a validated LC-MS MAM method on a QDa system to directly measure the charge variant PTM CQAs in combination with size exclusion chromatography (SE-HPLC) and capillary electrophoresis (CE-SDS) to measure the non-PTM charge variant CQAs. Bridging data between the MAM, IEC, and SE-HPLC methods were included in the commercial marketing application to justify removing IEC from the DP specification. We have also used this MAM method as a test for identity to reduce the number of QC assays. This strategy has received approvals from several health authorities.
Introduction
Monoclonal antibody (mAb) drug products are heterogeneous in nature due to variations in glycosylation, post-translational modifications (PTMs), aggregation and fragmentation.Citation1–3 Identification and control of critical quality attributes (CQAs) through rigorous quality control (QC) testing is essential to ensure the safety and efficacy of these biotherapeutics.Citation4,Citation5 The analytical testing strategies for biologics continue to evolve with improvements in analytical technology and product understanding, but some control strategy concepts have been in place since publication of the ICH Q6B guidance in 1999.Citation6 Traditional profile-based separation methods such as ion-exchange chromatography (IEC), capillary isoelectric focusing (cIEF), size exclusion chromatography (SE-HPLC), and capillary electrophoresis methods (CE-SDS) are extensively used in QC labs because they effectively detect changes in the quality attributes of a biologic product.Citation7 However, the separation profiles may be influenced by changes in non-CQAs that have no effect on product safety or efficacy. Our goal is to design targeted analytical control strategies focused on direct monitoring of the CQAs to ensure product safety and efficacy by adding multi-attribute monitoring (MAM) methods for PTMs, while cautiously eliminating historical, nonspecific profile-based assays such as IEC and cIEF from commercial release and stability testing panels.
Peptide mapping using mass spectrometry (MS) provides the capability to directly measure several CQAs in a single method, such as oxidation, deamidation, isomerization, and glycosylation,Citation8,Citation9–14 and multiple approaches are being developed to introduce MS into commercial QC labs.Citation15 The multi-attribute method uses high-resolution LC-MS to monitor many CQAs and uses new peak detection (NPD) to potentially replace traditional QC purity methods.Citation16–23 Although there has been technical and logistical progress using the multi-attribute method, implementation in commercial good manufacturing practice (GMP) labs is currently limited.Citation16,Citation24–30 Alternative MAM approaches using MS in QC have also been designed and implemented.Citation31–35 We recently presented a targeted MAM method using the QDa mass spectrometer that was co-validated across 6 labs worldwide to monitor several product-specific CQAs and determine the identity of a bispecific antibody.Citation35 The MAM method uses robust GMP-compliant instrumentation, software packages familiar to commercial QC labs, and is available for a modest price, which facilitated implementation throughout the QC organization. The method has received world-wide approvals by multiple health authorities for commercial release and stability testing.
With the successful implementation of MAM methods in commercial QC labs, we now aim to expand the method as a tool to replace traditional profile-based methods that monitor a mixture of CQAs and non-CQAs with methods that specifically target CQAs. Here, we justified the removal of IEC from the DP specification by providing alternative methods to directly measure charge variant CQAs of a commercial mAb product. Our assay replacement approach uses a MAM method to ensure control of the PTM CQAs in combination with SE-HPLC and CE-SDS purity methods to ensure control of the remaining charge related CQAs (high molecular weight species (HMWS), low molecular weight species (LMWS)). Method bridging studies were performed between IEC, MAM, and SE-HPLC to justify this analytical control strategy.
Results
Characterization of the IEC profile
The IEC profile for the mAb drug substance (DS) was characterized to determine the charge variants and charge variant CQAs. As shown in , the IEC chromatogram has three acidic peaks, one main peak, and one basic peak. Each IEC peak was isolated by fraction collection at a semi-prep scale. The purity and bioactivity of each enriched fraction was evaluated by IEC (Figure S1) and the mAb potency assay, respectively, to determine the criticality of the charge variants. As summarized in , the potency of the enriched main peak was 98%, which indicated that full biological activity was maintained during the charge variant isolation procedure. The relative potency of enriched acidic fraction 1, acidic fraction 2 and acidic fraction 3 was < 25%, 33%, and 36%, respectively. The relative potency of the enriched basic fraction was 78%. These results show that at least some acidic and basic charge variants separated by IEC are CQAs.
Figure 1. Representative IEC chromatogram for the mAb DS. The red dotted lines indicate the collected fractions across the three acidic peaks, the main peak, and the basic peak. The symbols represent the product specific charge variants (CDR deamidation (square), glycation (star), LMWS (oval), N-terminal cyclization (pentagon), and HMWS). The symbols for CQAs and non-CQAs are outlined in red and black font, respectively.
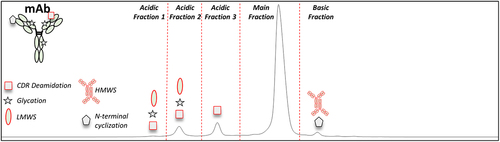
Table 1. Summary of mAb charge variant characterization.
The enriched fractions were characterized by high resolution LC-MS, LC-MS/MS, SE-HPLC, and CE-SDS to identify the charge variants in each IEC peak. As shown in , there were increased levels of complementarity-determining region (CDR) deamidation in acidic fraction 1 (49.1%), acidic fraction 2 (78.5%), and acidic fraction 3 (85.5%) compared to the main peak. Additionally, there were increased levels of glycation in acidic fraction 1 (46.4%) and increased levels of LMWS detected by CE-SDS (reduced and non-reduced) in acidic fraction 1 and acidic fraction 2. There were no meaningful differences in the levels of HC N-terminal cyclization or Fc deamidation between the acidic peaks and the main peak suggesting these PTMs did not contribute to the acidic charge variants of this mAb. The basic fraction contained increased levels of HC N-terminal cyclization (22.6%) and HMWS (10.2%) compared to the main peak. Together, these results clarified the separation of charge variants by IEC.
Charge variant CQA identification
Forced degradation studies were performed to identify which of these charge variants are CQAs. As shown in , forced degradation of the mAb DS by heat stress, high pH stress, and low pH stress produced changes in the mAb charge profile and loss of bioactivity. These results indicated that all three stress conditions increased the levels of CQAs and the IEC method was able to detect changes in each case. Extended characterization and structural modeling were used to identify the CQAs produced by each stress condition to demonstrate that the new analytical testing strategy would ensure control of all the charge variant CQAs.
Table 2. Summary of mAb forced degradation results.
CDR deamidation levels increased to 58.0% and 76.5% in the heat and high pH stressed DS, respectively. These increases in CDR deamidation correlated with decreases in bioactivity, which indicated that CDR deamidation was an acidic charge variant CQA. Glycation was also an acidic charge variant but increases in glycation induced by glucose stress had no impact on DS bioactivity and was therefore a non-CQA (Figure S2). HMWS and LMWS levels also increased in heat stress and high pH stressed DS and were considered CQAs. Low pH stress showed no significant change in PTMs, but HMWS levels increased to 32.7%, which explains the change in charge profile and the lack of similarity result in the potency assay.
Overall, the charge variant CQAs identified by forced degradation studies were CDR deamidation (heat and high pH stress), LMWS (heat and high pH stress), and HMWS (heat and low pH stress). Therefore, our targeted CQA analytical testing strategy for charge variants utilized MAM to monitor CDR deamidation, SE-HPLC to monitor HMWS, and CE-SDS to monitor LMWS and specifications for the IEC method could be eliminated. The MAM method was developed using LC-MS analysis on a QDa MS system and validated with development and commercial QC labs as previously described.Citation35 The MAM method was also designed to monitor oxidation and identity to further simplify the analytical testing strategy (Figures S3 and S4).
Method bridging
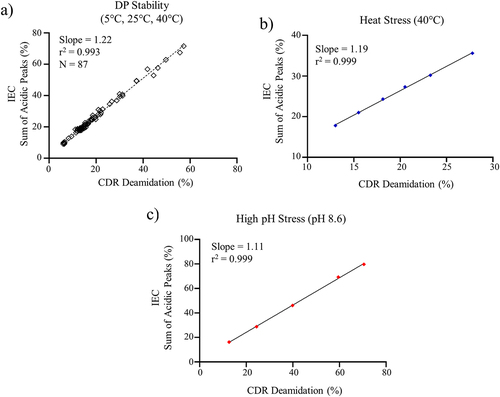
Method bridging studies are necessary when changing QC test methods in late development or during life-cycle management of a commercial drug product.Citation25 In this case, bridging was performed between CDR deamidation measured by the MAM method and total acidic variants measured by the IEC method because CDR deamidation was determined to be the primary acidic charge variant PTM CQA. As shown in , a strong linear correlation (r2 = 0.993) was observed between CDR deamidation and the sum of acidic peaks for 11 batches of DP stored at 5°C, 25°C, and 40°C. The measured slope of the correlation was 1.22, indicating that the increase in acidic peaks was primarily the result of increased CDR deamidation. The correlation between acidic charge variants measured by the IEC method and CDR deamidation measured by the MAM method was further evaluated using heat stressed (40 °C) () and high pH stressed (pH 8.6) DS (). As shown in , there was still a strong linear correlation between the total acidic peaks and CDR deamidation for the mAb product under both stressed conditions. The r2 values were > 0.99 with a measured slope of 1.19 and 1.11 for heat stress and high pH stressed mAb, respectively, which suggests the increases in acidic charge variants was primarily the result of CDR deamidation. The results show that monitoring CDR deamidation by MAM ensures sufficient control of the predominant acidic charge variant PTM CQA measured by IEC.
Figure 2. (a) Linear regression analysis for CDR deamidation measured by the MAM method and the sum of acidic peaks measured by IEC for a) DP stability samples, (b) heat stress DS at 40°C, and (c) high pH stress DS (pH 8.6).
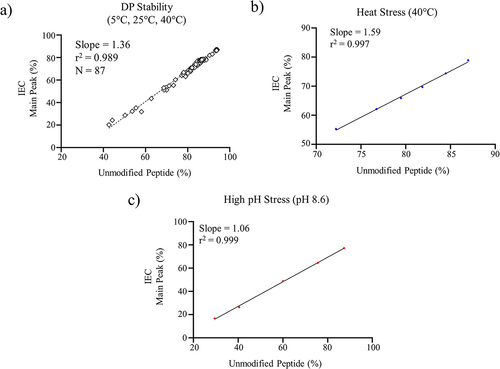
Method bridging was also performed to evaluate the correlation between the main peak measured by IEC and the unmodified CDR peptide measured by the MAM method since the main peak contained biologically active mAb. As shown in , there was a strong linear correlation between the unmodified peptide measured by MAM and the main peak measured by IEC for 11 batches of DP stored at 5°C, 25°C, and 40°C with an r2 = 0.989 and a slope of 1.36. Similarly, there were good correlations between the unmodified peptide measured by MAM and the main peak measured by IEC with forced degraded DS (heat and high pH stressed). The correlations for heat-stressed mAb had r2 and slope values of 0.997 and 1.59, respectively (). The higher slope value reflected greater loss of the unmodified main peak, which was likely due to a combination of CDR deamidation and fragmentation since heat stress produced substantial increases (~10%) in LMWS. The correlations for high pH stress mAb had r2 and slope values of 0.999 and 1.06, respectively (). Together, these results demonstrated that MAM also ensured the control of the main peak.
Figure 3. a) Linear regression analysis for the unmodified (non-CDR deamidation) peptide measured by the targeted MAM method and the main peak measured by IEC for a) DP stability samples, b) heat stress DS at 40°C, and c) mAb high pH stress (pH 8.6).
The basic charge variant peak contained a mixture of the intact mAb with N-terminal cyclization and HMWS. Low pH stress (pH 4.0) of the mAb was used to evaluate the correlation between HMWS and the basic charge variant peak because this stress treatment produced a selective increase in HMWS. As shown in , there was a strong linear correlation between HMWS measured by SE-HPLC and the sum of basic peaks measured by IEC with an r2 of 0.970. These results indicate that SE-HPLC is sufficient to ensure control over the basic charge variant CQA.
Figure 4. The correlation between HMWS measured by SE-HPLC and the sum of basic peaks measured by IEC is shown for low pH stress mAb.

Discussion
Biotherapeutics contain many CQAs that require control using analytical methods or an alternative control strategy. Traditional product specifications use profile-based separation methods that are routinely implemented in commercial QC labs. Historically, these methods have been effective tools to ensure product quality because they were reliable, sensitive and could be used to monitor many different protein degradation pathways.Citation3,Citation6,Citation36,Citation37 As MS methods and product understanding has improved in recent years, it has become possible to identify the PTM CQAs more accurately and implement analytical control strategies selectively focused on the CQAs for new protein products. In this case study, we have developed a targeted CQA analytical strategy to ensure control of charge heterogeneity that uses a MAM method to ensure control of deamidation PTM CQAs, SE-HPLC to ensure control of HMWS, and CE-SDS to ensure control of LMWS. The MAM method was also designed to determine identity and monitor oxidation. This strategy allowed the removal of traditional identity and charge heterogeneity methods from the commercial DP specifications.
Prior to designing and validating the LC-MS MAM method on the QDa system with QC labs, high-resolution LC-MS/MS was utilized in development to cast a wide net and collect data on up to 45 PTMs. New peaks were detected by MS and identified using the MS/MS data to provide comprehensive process and product characterization of the mAb. This included support for process and formulation development, process characterization, clinical batch release and stability testing, structure/function studies, forced degradation studies, and variant characterization. The results were evaluated to determine CQAs, perform risk assessments, and design the mAb control strategy for the marketing application. This thorough characterization of the commercial mAb process and product using high-resolution LC-MS/MS identified all CQAs and justified the targeted CQA analytical control strategy for charge heterogeneity. Overall, two Fc oxidation sites, CDR deamidation, and mAb signature peptides were selected for monitoring by the QDa MAM method. Monitoring non-CQAs such as Fc deamidation, glycation, and N/C-terminal heterogeneity by MAM were not necessary since they did not affect product safety or efficacy and were shown to be controlled throughout the manufacturing process.
Method bridging studies were required to remove the IEC method in the marketing application. We used existing QC separation methods (SE-HPLC and CE-SDS) in combination with the MAM method to ensure control of all charge variant CQAs. CDR deamidation and LMWS were the primary contributors to changes in acidic species measured by IEC, while HMWS was the primary CQA contributor to changes in basic species measured by IEC. With all charge variant CQAs monitored by the MAM, CE-SDS, and SE-HPLC methods, the IEC method was no longer necessary and was removed from the commercial DP specifications. CQA monitoring control strategies may require continued use of orthogonal QC methods to directly measure CQAs that cannot be assessed by MAM.Citation18,Citation28 Removal of the IEC specification decreased the QC testing load and eliminated potential batch failures due to changes of non-CQA charge variants without sacrificing control of product quality. Identity testing and oxidation monitoring were also included in the MAM method to replace prior clinical phase methods and monitor additional CQAs directly in a single QC method to further streamline the analytical control strategy.
Our current work is focused on implementation of a global CQA analytical control strategy using MAM methods. In development, a commitment to mAb characterization using high-resolution LC-MS and LC-MS/MS under multiple stress conditions, process characterization, and product characterization may provide additional justification to further simplify the analytical control strategy based on the results of process risk assessments. For commercial QC, the high-resolution MS methods are adapted to QC-friendly MAM methods on the QDa, which offers a robust, low-cost platform that is scalable to a global QC network. Furthermore, the instrument operation, data processing, and reporting uses GMP-compliant Empower 3 software, which is well-established at commercial QC testing sites world-wide, making the QDa a facile addition for analysts. Complementary MS in QC methodology may be considered for more complex molecule designs, such as antibody-drug conjugates, vaccine products, combination products, and multi-specific platforms.Citation32,Citation38,Citation39 This may also offer flexibility to continuously improve a CQA focused analytical control strategy that is customized to the specific structural properties and manufacturing process of the commercial mAb.
In conclusion, we presented a targeted CQA analytical control strategy to replace the IEC method in the DP specification using a combination of MAM, CE-SDS, and SE-HPLC methods. The MAM and CE-SDS methods ensured control of deamidation and LMWS, respectively, which were the acidic charge variant CQAs. SE-HPLC ensured control of HMWS, which was the basic charge variant CQA. The strategy demonstrates that targeted CQA monitoring can be used as a tool to streamline the release testing panel. The removal of IEC was filed in marketing applications and has received approval from several health authorities. To our knowledge, this is the first replacement of a profile-based separation method using targeted CQA monitoring by QDa LC-MS in the commercial GMP environment. Our lab will continue to evaluate opportunities to simplify release specifications and improve our MS in QC strategy.
Materials and methods
Reagents
Trypsin was purchased from Promega or Worthington (TPCK-treated). All other reagents and materials were purchased from Sigma Aldrich unless otherwise stated.
Forced degraded mAb preparation
Full-length bispecific IgG mAb DS was subject to heat stress, high pH stress, and low pH stress. For heat stress, mAb DS was incubated up to 24 weeks at 40°C. For high pH stress, mAb DS was incubated up to 15 days at 37°C in sodium phosphate buffer (0.1 M, pH 8.5) and exchanged into formulation buffer. For low pH stress, mAb DS was incubated up to 12 hours at 30°C in sodium citrate buffer (0.2 M, pH 4.0) and exchanged into formulation buffer. All materials were stored at −70°C until further analysis.
Ion-exchange chromatography
MAb charge variants were separated using strong cation exchange high performance liquid chromatography. Samples were injected on a non-porous sulfonate cation exchange column under acidic pH conditions and charge variants were eluted in order of increasing positive charge using a pH gradient. The column temperature was held at 35°C and the flow rate was 0.75 mL/min. Eluted protein was detected by UV absorbance at 280 nm and the calculated peak areas of charge variant groups (acidic peaks, main peak, and basic peaks) were expressed as a relative percentage of the total peak area.
Non-reduced and reduced capillary SDS electrophoresis
MAb size variants were separated using non-reduced (NR) and reduced (R) CE-SDS. mAb samples were mixed with sodium dodecyl sulfate buffer (25 mM Bis-Tris/citrate, pH 7.0, 1% SDS for NR-CE-SDS and 100 mM Tris-HCl, pH 9.1, 1% SDS, 0.5% (v/v) 2-mercaptoethanol for R-CE-SDS) and alkylated with N-ethylmaleimide (NR-CE-SDS) or iodoacetamide (R-CE-SDS). Samples were incubated at 75°C for 5 minutes and loaded into a preconditioned bare-fused silica capillary (30.2 cm, 50 µM i.d.) filled with polymer gel solution. Separation was achieved by applying a constant voltage (−15 kV) for 40 minutes or 35 minutes and detected by UV at 220 nm.
Size exclusion chromatography
MAb size variants were separated using size-exclusion high performance liquid chromatography. Samples were injected on a silica-based size exclusion column equilibrated with sodium phosphate buffer (0.2 M, pH 6.8) at a flow rate of 0.5 mL/min. Eluted protein was detected using UV absorbance at 280 nm and the calculated peak areas of size variant groups (HMWS, main peak, and LMWS) were expressed as a relative percentage of the total peak area.
Protein digestion for LC-MS or LC-MS/MS
Protein samples were denatured in 6 M guanidine, 50 mM Tris, 1 mM EDTA, pH 8.0, reduced with dithiothreitol (15 minutes, 37°C), alkylated with sodium iodoacetate (15 minutes, RT), and quenched with excess dithiothreitol. Reduced and alkylated protein samples were buffer exchanged into 50 mM Tris, 1 mM CaCl2, 5 mM methionine, pH 7.0 with Sephadex G-25 columns (Cytiva) and digested with trypsin for 2 hours at 37°C. Tryptic digests were quenched with trifluoroacetic acid (Fisher) and stored at −70°C until further analysis.
High-resolution peptide mapping (LC-MS/MS)
Tryptic digests were analyzed by reversed phased LC-MS/MS using an Agilent 1290 UPLC system or Thermo Vanquish UPLC coupled with a Q-Exactive or Orbitrap Exploris 240 (Thermo Scientific) mass spectrometer. Briefly, tryptic peptides were separated using a Waters Acquity BEH C18 column at 40°C with a gradient of acetonitrile in 0.1% formic acid. Eluted peptides were subject to heated electrospray ionization (HESI) followed by online MS analysis operating in data-dependent acquisition mode. Full MS scans (70,000 resolution or 120,000 resolution, 1E6 or 3E6 AGC, 200–2,000 m/z) were performed followed by selection of the top 3–5 most intense ions for tandem mass spectrometry (MS/MS) analysis (17,500 or 35,000 resolution, 5E5 AGC, dynamic exclusion enabled). Data processing was performed using BiopharmaFinder software (Thermo Scientific).
Multi-attribute monitoring (LC-MS)
Tryptic digests were analyzed on a Waters C18 CSH column at 50°C with a flow rate of 0.5 mL/min using a Waters I-Class UPLC system. Eluted peptides were subject to electrospray ionization (ESI) followed by online MS analysis using a Waters QDa MS system operating in positive ion mode. Full scan MS was performed in centroid mode (200 m/z − 1250 m/z, 10 V cone voltage). Selected ion recording (SIR) channels were acquired to monitor the relevant peptide m/z of interest (9 V or 10 V cone voltage). The capillary voltage was 0.7 kV, the probe temperature was 450°C, and the target sampling rate was 2 pts/sec. Data processing, calculations, and reporting were performed using Empower™ 3 software (Waters).
Supplemental Information to assay replacement manuscript 21Mar24.docx
Download MS Word (1.8 MB)Acknowledgments
The authors would like to thank Dr. Mehul Patel for his continuing support of exploring novel technologies for biopharmaceutical development. The authors acknowledge Qianqiu Li for assistance in statistical analysis, Dr. Jihyeon Lim and Dr. Qing Tang for forced degradation support, and Ryan Marshall and Dr. Michael Nedved for charge variant characterization support.
Disclosure statement
No potential conflict of interest was reported by the author(s).
Supplementary material
Supplemental data for this article can be accessed online at https://doi.org/10.1080/19420862.2024.2341641
Additional information
Funding
References
- Virág D, Dalmadi-Kiss B, Vékey K, Drahos L, Klebovich I, Antal I, Ludanyi K. Current trends in the analysis of post‑translational modifcations. Chromatographia. 2020;83(1):1–8. doi:10.1007/s10337-019-03796-9.
- Yang Y, Wang G, Song T, Lebrilla CB, Heck AJR. Resolving the micro-heterogeneity and structural integrity of monoclonal antibodies by hybrid mass spectrometric approaches. Mabs-austin. 2017;9(4):638–45. doi:10.1080/19420862.2017.1290033.
- Beck A, Wagner-Rousset E, Ayoub D, Van Dorsselaer A, Sanglier-Cianferani S. Characterization of therapeutic antibodies and related products. Anal Chem. 2013;85(2):715–36. doi:10.1021/ac3032355.
- Alt N, Zhang TY, Motchnik P, Taticek R, Quarmby V, Schlothauer T, Beck H, Emrich T, Harris RJ. Determination of critical quality attributes for monoclonal antibodies using quality by design principles. Biologicals. 2016;44(5):291–305. doi:10.1016/j.biologicals.2016.06.005.
- Verch T, Campa C, Chery CC, Frenkel R, Graul T, Jaya N, Nakhle B, Springall J, Starkey J, Wypych J. et al. Analytical quality by design, life cycle management, and method control. AAPS J. 2022;24(1):34. doi:10.1208/s12248-022-00685-2.
- Q6B, I. Q6B Specification: Test Procedures and Acceptance Criteria for Biothechnological/Biological Product. ICH Guidance 1999.
- Ren D. Advancing mass spectrometry technology in cGMP environments. Trends Biotechnol. 2020;38(10):1051–53. doi:10.1016/j.tibtech.2020.06.007.
- Rogstad S, Faustino A, Ruth A, Keire D, Boyne M, Park J. A retrospective evaluation of the use of mass spectrometry in FDA biologics license applications. J Am Soc Mass Spectrom. 2017;28(5):786–94. doi:10.1007/s13361-016-1531-9.
- Song YE, Dubois H, Hoffmann M, S DE, Fromentin Y, Wiesner J, Pfenninger A, Clavier S, Pieper A, Duhau L. et al. Automated mass spectrometry multi-attribute method analyses for process development and characterization of mAbs. J Chromatogr B Analyt Technol Biomed Life Sci. 2021;1166:122540. doi:10.1016/j.jchromb.2021.122540.
- Sitasuwan P, Powers TW, Medwid T, Huang Y, Bare B, Lee LA. Enhancing the multi-attribute method through an automated and high-throughput sample preparation. Mabs-austin. 2021;13(1):1978131. doi:10.1080/19420862.2021.1978131.
- Qian C, Niu B, Jimenez RB, Wang J, Albarghouthi M. Fully automated peptide mapping multi-attribute method by liquid chromatography-mass spectrometry with robotic liquid handling system. J Pharm Biomed Anal. 2021;198:113988. doi:10.1016/j.jpba.2021.113988.
- Hao Z, Moore B, Ren C, Sadek M, Macchi F, Yang L, Harris J, Yee L, Liu E, Tran V. et al. Multi-attribute method performance profile for quality control of monoclonal antibody therapeutics. J Pharm Biomed Anal. 2021;205:114330. doi:10.1016/j.jpba.2021.114330.
- Li X, Pierson NA, Hua X, Patel BA, Olma MH, Strulson CA, Letarte S, Richardson DD. Analytical performance evaluation of identity, quality-attribute monitoring and new peak detection in a platform multi-attribute method using Lys-C digestion for characterization and quality control of therapeutic monoclonal antibodies. J Pharm Sci. 2023;112(3):691–99. doi:10.1016/j.xphs.2022.10.018.
- Carvalho SB, Gomes RA, Pfenninger A, Fischer M, Strotbek M, Isidro IA, Tugcu N, Gomes-Alves P, Hess S. Multi attribute method implementation using a high resolution mass spectrometry platform: From sample preparation to batch analysis. PLoS One. 2022;17(1):e0262711. doi:10.1371/journal.pone.0262711.
- Mans J, Oyugi M, Asmelash B, Sommers C, Rogstad S. The use of mass spectrometry in therapeutic protein biologics license applications: a retrospective review revisited. J Am Soc Mass Spectrom. 2023;34(11):2575–84. doi:10.1021/jasms.3c00286.
- Millan-Martin S, Jakes C, Carillo S, Rogers R, Ren D, Bones J. Comprehensive multi-attribute method workflow for biotherapeutic characterization and current good manufacturing practices testing. Nat Protoc. 2022;18(4):1056–89. doi:10.1038/s41596-022-00785-5.
- Jakes C, Millan-Martin S, Carillo S, Scheffler K, Zaborowska I, Bones J. Tracking the behavior of monoclonal antibody product quality attributes using a multi-attribute method workflow. J Am Soc Mass Spectrom. 2021;32(8):1998–2012. doi:10.1021/jasms.0c00432.
- Yang F, Zhang J, Buettner A, Vosika E, Sadek M, Hao Z, Reusch D, Koenig M, Chan W, Bathke A. et al. Mass spectrometry-based multi-attribute method in protein therapeutics product quality monitoring and quality control. Mabs. 2023;15(1):2197668. doi:10.1080/19420862.2023.2197668.
- Rogstad S, Yan H, Wang X, Powers D, Brorson K, Damdinsuren B, Lee S. Multi-attribute method for quality control of therapeutic proteins. Anal Chem. 2019;91(22):14170–77. doi:10.1021/acs.analchem.9b03808.
- Rogers RS, Abernathy M, Richardson DD, Rouse JC, Sperry JB, Swann P, Wypych J, Yu C, Zang L, Deshpande R. A view on the importance of “multi-attribute method” for measuring purity of biopharmaceuticals and improving overall control strategy. AAPS J. 2017;20(1):7. doi:10.1208/s12248-017-0168-3.
- Rogers RS, Nightlinger NS, Livingston B, Campbell P, Bailey R, Balland A. Development of a quantitative mass spectrometry multi-attribute method for characterization, quality control testing and disposition of biologics. Mabs-austin. 2015;7(5):881–90. doi:10.1080/19420862.2015.1069454.
- Guan X, Eris T, Zhang L, Ren D, Ricci MS, Thiel T, Goudar CT. A high-resolution multi-attribute method for product characterization, process characterization, and quality control of therapeutic proteins. Anal Biochem. 2022;643:114575. doi:10.1016/j.ab.2022.114575.
- Oyugi M, Wang X, Yang X, Wu D, Rogstad S. Method validation and new peak detection for the liquid chromatography-mass spectrometry multi-attribute method. J Pharm Biomed Anal. 2023;234:115564. doi:10.1016/j.jpba.2023.115564.
- Sadek M, Moore BN, Yu C, Ruppe N, Abdun-Nabi A, Hao Z, Alvarez M, Dahotre S, Deperalta G. A robust purity method for biotherapeutics using new peak detection in an LC-MS-based multi-attribute method. J Am Soc Mass Spectrom. 2023;34(3):484–92. doi:10.1021/jasms.2c00355.
- Associations, E. F. o. P. I. a. Use of multi attribute method by mass spectrometry as a QC release and stability tool for biopharmaceuticals - regulatory considerations. www.efpia.edu. 2022; 1–22.
- Mouchahoir T, Schiel JE, Rogers R, Heckert A, Place BJ, Ammerman A, Li X, Robinson T, Schmidt B, Chumsae CM. et al. Attribute Analytics Performance Metrics from the MAM Consortium Interlaboratory Study. J Am Soc Mass Spectrom. 2022;33(9):1659–77. doi:10.1021/jasms.2c00129.
- Mouchahoir T, Schiel JE, Rogers R, Heckert A, Place BJ, Ammerman A, Li X, Robinson T, Schmidt B, Chumsae CM. et al. New Peak Detection Performance Metrics from the MAM Consortium Interlaboratory Study. J Am Soc Mass Spectrom. 2021;32(4):913–28. doi:10.1021/jasms.0c00415.
- Pohl T, Gervais A, Dirksen E, D’Alessio V, Bechtold-Peters K, Burkitt W, Cao L, Greven S, Lennard A, Li X. et al. Technical considerations for the implementation of the Multi-Attribute-Method by mass spectrometry in a quality control laboratory. Eur J Pharm Biopharm. 2023;188:231–42. doi:10.1016/j.ejpb.2023.04.024.
- Millan-Martin S, Jakes C, Carillo S, Gallagher L, Scheffler K, Broster K, Bones J. Multi-Attribute Method (MAM): An Emerging Analytical Workflow for Biopharmaceutical Characterization, Batch Release and cGMP Purity Testing at the Peptide and Intact Protein Level. Crit Rev Anal Chem. 2023;2023:1–18. doi:10.1080/10408347.2023.2238058.
- Gervais A, Dirksen EHC, Pohl T, Bechtold-Peters K, Burkitt W, D’Alessio V, Greven S, Lennard A, Li X, Lossner C. et al. Compliance and regulatory considerations for the implementation of the multi-attribute-method by mass spectrometry in a quality control laboratory. Eur J Pharm Biopharm. 2023;191:57–67. doi:10.1016/j.ejpb.2023.08.008.
- Xu W, Jimenez RB, Mowery R, Luo H, Cao M, Agarwal N, Ramos I, Wang X, Wang J. A Quadrupole Dalton-based multi-attribute method for product characterization, process development, and quality control of therapeutic proteins. Mabs-austin. 2017;9(7):1186–96. doi:10.1080/19420862.2017.1364326.
- Sokolowska I, Mo J, Rahimi Pirkolachahi F, McVean C, Meijer LAT, Switzar L, Balog C, Lewis MJ, Hu P. Implementation of a High-Resolution Liquid Chromatography-Mass Spectrometry Method in Quality Control Laboratories for Release and Stability Testing of a Commercial Antibody Product. Anal Chem. 2020;92(3):2369–73. doi:10.1021/acs.analchem.9b05036.
- Xu C, Khanal S, Pierson NA, Quiroz J, Kochert B, Yang X, Wylie D, Strulson CA. Development, validation, and implementation of a robust and quality control-friendly focused peptide mapping method for monitoring oxidation of co-formulated monoclonal antibodies. Anal Bioanal Chem. 2022;414(29–30):8317–30. doi:10.1007/s00216-022-04366-z.
- Sokolowska I, Mo J, Dong J, Lewis MJ, Hu P. Subunit mass analysis for monitoring antibody oxidation. Mabs-austin. 2017;9(3):498–505. doi:10.1080/19420862.2017.1279773.
- Evans AR, Hebert AS, Mulholland J, Lewis MJ, Hu P. ID-MAM: A Validated Identity and Multi-Attribute Monitoring Method for Commercial Release and Stability Testing of a Bispecific Antibody. Anal Chem. 2021;93(26):9166–73. doi:10.1021/acs.analchem.1c01029.
- Fekete S, Beck A, Veuthey JL, Guillarme D. Ion-exchange chromatography for the characterization of biopharmaceuticals. J Pharm Biomed Anal. 2015;113:43–55. doi:10.1016/j.jpba.2015.02.037.
- Du Y, Walsh A, Ehrick R, Xu W, May K, Liu H. Chromatographic analysis of the acidic and basic species of recombinant monoclonal antibodies. Mabs-austin. 2012;4(5):578–85. doi:10.4161/mabs.21328.
- Martelet A, Garrigue V, Zhang Z, Genet B, Guttman A. Multi-attribute method based characterization of antibody drug conjugates (ADC) at the intact and subunit levels. J Pharm Biomed Anal. 2021;201:114094. doi:10.1016/j.jpba.2021.114094.
- Carillo S, Criscuolo A, Fussl F, Cook K, Bones J. Intact multi-attribute method (iMAM): A flexible tool for the analysis of monoclonal antibodies. Eur J Pharm Biopharm. 2022;177:241–48. doi:10.1016/j.ejpb.2022.07.005.