
 ?Mathematical formulae have been encoded as MathML and are displayed in this HTML version using MathJax in order to improve their display. Uncheck the box to turn MathJax off. This feature requires Javascript. Click on a formula to zoom.
Abstract
Not much is known about early responses of pelagic fish populations to rapidly increasing nutrient concentrations in originally oligotrophic lakes. Here we report on population parameters of a pair of pelagic ciscoes (Coregonus spp.) exposed to accelerating eutrophication of the deep (69.5 m) and stratified Lake Stechlin (NE Germany), in which total phosphorus (TP) concentration increased from about 15 mg m-3 to >60 mg m-3 within 10 years. With increasing TP concentrations, lower Secchi depths, declining oxygen concentrations in deeper water layers, higher phytoplankton and higher zooplankton biomass were observed. Correlation analyses supported strong bottom-up directed effects of higher TP concentrations on primary and secondary producers, and negative effects of TP on water quality parameters. Annual hydroacoustic records and midwater trawling showed an increase in average individual fish size. There was no temporal trend in fish biomass, but we observed cyclic annual biomass fluctuations. Diel vertical migration (DVM) amplitudes of ciscoes declined, primarily by occurrence of fish in shallower waters than in previous years during daytime. We propose that release from density-dependent food limitation, due to increased plankton food abundances, resulted in increased individual sizes for both the cisco species, which in turn increasingly blurs species discrimination because length distributions of both species are no longer substantially different. Our data show the value of long-term lake monitoring including fish population surveys, to understand the initially subtle changes in biotic communities, which may precede more drastic and potentially irreversible changes to anthropogenic pressures.
Disclaimer
As a service to authors and researchers we are providing this version of an accepted manuscript (AM). Copyediting, typesetting, and review of the resulting proofs will be undertaken on this manuscript before final publication of the Version of Record (VoR). During production and pre-press, errors may be discovered which could affect the content, and all legal disclaimers that apply to the journal relate to these versions also.Introduction
The anthropocene is characterized by major stressors in aquatic ecosystems, for example, global warming, pollution from land use, habitat fragmentation, introduction of non-native species, water abstraction for industry or irrigation, and over-exploitation of natural populations (Oberdorff 2022; Woolway et al. 2022). However, aquatic ecosystems harbor an exceptionally high biodiversity and provide numerous ecosystem services (Reid et al. 2019; Heino et al. 2021; Oberdorff 2022), suggesting that monitoring the response of aquatic ecosystems to anthropogenic effects is of major importance (Tyler et al. 2016; Heino et al. 2020; Maasri et al. 2022). While there are long-term time series of lake temperature, oxygen concentrations, and of proxies of phytoplankton biomass from lakes located on almost all continents (Kraemer et al. 2017; Jane et al. 2021; Kraemer et al. 2021; Woolway et al. 2021; Adams et al. 2022; Woolway 2023), fewer long-term records are available for changes of fish populations and communities in response to anthropogenic pressures. Exceptions are lakes with long-term monitoring programs including fish and fisheries surveys, for example Lake Constance (Germany, Austria, Switzerland) (Eckmann and Rösch 1998), Windermere (United Kingdom) (Winfield et al. 2008), Lake Peipsi (Estonia) (Kangur et al. 2007), and Lake Albufera (Catalonia, Spain) (Blanco et al. 2003) for which abiotic and biotic changes in response to anthropogenic stressors have been documented at a relatively high frequency over decades (see summary by Jeppesen et al. 2012).
The alternative approach to understand anthropogenically induced successions is space-for-time substitution, for example by comparing lakes at differing latitudes to understand the effect of warming climates for fish community composition (Jeppesen et al. 2010; Comte et al. 2013; Jeppesen et al. 2020). Similarly, effects of eutrophication of lakes on fish communities were mainly demonstrated by comparing fish populations among lakes along productivity gradients (Persson et al. 1991; Mehner et al. 2005; Garcia et al. 2006; Argillier et al. 2013; Brucet et al. 2013; Ritterbusch et al. 2022). From these two approaches, i.e. time-series in single lakes and space-for-time comparisons among several lakes, it is well known how fish community composition in temperate lakes changed in response to eutrophication. Earlier research, already in the last decades of the 20th century documented shifts of dominant fish families from salmonids and coregonids in oligotrophic lakes, over percids (primarily Perca spp.) in mesotrophic lakes, to a dominance of cyprinids in eutrophic lakes (Hartmann and Nümann 1977; Persson et al. 1991; Kubecka 1993). More recent work demonstrated that the shift in dominance of fish families is also affected by lake morphometry and differs between warm and shallow, and colder and deep lakes (Diekmann et al. 2005; Mehner et al. 2005; Mehner and Brucet 2022). Salmonid and coregonid fish species occur only in lakes with a cold and well oxygenated hypolimnion, and hence global warming and eutrophication may interact in shrinking the available habitat for these cold-water fish species.
However, major shifts of community composition in response to eutrophication occur over strong gradients with a substantial increase in nutrient concentrations, while initial subtle changes, which occur while originally oligotrophic lakes become fertilized by external or internal nutrient loads, are less well documented. An increase in primary nutrient concentrations (phosphorus and nitrogen) will stimulate primary production of phytoplankton and most likely also secondary production of pelagic zooplankton. However, population indicators of organisms with higher longevity such as fishes may show a temporally delayed response. Experimental fertilization by phosphorus, nitrogen and carbon of one half of a divided lake in Ontario (Canada) stimulated growth, biomass, body condition and population production of lake whitefish (Coregonus clupeaformis) in comparison with fish in the other half of the lake, which was fertilized only by nitrogen and carbon (Mills and Chalanchuk 1987). These results support the strong effect of enhanced phosphorus concentration on coregonid fish populations, which were detected already one or two years after nutrient enhancement, and persisted for several years even after fertilization had been stopped (Mills et al. 1998). Modifications of fish behavior in response to eutrophication, such as diel vertical migrations (DVM) (Mehner 2012), may even be detected earlier. For example, in stratified lakes, declining oxygen concentrations in deep water layers in response to higher nutrient concentrations may prevent occurrence of cold-water fishes like salmonids, such that the vertical distribution center of pelagic fish populations moves up (Stone et al. 2020). Aquaculture-induced enhanced nutrient concentrations caused a loss of well oxygenated coldwater habitats and hence a vertical upward shift of invertebrate and vertebrate prey of lake trout (Salvelinus namaycush) in the experimental Lake 375 (Rennie et al. 2019). Such changes in availability of coldwater habitats induced by low oxygen concentrations due to eutrophication may become more accentuated by increasing water temperatures induced by global warming, because bioenergetic efficiency may contribute to patterns of DVM of fishes (Busch et al. 2011; Busch et al. 2012). Therefore, the two dominant stressors eutrophication and warming may interact and magnify the effects to be expected in response to the isolated stressors.
An example of a lake where monitoring programs including fish surveys might help understanding the response to eutrophication and warming is Lake Stechlin (Germany). The lake has long been considered as a reference system for fish communities of deep oligotrophic hardwater lakes in the north-east region of Germany (Ritterbusch et al. 2014), with a dominance of pelagic planktivorous fishes (genus Coregonus). The ecosystem of Lake Stechlin has been well studied for decades (Casper 1985; Koschel and Adams 2003), and the ongoing monitoring program of nutrient concentrations of this originally oligotrophic lake has shown a rapid eutrophication since about 2011 (Selmeczy et al. 2019; Kröger et al. 2023). Furthermore, the annual average air temperature in the region has increased by about 1.3 K during the period from 1881 to 2018, and the annual mean air temperature increased from 8.7 °C in 1981 to 9.2 °C in 2010 (DWD 2019). The available data from the monitoring program now offer the possibility for a closer inspection of initial temporal trends with a particular focus on the response of the pelagic fish populations to accelerated eutrophication and potential warming trends.
In this study, we explore the responses in fish abundance, biomass and size to the recently accelerated eutrophication and the potential warming of the lake during the period between 2008 and 2021. We also include indicators of fish DVM to detect potentially early behavioral responses of fish populations to changes in vertical gradients. We calculated annual averages of abiotic variables (total phosphorus concentration (TP), Secchi depth, oxygen concentration, temperature) and of trophic variables (chlorophyll a concentration (chl a), epilimnetic and hypolimnetic zooplankton biomass), and used correlation analysis to evaluate associations among variables. We expected that fish biomass would respond strongly to eutrophication if higher lake productivity induced by TP enrichment was translated into higher zooplankton prey biomass. Alternatively, deterioration of oxygen concentrations in deeper layers as a consequence of higher productivity and warmer water may modify fish behavior by shifting the population centers during DVM. Overall, we expected that the strong changes in nutrient concentrations in the lake would have effects on almost all measured variables with potentially strong year-to-year variations.
Methods
Study site
Lake Stechlin is a deep, stratified post-glacial lake (Zmax = 69.5 m) with a surface area of 4.3 km², situated about 80 km north of Berlin, Germany. The lake is located in a natural reserve area, and its terrestrial environment is characterized by forest land use, with only small proportion of urban areas. The lake is used for recreational activities like swimming, boating, angling and diving. There is a single commercial fisherman on the lake, who harvests primarily the dominant vendace. Annual fisheries yield of vendace was recorded as about 15 kg ha-1 yr-1 for the years 2012 to 2016 (Wanke et al. 2021, and unpublished data), equivalent to about 10% of the coregonid standing stock in the lake (see results). The annual fishing effort (gillnet sizes and fishing nights) has been relatively constant over the last decades such that the commercial catch follows the population dynamics of the vendace stocks. Larger gillnet mesh-sizes were applied in recent years when average fish size increased (see results) to keep the numerical catch approximately constant.
Analyses of fish community composition of Lake Stechlin have started at the end of the 1990s (Mehner and Schulz 2002; Anwand et al. 2003). The lake is characterized by steep slopes and deep central basins. Accordingly, the numerically dominant species are pelagic coregonids, namely vendace (Coregonus albula) and the originally dwarf-sized endemic Fontane cisco (Coregonus fontanae) (Schulz and Freyhof 2003). Both species are pelagic planktivores (Helland et al. 2008), and perform diel vertical migrations (DVM) (Mehner et al. 2007; Mehner 2015), but there is some vertical segregation between the species in the upper hypolimnion at night, caused by their differing thermal optima (Mehner et al. 2007; Mehner et al. 2010a). The spawning time differs between vendace (Nov-Dec) and Fontane cisco (Apr-Jun) (Anwand 1998), and Fontane cisco are smaller than vendace at the same age (Anwand et al. 2003). Accordingly, the species could be discriminated by their maturation status relative to their non-overlapping spawning period, combined with size-frequency distributions with differing peaks for the two species. However, the maximum size of vendace in Lake Stechlin was always smaller than that of vendace stocks in other, more productive lakes in the region (Wanke et al. 2017, 2021).
Standard sampling in the monitoring program
In this study, we include samples from the monitoring program from the years 2008 to 2021, except for total phosphorus concentrations, which are summarized over the period from 1971 to 2021. Water samples and profile measurements were taken at the deepest point of Lake Stechlin (69.5 m) situated in the main basin (53°9‘19.5“N, 13°1‘52.9“E) twice per month from May to October. Outside the stratification period, monthly sampling was performed throughout winter when possible. Water samples were collected from different depths using a Limnos water sampler (Limnos, Turku, Finland). The number and vertical distribution of samples were defined according to thermal stratification. In the epilimnion, always two samples were taken, usually at depths of 0 m and 5 m. If stratification depth was less than 5 m, the second sample was taken at 2.5 m and pooled with the 0 m sample. If stratification extended deeper than 10 m, an additional third sample was taken at 10 m, and then all three separate samples were pooled to represent the situation of the upper mixed layer (epilimnion). In 2008, hypolimnetic water samples were collected from 40, 60, and 65 m. Beginning in 2009, during summer stratification hypolimnetic samples were taken at 5-m intervals beginning at 10 m depth down to 55 m. These samples were analyzed individually.
Total phosphorus concentration was determined photometrically in the unfiltered water after digestion with potassium peroxodisulfate in an autoclave (134 °C, 30 min, FOSS, FIAstar 5000 analyzer, HillerØd, Denmark) (ISO_15681-1:2003 2003). The mean volume-weighted TP concentration was calculated by multiplying the TP concentrations at each water depth by the volume of the corresponding depth interval and then dividing their sum by the total volume of the lake. Annual average TP concentrations (± SD) were calculated based on monthly averages of TP. If monthly samples were missing during winter, the mean of TP measurements between the previous and the subsequent month was used.
Chlorophyll a (chl a) concentrations in epilimnetic water samples were measured photometrically with a Hitachi spectrophotometer U-2900 using German standard methods for the examination of water, waste water and sludge (DIN38412-16:1985-12 1985). To account for the differing water depths over which epilimnetic water samples were integrated in response to the seasonally varying extension of the epilimnion, we calculated the arithmetic average from all chl a measurements obtained during a year, from either 0-10 m or 0-5 m mixed epilimnetic samples.
Vertical profiles of temperature and oxygen concentration were recorded using WTW probes (OXI-197, Weilheim, Germany) until 2009. From 2010 on, YSI multiprobes were used (YSI 6600, Yellow Springs, OH, USA). For both water temperature and oxygen concentration, which were recorded in numerous water depths, we selected only the values from a shallow layer at 5 m depth (referred to as epilimnion subsequently), and from an hypolimnetic layer at 40 m water depth. Temperatures and oxygen concentrations at 5 m depth are less sensitive to annual differences in weather conditions than those measured directly at the surface or in 1 m depth, and hence represent the long-term trend of the epilimnetic habitat better than surface measurements. Systematic and comparable samplings across all 14 years were available for these depths for the months April to November, while samples were in part missing over the winter months. Therefore, oxygen and temperature data per year as used in this study are annual averages of all measurements in the respective two depths between April and November.
Secchi depth was determined with a white disc (diameter: 25 cm). Readings were done on the shady side of the boat. To reduce the impact of surface glare, an aquascope was used. Annual averages were calculated from all measurements per year.
To facilitate insight into intra-annual variability, we provide, in addition to annual averages, the full time series of water temperature, oxygen concentration, chla a and Secchi depth as additional figures in the Supplemental Information.
Sampling and analyses of zooplankton and fish
Zooplankton
We obtained epilimnetic and hypolimnetic zooplankton samples by vertical tows using 90 µm mesh Apstein limnological standard plankton nets (either Model 438 040 (17 cm diameter opening diameter, non-closing for epilimnion), or 438 050 with closing mechanism and 16 cm diameter opening, Hydrobios, Kiel, Germany) over 22 m (mean lake depth) to 0 m depths and over 65-22 m depths, respectively, to determine total biomass of different zooplankton groups in both layers. These samples were taken at the same time and location as the samples for monitoring physical and chemical variables of Lake Stechlin (see above). Zooplankton were fixed in 4% formalin–sugar solution (Haney and Hall 1973), until manually enumerated and determined to species or genus (except for nauplii of calanoid and cyclopoid copepods that were treated as one group) using Utermöhl sedimentation chambers and an inverted microscope at 25-200 x magnification (Leitz LABOVERT FS Type 098 127.017, WILDLEITZ GMBH, Wetzlar, Germany). A subset of each group was measured using the same microscope and computer-aided microscopy system (TSO-VID-MESS HY (until Sep 2014) and thereafter TSO-Vidmess 2011 (Thalheim Spezial Optik, Pulsnitz, Germany). Taxonomical classification followed standard taxonomy literature (Kiefer and Fryer 1978; Einsle 1993; Flössner 2000). The length-width measurements were converted into dry weight according to published equations (Dumont et al. 1975; Bottrell et al. 1976; Persson G and Ekbohm 1980; Culver et al. 1985; Lampert and Taylor 1985).
For this study, biomass of all taxa per layer were summed, reflecting total zooplankton dry mass per liter in either epilimnion or hypolimnion. Further, to account for the diet selectivity of coregonids in Lake Stechlin (Schulz et al. 2003), we summed only the biomass of cladocerans and juvenile copepods (copepodites, nauplii) in either epilimnion or hypolimnion, hereafter referred to as zooplankton prey of fishes. The zooplankton excluded from the group of fish prey were adult cyclopoid (genera Cyclops, Acanthocyclops, Paracyclops, Mesocyclops, Thermocyclops) and calanoid (genera Eudiaptomus, Eurytemora, Heterocope) copepods, which are usually not fed upon by the coregonids, but which may constitute a substantial fraction of total zooplankton biomass (Braun et al. 2021). Annual averages were calculated using all samples taken in one year, independent of season. The absolute value of these averages may overestimate the ‘true’ annual arithmetic mean because sampling intensity per month was in most years twice as high between May and October, when the zooplankton biomass normally is considerably higher, than between November in April. However, the sampling procedure is fully comparable among years, and hence the values used reflect the temporal trend in the lake. To facilitate insight into intra-annual variability, we provide the full time series of zooplankton biomass as additional figures in the Supplemental information.
Fish
Analyses of fish community composition of Lake Stechlin have started at the end of the 1990s (Mehner and Schulz 2002; Anwand et al. 2003). The lake is characterized by steep slopes and deep central basins. Accordingly, the numerically dominant species are pelagic coregonids, namely vendace and the originally dwarf-sized endemic Fontane cisco (Coregonus fontanae) (Schulz and Freyhof 2003). Detailed investigations of DVM of pelagic coregonids were conducted in 2005 and subsequent years (Mehner et al. 2007; Mehner et al. 2010a). Regular annual monitoring of the pelagic fish community by hydroacoustics and midwater trawling started in 2006, but could not be completed in 2007. Therefore, the dataset used in this study encompasses the 14 years between 2008 and 2021.
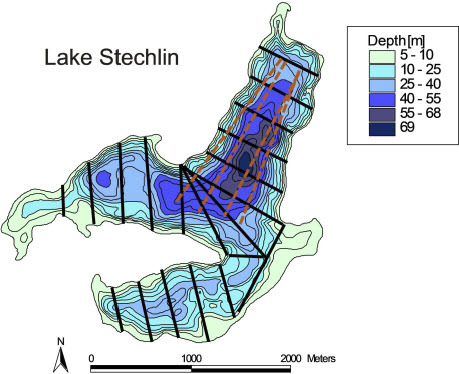
Hydroacoustics monitoring surveys were conducted annually in June, during both daytime (afternoon, year 2009 missing due to technical problems) and nighttime (starting one hour after sunset). We used the Kongsberg/Simrad EY 60 120 kHz transmitter with a 7° x 7° circular split-beam transducer, mounted horizontally in front of a boat about 60 cm below the surface. Standard settings are pulse frequencies of 3 s-1, pulse lengths of 128 ms, 200 W power, with a boat speed of about 6-7 km h-1. Before the surveys, the system was calibrated by a standard copper sphere (23 mm diameter, -40.4 dB reference target strength). To evaluate background noise during each survey, the system was initially run in passive mode. The lake was surveyed by five parallel transects in each of the three basins, and by five additional, non-parallel transects in the center of the lake (). The total length of the 20 transects was about 12 km. The recorded raw data were analyzed by Sonar5Pro version 608-33 (Balk and Lindem 2022), converted by the 40logR threshold model with a lower Sv threshold of -100 dB. Single echo detection (SED) was based on minimum echo strength of –80 dB, 0.6 to 1.6 relative pulse lengths, 0.8 angle standard deviation in time (ADT), and maximum gain compensation of 3 dB (one way). SED frequency distributions were expressed in 15 size classes of 2 dB width between -60 and -30 dB, covering fish of about 3 to 30 cm total length (0.1 to 250 g wet mass), which is the typical size range of pelagic coregonids. Fish volumetric abundance (ind. 1000 m-3) was estimated from SED distributions extrapolated on Sv (echointegration), separately for each transect along 13 water layers each 5 m thick, starting at 1 m below the surface (1-6 m, 6-11 m, … , 61-66 m). Layer-specific abundances were averaged across all layers per transect to obtain abundances per transect. Lake-wide fish abundance was calculated as ping-weighted average (± 95% confidence intervals) from the 20 transects, to account for the differing lengths of the transects.
Figure 1: Bathymetric map of Lake Stechlin. Black lines indicate the 20 hydroacoustic transects surveyed annually. The four dashed brown lines indicate the approximate location of the midwater trawl transects.
Total length (TL) of fish (cm) was calculated from target strength (TS, dB) of single echoes by
(1)
(1)
This regression is a recent update for vendace and ciscoes in three north-east German lakes including Lake Stechlin (Wanke et al. 2021), and more adequately matches the TL-TS relationship of fast growing coregonids in Lake Stechlin during eutrophication than the previously applied formula (Mehner 2006), which had been based on fish catches before accelerated eutrophication. Fish length (TL, cm) was converted into fish wet mass (wm, g) by the Lake Stechlin specific formula for coregonids:
(2)
(2)
(Wanke et al. 2021).
Areal fish biomass (kg ha-1) was calculated from fish abundance, wet mass of SEDs and area of the acoustic beam, as sum of biomass from each 5-m layer per transect. Lake-wide fish biomass was calculated as ping-weighted average (± 95% confidence intervals) from the 20 transects, to account for the differing lengths of the transects (). The confidence intervals of fish abundance and biomass hence reflect the horizontal heterogeneity of fish concentrations among the transects. Annual average fish size (g wet mass, ± 95% confidence intervals) was calculated from the summed lake-wide SED distribution in the 15 size classes of 2 dB width from all 20 transects, by converting the mid-class echo strength (in dB) into fish wm (see above). Target strengths of single echoes are measured in dB, which is a variable with logarithmic base. Therefore, the annual average fish size is approximately equivalent to a geometric mean size of fish, accounting for the non-normal distribution of fish wet masses from hydroacoustics.
To characterize DVM of coregonids, their vertical population center (m, ± 95% confidence intervals) was calculated as fish abundance-weighted average of the mean depth of fish in the 13 vertical water layers. The calculations were done separately for daytime and nighttime surveys, and the migration amplitude (m) calculated from the difference between daytime and nighttime population centers. Fish hide directly above the bottom in shallower parts of the lake during daytime, where they cannot be discriminated from bottom echoes. To avoid underestimations of population centers due to hiding fish, we only included the seven transects in the central lake basin, which were 50 m deep at minimum (). Furthermore, we ultimately excluded the shallowest layer (1-6 m) from calculations to prevent that other species than coregonids (bleak, Alburnus alburnus, small perch, Perca fluviatilis) which dominate in the layer close to the surface affect the calculations. The confidence intervals of the population centers reflect the heterogeneity in vertical distribution of coregonids among the 12 water layers between 6 and 66 m.
Midwater trawl surveys were conducted simultaneously with hydroacoustics surveys in June of each year between 2008 and 2019 (2016 missing due to technical malfunction of the equipment). Surveys could not be completed in June 2020 and 2021, and hence we used the data from additional surveys conducted in November of both years. Trawling was also conducted during daytime and nighttime, but only the results from nighttime are reported here because fish are concentrated in deep water layers during daytime, resulting in less reliable estimates of fish abundance and biomass than during nighttime when fish are dispersed vertically and net avoidance is lower at poor illumination. A pelagic trawl with 28/20/10 mm mesh size, 10 mm mesh size in the cod-end and a total length of 14.8 m (stretched on land) was applied. The net with an opening area of approximately 10 m2 (opening width 3.5 m) was towed by a boat (length 7 m, width 2 m), which was driven by a 60 hp engine over four longitudinal transects in the deepest lake basins. Trawling speed (mean ± SD) was 6.5 ± 0.6 km h−1 (1.8 ± 0.2 m s−1), while towed distance, as the product of trawling speed and trawling time, ranged between 500 m and 1600 m (mean 840 m) with an average towing time (±SD) of 7.8 min (±1.9). During each survey, a total of four hauls in the north and central basins of the lake were conducted at approximately 12 m ± 0.65 m, 15 m ± 1.09 m, 25 m ± 2.08 m and 32 m ± 0.90 m (mean ± SD), whereby the two deeper hauls had shorter trawling times and slightly slower hauling speeds. The exact depth and duration of a fishing haul was recorded by diving computers on the head rope of the net. The transects were chosen to facilitate fishing in depths down to about 35 to 38 m. Deeper layers could not be fished because the lake basins deeper than 40 m are usually very narrow and hence a midwater trawl cannot be fished over sufficiently long distance to reliably catch fish (). Coregonids rarely migrate into layers shallower than 10 m depth (Mehner and Schulz 2002; Mehner et al. 2007), and hence true epilimnetic hauls were not conducted. Usually, catches were too large for individual measurements of all fishes. Therefore, we weighed and counted the entire catch and sub-sampled about 200 coregonids for individual measurements of length and mass per hauling depth. Volumetric fish abundance (ind. 1000 m-3) and biomass (g wet mass 1000 m-3) were calculated based on the catches and on active fishing distance of the net during the hauls and the opening area of the net (10 m²). To obtain annual values, the results from the four hauls were arithmetically averaged (± 95% confidence intervals). Because of the catch subsampling with limited individual size measurements, annual average fish size (g wet mass) for trawl catches was calculated by dividing the average fish biomass by the average fish abundance.
Trawl catches almost exclusively consisted of coregonids (vendace, Fontane cisco). Species discrimination was relatively straightforward during the oligotrophic phase of Lake Stechlin (until about 2010) because there were length-at-age differences between the coregonids (Anwand et al. 2003), with Fontane cisco being a dwarf-sized species that matures and spawns in late spring and early summer, in contrast to the autumn-spawning vendace (Schulz and Freyhof 2003). However, eutrophication of the lake has accelerated growth of both coregonids (see results), and hence discrimination between species based on size distributions is no longer strictly reliable. Simple morphological measurements are not appropriate to discriminate between the species either, such that only ripe individuals can safely be determined when caught close to their differing spawning times. Nevertheless, we report the estimated proportion of Fontane cisco in the trawl catches, to coarsely evaluate the long-term dynamics of this endemic species.
Statistical analyses
All analyses were conducted in R (version 4.2.2) (R Development Core Team 2022), and graphs created by the package ‘ggplot2’ (Wickham 2016). Weighted averages and their variances (for calculating 95% confidence intervals) were calculated by the R-package ‘hmisc’ (v. 5.1–1, https://hbiostat.org/R/Hmisc/).
For all variables, we calculated linear regressions between annual means and the year (2008 to 2021). To support interpretation of trends with respect to food-web interactions, we calculated a Pearson correlation matrix among those 14 variables for which the time series was complete (n = 14 datapoints). In both analyses, we considered alpha <0.05 as significant, and alpha <0.10 as strong trend, given that the total number of datapoints in the time series was limited to 14. These analyses were conducted by the package ‘corrplot’ (Wei and Simko 2021).
To understand whether the correlations between the main food web components phytoplankton, zooplankton and pelagic fish were affected across subsequent years, we calculated Pearson cross-correlations with time lags (0 to 3 years) (R Development Core Team 2022). Because of the short life span of coregonids (maximum age 3 years, only very few individuals with 4 or 5 years), longer time lags between interacting food web components likely do not have direct effects.
Results
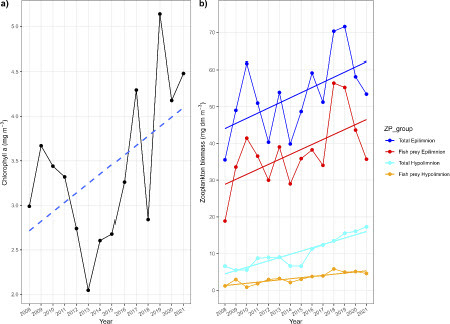
The development of abiotic variables shows a rapid eutrophication of Lake Stechlin in the period between 2008 and 2021 (, ). There was a steep increase of mean TP from about 15 to 20 mg m-3 around 2010 to >50 mg m-3 since 2019 (a). This rapid increase was particularly pronounced if compared with the relatively stable TP concentrations between 1971 and 2010 (Supplement Fig. S1a). Simultaneously, Secchi depth declined from almost 8 m to less than 5 m (b). In contrast, there was no temporal trend in temperatures at either 5 or 40 m depths (c), while oxygen concentrations declined significantly in 40 m depth, but not in 5 m (d). There were strong intra-annual (i.e., seasonal) fluctuations in Secchi depth, temperature and oxygen concentrations (Supplement Fig. S1b-d), but these high-resolution time series supported the trends demonstrated by the annual averages.
Figure 2: Panel a) Temporal trends of annual averages in total phosphorus concentration (mg m-3), b) water temperature (°C) at 5 m and 40 m depths, respectively, c) Secchi depth (m), and d) oxygen concentrations (mg L-1) at 5 m and 40 m depths, respectively, in Lake Stechlin between 2008 and 2021. Solid lines reflect significant (P < 0.05) linear regressions of the variable over time.
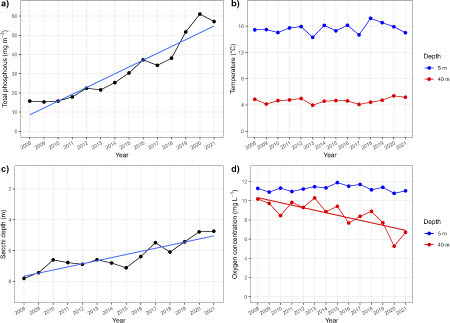
Table 1: Summary of results of linear regressions on temporal trends in abiotic and biotic variables from Lake Stechlin in the years 2008 to 2021. Values are annual averages from high-resolution measurements obtained once or twice per month (abiotic variables, chl a, zooplankton) or from annual fishing surveys conducted in June each year. Hydroacoustic daytime surveys were missing in 2014, while trawl data were missing in 2016. Abbreviations are used in figures showing cross-correlations between variables. wm = wet mass, dm = dry mass.
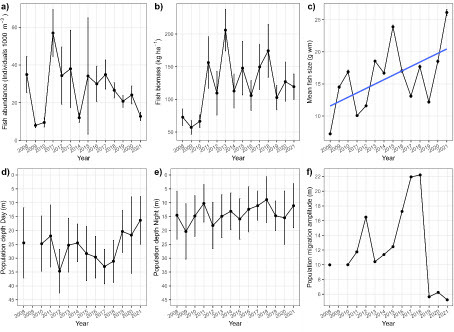
The response of the coregonid populations to the enhanced TP concentrations was less obvious (, ). Fish abundance (a) fluctuated strongly between 2008 and 2010, but from 2011 there appears to be a gradual decline, interrupted only by a single very low value in 2014. Fish biomass (b) was on average stable since 2011, but with approximately 2-year cycles of low and high biomass. In contrast, the significant slope of the linear regression (c) shows that the average fish size (g wet mass) almost doubled during the 14 years of records. Diel vertical migrations of fish were not systematically affected by eutrophication ( d-f, ). However, the average population depth during daytime moved upwards during the last five years since 2017 (d), resulting in a strongly reduced migration amplitude in the years 2019-2021 (f).
Figure 3: Panel a) Temporal trends of volumetric fish abundance (individuals 1000 m-3), b) areal fish biomass (kg wet mass ha-1), c) average individual fish size (g wet mass), d) average population depth during daytime (m), e) average population depth during nighttime (m) and f) average migration amplitude (m) in Lake Stechlin between 2008 and 2021. Dots represent ping-weighted averages (± 95% confidence intervals) of 20 transects (abundance, biomass and population depths), or geometric mean individual fish sizes (± 95% confidence intervals), as calculated from single echo detections from all transects combined. The blue line reflects significant (P < 0.05) linear regression of the variable over time.
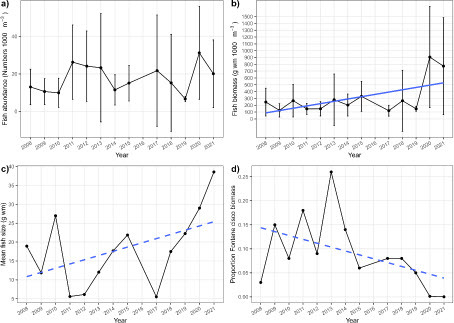
The annual trends of fish populations as obtained by hydroacoustics were partly supported by the results of annual midwater trawl surveys (, ). Average volumetric fish biomass (b) and average fish size (c) increased over time, although high fish biomass were observed in particular in the years 2020 and 2021. The percentage of Fontane cisco in total fish biomass from trawl catches showed a declining trend, primarily caused by very low contributions of cisco during the years since 2018 (d).
Figure 4: Panel a) Temporal trends of volumetric fish abundance (individuals 1000 m-3), b) volumetric fish biomass (g wet mass 1000 m-3), c) mean fish size (g wet mass) and d) proportion of Fontane cisco (Coregonus fontanae) biomass in total trawl catches in Lake Stechlin between 2008 and 2021. Data were obtained by midwater trawl surveys in four water depths in June (2008-2019, survey missed in 2016) or November (2020 and 2021). Dots represent arithmetic averages (± 95% confidence intervals) of four pelagic midwater trawl hauls (abundance, biomass). Mean fish size was calculated as average biomass divided by average abundance. Blue solid line reflects significant (P < 0.05) linear regression of the variable over time, while dotted blue lines reflect linear regressions with P<=0.10.
Chlorophyll a concentration increased, although not strictly linearly, over the period, in particular since 2013 (a, ). Zooplankton biomass significantly increased in both epilimnion (0-22 m) and hypolimnion (22-65 m) (b, ), for both total zooplankton biomass and biomass of fish prey (cladocerans and juvenile copepods). There were strong intra-annual (i.e., seasonal) fluctuations in chl a and zooplankton biomass (Supplement Fig. S2), but these high-resolution time series supported the trends demonstrated by the annual averages.
Figure 5: Panel a) Temporal trends of chlorophyll a concentration (mg m-3), and b) zooplankton volumetric biomass (mg dry mass m-3) in Lake Stechlin between 2008 and 2021. Chlorophyll a data reflect samples mixed from 0-5 m (May to October) or 0-10 m (November to April) depths, and averaged annually. Zooplankton were sampled in epilimnetic (0-22 m) and hypolimnetic layers (22-65 m), and expressed as either total biomass of all taxa, or biomass of taxa known to be prey for coregonid fishes (cladocerans, juvenile copepods). Data were obtained by one or two samples per month per year, and averaged to annual values. Solid lines reflect significant (P < 0.05) linear regressions, dashed line reflect a strong temporal trend (P ≤ 0.10) of the variable over time.
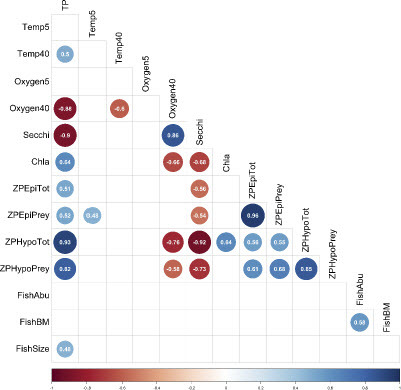
For an understanding of temporal co-development of variables in Lake Stechlin, we calculated a Pearson correlation matrix (fixing significance at P ≤ 0.10) among those 14 variables with a complete dataset over 14 years, excluding data from trawl surveys and daytime hydroacoustics. Total phosphorus concentration in Lake Stechlin was positively correlated with chl a concentration and hypolimnetic zooplankton biomass, and showed a strong positive trend also with epilimnetic zooplankton biomass and fish size (). Chlorophyll a concentration correlated positively with hypolimnetic zooplankton biomass. In turn, TP concentration was strongly negatively correlated with Secchi depth and oxygen concentration at 40 m depth, and hence zooplankton biomass negatively correlated to Secchi depth and oxygen concentrations in 40 m depth. All zooplankton data correlated positively with each other, as did fish abundance and biomass.
Figure 6: Bivariate Pearson correlation matrix among 14 annually averaged variables (for abbreviations, see ) from Lake Stechlin between 2008 and 2021. Fish variables were obtained by nighttime hydroacoustics. Values are correlation coefficients for pairs of variables. Strong trends (P ≤ 0.10 for n = 14 years) in positive correlations are indicated by blue circles, while strong trends in negative correlations are indicated by red circles. Circle size and color intensity scale with interaction strengths.
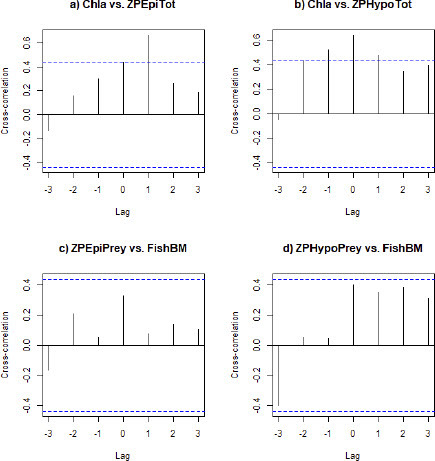
To test for potential cross correlations with time lags between the main trophic variables chl a concentration, zooplankton biomass and fish biomass, we plotted the cross-correlation with maximum time lag up to 3 years. For the correlation between chl a and epilimnetic zooplankton biomass, a time lag +1 year indeed improved correlation strengths relative to lag = 0 (a). In contrast, the correlations between chl a and hypolimnetic zooplankton biomass (b) or between epilimnetic or hypolimnetic zooplankton prey biomass and fish biomass were strongest at lag = 0 (c, d).
Figure 7: Cross-correlations with time lags up to three years between chlorophyll a concentration and zooplankton biomass in the epilimnion (a), chlorophyll a concentration and zooplankton biomass in the hypolimnion (b), zooplankton biomass of epilimnetic fish prey groups and fish biomass (c) and zooplankton biomass of hypolimnetic fish prey groups and fish biomass (d). Horizontal dashed blue lines represent 90% confidence intervals.
Discussion
This study shows a strong correlation between increasing TP concentrations and increasing phytoplankton and zooplankton biomass, as well as decreasing Secchi depths and oxygen concentrations at 40 m depth in Lake Stechlin during the time period from 2008 to 2021. In contrast, there was only a weak correspondence between temporal developments of fish-related variables and the other biotic and abiotic variables measured, except a positive correlation between TP and mean fish size. Overall, these results suggest a strong bottom-up directed control of abiotic and pelagic biotic variables by TP concentration in the originally oligo- to mesotrophic Lake Stechlin, but this control seems to be interrupted at the link between zooplankton and fish. In a similar way, the fish community of Lake Balaton only weakly responded to long-term eutrophication and re-oligotrophication (Bernat et al. 2020). Nevertheless, the temporal development of the pelagic fish populations, the decrease in Fontane cisco catch proportions, and changes in the patterns of DVM suggest that also the fish populations were affected by the accelerated eutrophication of Lake Stechlin. In contrast, within the investigated period, direct effects of global warming on the water temperature in either 5 m or 40 m depths in the lake could not be detected. The average annual temperature in the epilimnetic layer at 5 m depth may respond only slowly to global warming trends. However, increasing surface water temperatures reported earlier (Kirillin et al. 2013), and a prolonged stratification period are considered as the critical mechanisms for the change of phytoplankton in Lake Stechlin during the last years (Selmeczy et al. 2019; Kröger et al. 2023). These temperature trends correspond with global analyses of lake temperatures during the last decades, showing stronger warming of surface temperatures, but on average stable deepwater temperatures (Pilla et al. 2020). However, it has to be noted that the combined effect of eutrophication and prolonged stratification periods has exacerbated the oxygen consumption in deepwater layers, and hence there may be indirect effects from global warming on the available habitat of coregonids.
The positive correlation between TP and chl a is in line with the observed increase in total phytoplankton biomass with eutrophication of Lake Stechlin over the recent decade (Kröger et al. 2023). However, changes were also detected with respect to phytoplankton composition, with a pronounced shift to dominance of cyanobacteria, specifically Planktothrix rubescens (Selmeczy et al. 2019; Kröger et al. 2023). While previous studies suggested that this shift towards less edible or even toxic phytoplankton taxa may lead to a trophic decoupling between phyto- and zooplankton (Selmeczy et al. 2019), the joint positive trend of chl a, zooplankton biomass and mean fish size shown here supports a bottom-up effect of eutrophication on the pelagic community. In contrast, trends of increasing phytoplankton biomass but decreasing epilimnetic zooplankton biomass have been suggested for Lake Stechlin for the period 1994 to 2014 (Selmeczy et al. 2019). Due to annual fluctuations in zooplankton biomass, in particular in the epilimnion, it is difficult to determine an exact year when zooplankton biomass started to increase. However, when focusing only on the years with low biomass in the cyclic fluctuations (2008, 2013, 2014, 2017 and 2021), it is obvious that 2017 and 2021 showed higher biomass than observed in 2012 and 2014. We therefore propose that there is meanwhile an increase of zooplankton biomass, which is considered a delayed response to the eutrophication induced by higher TP concentrations and phytoplankton biomass that has started already at about 2000 to 2005 (Selmeczy et al. 2019), but has only become evident with a time lag of about 10 years. The correlation between chl a in one year with epipelagic zooplankton biomass the following year could be indicative of some cross-annual community feedback (Klausmeier and Litchman 2012; Wollrab et al. 2021); however, this would have to be further investigated.
The pelagic coregonid fish populations likewise seem to respond to the higher production capacity as induced by TP, reflected by an increase of the mean fish size (found for both trawl and hydroacoustics data, most pronounced in 2020 and 2021) and of the fish biomass (found only in trawl data). Detailed analyses of fish size distributions also documented a trend towards larger fish (Braun and Mehner 2021), while overall fish abundance estimated by hydroacoustics seems to have declined during the last years since 2017. A plausible explanation for a shift from higher density but low mean individual size (2008-2017) to lower density and higher mean size (in particular since 2020) may be a release of the pelagic fish from density-dependent growth limitation (Arranz et al. 2016), for example caused by the higher zooplankton prey biomass induced by lake eutrophication. Similar density-dependent responses to eutrophication and re-oligotrophication have been documented for the related Lake Constance whitefish (Coregonus spp.) (DeWeber et al. 2022). In the experimentally divided Lake 226 (Canada), growth rates and biomass of lake whitefish (C. clupeaformis) were stimulated by phosphorus fertilization (Mills and Chalanchuk 1987). After fertilization had been stopped, growth and biomass declined in particular in the larger individuals (Mills et al. 1998). However, growth rates and population dynamics of both vendace and Fontane cisco in Lake Stechlin cannot be estimated without continuously reading the ages of fishes. Catch analyses in subsequent years will show whether the high density – small size characteristics of vendace documented for decades in Lake Stechlin will stably switch to the low or moderate density - large size situation found in vendace populations in other lakes in that region (Wanke et al. 2021).
A potential future stressor may be found in the reduced oxygen concentrations in deeper water layers. While annual averages of oxygen concentrations still demonstrate relatively high values even in larger water depths, complete oxygen depletion has occurred in layers below 40-45 m during the last autumn periods (as indicated by the full time series of oxygen concentrations, Supplement Fig. 1), caused by an increase of oxygen consumption rates during extended summer stratification periods (Selmeczy et al. 2019). The reduced availability of suitable oxythermal habitat in stratified lakes is considered the major threat for the persistence of ciscoes in warming and eutrophying lakes (Lyons et al. 2018; Magee et al. 2019; Grow et al. 2022). In addition, vendace usually spawn in December, and hence also the development of their eggs may become impaired by low oxygen concentrations, as known for example for the whitefish (Müller 1992; Müller and Stadelmann 2004). However, we do not have sufficiently accurate data on densities of early life stages of coregonids to quantify long-term trends in reproduction.
The coregonid fish biomass remained on average stable over the last 10 years until 2021, but was characterized by the typical population cycles with alternating high and low biomass among years which were found also in other lakes (Hamrin and Persson 1986; Marjomäki et al. 2021; Sarvala and Helminen 2021). These population cycles are interpreted as effects of inter-cohort competition among coregonid age classes (Hamrin and Persson 1986), and are well reflected in stage-structured theory and cohort-driven cycles (de Roos and Persson 2003; Huss et al. 2012). Therefore, the permanence of biomass cycles in Lake Stechlin suggests that reproduction rates of vendace are still intact. The drastically higher fish biomass in trawl catches during the few last years (mainly 2020 and 2021) contradict the hydroacoustic records that remained stable on average. However, it is more likely that the catches by the trawl have increased because the ciscoes occurred in shallower waters, and hence were more exposed to the midwater trawling surveys than in the years before (compare Stone et al. 2020).
All correlations between zooplankton and fish biomass were weak, but positive. There was no evidence that feeding by zooplanktivorous coregonids had an overall net top-down effect on crustacean mesozooplankton in Lake Stechlin, because negative correlations between fish and zooplankton were not detected. This result strengthens our earlier analyses that the selective feeding of coregonids on cladocerans and immature copepods may affect the community composition of zooplankton, but has no strong net effects on total zooplankton biomass (Mehner et al. 2008; Braun et al. 2021). It is however possible that a significant fraction of the increased growth potential for some zooplankton taxa may have been transferred into fish biomass, and that fish predation therefore had a top-down effect on these zooplankton taxa, but this can only be detected by detailed studies of trophic interactions between specific feeding guilds, in future studies. Zooplankton biomass in Lake Stechlin are dominated by large calanoid copepods most of the year, whose adult stages may escape from fish predation by high mobility and hence rarely occur in the diet of the coregonids (Schulz et al. 2003). Furthermore, coregonids perform extended DVM in this deep lake (Mehner et al. 2007) and hence feed on both hypolimnetic and epilimnetic zooplankton during their migrations, which may dilute the per-capita predation effect in comparison to planktivorous fish in shallow lakes. It is possible that the very recent variation of the DVM amplitudes is an early warning signal for the simultaneous effects of warming and eutrophication on the coregonids. Between 2019 and 2021, night-time population depths were deeper (potentially in response to warmer surface temperature and deeper thermocline) and day-time depths shallower (potentially in response to oxygen decline in deep-water layers) in comparison to the previous years, resulting in remarkably small migration amplitudes. The ultimate causation of DVM is seen in the interaction among food availability, predator avoidance and bioenergetics benefits (Mehner 2012). Modelling demonstrated that changes in populations centers and migration amplitudes in response to global warming will modify fish-zooplankton interactions in the lake substantially (Busch et al. 2012), with so far unpredictable consequences for the dynamics of the interacting populations and the lake food web.
The fish-related change in Lake Stechlin that concerned us most is the population development of the endemic Fontane cisco. Vendace and cisco co-occur in the pelagic area albeit in differing depths (Mehner et al. 2010a), but species cannot be discriminated by hydroacoustics. Active catches by trawling and size-at-age data that differed among the species (Anwand et al. 2003) have so far provided a somehow reliable basis for species discrimination, and hence for evaluating long-term population trends of both species. However, the higher average sizes, potentially caused by acceleration of growth rates through higher prey availability, were also found in Fontane cisco, and hence the species can no longer be separated according to their size distributions. Only those individuals of cisco that are caught in ripe maturation stage during annual trawling in June can safely be determined as belonging to the endemic species. Based on these data, the population density of Fontane cisco has massively declined from >25% proportion in trawl catch in 2013 to <1% in 2020 and 2021. Proportions <10% have also been found in 2008, 2010 and 2012, but the number of ripe and running Fontane cisco in the trawl catches has indeed become very small recently. Population genetic data suggest low differentiation among the species during the last years (Mehner et al. 2021), and may indicate potential hybridization (Mehner et al. 2010b). The loss of a unique genetic resource seems to be possible, because warmer autumn and winter temperatures and delayed or missing fall overturn circulations of the lake may delay the onset of spawning in vendace, while maturation of the spring-spawning cisco may become accelerated, with potential risk of in-part overlap in spawning times in the late winter months (January to early March). With respect to conservation importance, potential hybridization among the two coregonid species, or effects of eutrophication and warming on either species, have to be studied in detail to understand, which restoration measures may prevent that the Fontane cisco will disappear entirely from Lake Stechlin. Similar reasons for the loss of endemic cisco species from lakes in Sweden have been discussed (Delling and Palm 2019). Global analyses show that lakes with currently observed strong thermal habitat change are also those that harbor numerous endemic species, suggesting that conservation actions should also address changes in thermal habitats of lakes to preserve lake biodiversity (Kraemer et al. 2021).
Our results show the value of annual monitoring of abiotic and biotic variables in lakes, including surveys to evaluate fish abundances and biomass However, even the 14 years with annual fish surveys in Lake Stechlin shown here seem to be insufficient for a mechanistic analysis of stressor-induced changes, and many of our conclusions are in part speculative and based on trends or single years with strongly deviating data. Although the TP concentrations in Lake Stechlin have increased strongly and rapidly, the biomass of the pelagic coregonid fishes have not yet declined, as it would be predicted by conceptual models demonstrating a shift to percid or cyprinid fish dominance with lake eutrophication (Persson L et al. 1991; Mehner et al. 2005; Mehner and Brucet 2022). Rather, the coregonid populations in Lake Stechlin seem to develop into a different state, with higher growth rates at lower population densities, but with strong annual biomass cycles. From the perspective of commercial fisheries, the larger individual size that vendace has achieved now is beneficial and becomes more similar to the maximum size documented for vendace at low fish densities in other lakes in this region (Wanke et al. 2017, 2021). The fast growth may in turn expose the fish already in their first year to high fisheries mortality if mesh size of commercial gillnet fisheries is not adapted (Wanke et al. 2021). It would be interesting to calculate secondary production of zooplankton and fish and estimate trophic transfer efficiency (TTE) to explore whether the higher zooplankton biomass observed during the most recent years is transferred into higher fish production rates in the long-term. Previous TTE estimates indicated a rather inefficient transfer in Lake Stechlin (Schulz et al. 2004). For a mechanistic understanding of changing food-web connection strengths, diet tracing would be required, e.g. by stable isotopes, and these data could be compared with similar data obtained about 20 years ago (Helland et al. 2008). However, ongoing eutrophication combined with further intensified warming may deteriorate the availability of cold-water habitats for coregonids substantially. Long-term data of fish populations from several European lakes show strong responses to warming (Jeppesen et al. 2012), suggesting that the current situation of pelagic fish populations in Lake Stechlin may be transient, with unanticipated consequences if the eutrophication cannot be stopped.
Mehner_etal_SuppInformation.docx
Download MS Word (670.9 KB)Acknowledgements
We would like to thank A. Vogt, K. Jäschke, A. Türck, J. Hallermann, C. Helms and several PhD and MSc students for support during the fish sampling, and P. Kasprzak, E. Huth and C. Dilewski for organizing sampling and conducting the zooplankton analyses. Sampling and measurements of Secchi depth, water temperature, oxygen, total phosphorus and chlorophyll a concentration was made possible by a large number of technicians and scientists, including S.A. Berger, U. Beyer, M. Bodenlos, P. Casper, M. Degebrodt, R. Degebrodt, L. Ganzert, M.O. Gessner, H.-P. Grossart, E. Huth, P. Kasprzak, L. Krienitz, M. Lentz, E. Mach, U. Mallok, M. Papke, A. Penske, S. Pinnow, R. Roßberg, M. Sachtleben, A. Scheffler, W. Scheffler, S. Schmidt and J.N. Woodhouse. Two anonymous referees gave insightful comments, which helped improving the manuscript.
References
- Adams H, Ye JE, Persaud BD, Slowinski S, Pour HK, Van Cappellen P. 2022. Rates and timing of chlorophyll-a increases and related environmental variables in global temperate and cold-temperate lakes. Earth System Science Data. 14(11):5139-5156. doi: 10.5194/essd-14-5139-2022.
- Anwand K. 1998. Comparisons of annual gonad cycle and fecundity between nominate and deepwater forms of vendace (Coregonus albula L.) in Lake Stechlin (State of Brandenburg, Germany). J Appl Ichthyol. 14:97-100.
- Anwand K, Valentin M, Mehner T. 2003. Species composition, growth and feeding ecology of fish community in Lake Stechlin - an overview. Archiv für Hydrobiologie, Special Issues Advances in Limnology. 58:237-246.
- Argillier C, Causse S, Gevrey M, Pedron S, De Bortoli J, Brucet S, Emmrich M, Jeppesen E, Lauridsen T, Mehner T et al. 2013. Development of a fish-based index to assess the eutrophication status of European lakes. Hydrobiologia. 704(1):193-211. doi: 10.1007/s10750-012-1282-y.
- Arranz I, Mehner T, Benejam L, Argillier C, Holmgren K, Jeppesen E, Lauridsen TL, Volta P, Winfield IJ, Brucet S. 2016. Density-dependent effects as key drivers of intraspecific size structure of six abundant fish species in lakes across Europe. Can J Fish Aquat Sci. 73(4):519-534. doi: 10.1139/cjfas-2014-0508.
- Balk H, Lindem T. 2022. Sonar4 and Sonar5-Pro post processing systems, Operator manual version 608.33. Oslo: CageEye A/S.
- Bernat G, Boross N, Somogyi B, Voros L, G-Toth L, Boros G. 2020. Oligotrophication of Lake Balaton over a 20-year period and its implications for the relationship between phytoplankton and zooplankton biomass. Hydrobiologia. 847(19):3999-4013. doi: 10.1007/s10750-020-04384-x.
- Blanco S, Romo S, Villena MJ, Martinez S. 2003. Fish communities and food web interactions in some shallow Mediterranean lakes. Hydrobiologia. 506(1-3):473-480. doi: 10.1023/B:HYDR.0000008583.05327.da.
- Bottrell HH, Duncan A, Gliwicz ZM, Grygierek E, Herzig A, Hillbricht-Ilkowska A, Kurasawa H, Larsson P, Weglenska T. 1976. A review of some problems in zooplankton production studies. Norwegian Journal of Zoology. 24:419-456.
- Braun LM, Brucet S, Mehner T. 2021. Top-down and bottom-up effects on zooplankton size distribution in a deep stratified lake. Aquat Ecol. 55:527–543. doi: 10.1007/s10452-021-09843-8.
- Braun LM, Mehner T. 2021. Size spectra of pelagic fish populations in a deep lake - methodological comparison between hydroacoustics and midwater trawling. Water-Sui. 13(11):ARTN 1559. doi: 10.3390/w13111559.
- Brucet S, Pedron S, Mehner T, Lauridsen TL, Argillier C, Winfield IJ, Volta P, Emmrich M, Hesthagen T, Holmgren K et al. 2013. Fish diversity in European lakes: geographical factors dominate over anthropogenic pressures. Freshwat Biol. 58(9):1779-1793. Doi: 10.1111/Fwb.12167.
- Busch S, Johnson BM, Mehner T. 2011. Energetic costs and benefits of cyclic habitat switching: a bioenergetics model analysis of diel vertical migration in coregonids. Can J Fish Aquat Sci. 68:706-717.
- Busch S, Kirillin G, Mehner T. 2012. Plasticity in habitat use determines metabolic response of fish to global warming in stratified lakes. Oecologia. 170(1):275-287. doi: 10.1007/s00442-012-2286-z.
- Casper J. 1985. Lake Stechlin - a temperate oligotrophic lake. MonogrBiol. 58:883.
- Comte L, Buisson L, Daufresne M, Grenouillet G. 2013. Climate-induced changes in the distribution of freshwater fish: observed and predicted trends. Freshwat Biol. 58(4):625-639. doi: 10.1111/fwb.12081.
- Culver DA, Boucherle MM, Bean DJ, Fletcher JW. 1985. Biomass of fresh-water crustacean zooplankton from length weight regressions. Can J Fish Aquat Sci. 42(8):1380-1390. doi: 10.1139/f85-173.
- de Roos AM, Persson L. 2003. Competition in size-structured populations: mechanisms inducing cohort formation and population cycles. Theor Popul Biol. 63(1):1-16. doi: 10.1016/S0040-5809(02)00009-6.
- Delling B, Palm S. 2019. Evolution and disappearance of sympatric Coregonus albula in a changing environment-A case study of the only remaining population pair in Sweden. Ecol Evol. 9(22):12727-12753. doi: 10.1002/ece3.5745.
- DeWeber JT, Baer J, Rösch R, Brinker A. 2022. Turning summer into winter: nutrient dynamics, temperature, density dependence and invasive species drive bioenergetic processes and growth of a keystone coldwater fish. Oikos. 2022(9):e09316. doi: 10.1111/oik.09316.
- Diekmann M, Brämick U, Lemcke R, Mehner T. 2005. Habitat-specific fishing revealed distinct indicator species in German lowland lake fish communities. J Appl Ecol. 42:901-909.
- DIN38412-16:1985-12. 1985. German standard methods for the examination of water, waste water and sludge; test methods using water organisms (group L); determination of chlorophyll a in surface water (L 16)
- Dumont HJ, Vandevelde I, Dumont S. 1975. Dry weight estimate of biomass in a selection of cladocera, copepoda and rotifera from plankton, periphyton and benthos of continental waters. Oecologia. 19(1):75-97. doi: 10.1007/Bf00377592.
- DWD. 2019. Klimareport Brandenburg. Offenbach am Main: Deutscher Wetterdienst.
- Eckmann R, Rösch R. 1998. Lake Constance fisheries and fish ecology. Archiv für Hydrobiologie, Special Issues Advances in Limnology. 53:285-301.
- Einsle U. 1993. Crustacea, Copepoda, Calanoida und Cyclopoida. In: Schwoerbel J, Zwick P, editors. Die Süßwasserfauna von Mitteleuropa Band 8/4-1. Stuttgart: Fischer; p. 1-208.
- Flössner D. 2000. Die Haplopoda und Cladocera (ohne Bosminidae) Mitteleuropas. Leiden: Bachhuys.
- Garcia XF, Diekmann M, Brämick U, Lemcke R, Mehner T. 2006. Correlations between type-indicator fish species and lake productivity in German lowland lakes. J Fish Biol. 68:1144-1157.
- Grow RC, Zimmer KD, Cruise JL, Emms SK, Miller LM, Herwig BR, Staples DF, Tipp AR, Gerdes GM, Jacobson PC. 2022. Oxythermal habitat as a primary driver of ecological niche and genetic diversity in cisco (Coregonus artedi). Can J Fish Aquat Sci. 79(3):503-517. doi: 10.1139/cjfas-2021-0059.
- Hamrin SF, Persson L. 1986. Asymmetrical competition between age classes as a factor causing population oscillations in an obligate planktivorous fish species. Oikos. 47:223-232.
- Haney JF, Hall DJ. 1973. Sugar-coated Daphnia: a preservation technique for Cladocera. Limnol Oceanogr. 18:331-333.
- Hartmann J, Nümann W. 1977. Percids of Lake Constance, a lake undergoing eutrophication. J Fish Res Board Can. 34:1670-1677.
- Heino J, Alahuhta J, Bini LM, Cai YJ, Heiskanen AS, Hellsten S, Kortelainen P, Kotamaki N, Tolonen KT, Vihervaara P et al. 2021. Lakes in the era of global change: moving beyond single-lake thinking in maintaining biodiversity and ecosystem services. Biol Rev. 96(1):89-106. doi: 10.1111/brv.12647.
- Heino J, Culp JM, Erkinaro J, Goedkoop W, Lento J, Ruhland KM, Smol JP. 2020. Abruptly and irreversibly changing Arctic freshwaters urgently require standardized monitoring. J Appl Ecol. 57(7):1192-1198. doi: 10.1111/1365-2664.13645.
- Helland IP, Harrod C, Freyhof J, Mehner T. 2008. Coexistence of a pair of pelagic planktivorous coregonid fish. Evol Ecol Res. 10:373-390.
- Huss M, Gårdmark A, Van Leeuwen A, de Roos AM. 2012. Size- and food-dependent growth drives patterns of competitive dominance along productivity gradients. Ecology. 93(4):847-857. doi: 10.1890/11-1254.1.
- ISO_15681-1:2003. 2003. Water quality — Determination of orthophosphate and total phosphorus contents by flow analysis (FIA and CFA) — Part 1: Method by flow injection analysis (FIA).
- Jane SF, Hansen GJA, Kraemer BM, Leavitt PR, Mincer JL, North RL, Pilla RM, Stetler JT, Williamson CE, Woolway RI et al. 2021. Widespread deoxygenation of temperate lakes. Nature. 594(7861):66-70. doi: 10.1038/s41586-021-03550-y.
- Jeppesen E, Canfield DE, Bachmann RW, Sondergaard M, Havens KE, Johansson LS, Lauridsen TL, Tserenpil S, Rutter RP, Warren G et al. 2020. Toward predicting climate change effects on lakes: a comparison of 1656 shallow lakes from Florida and Denmark reveals substantial differences in nutrient dynamics, metabolism, trophic structure, and top-down control. Inland Waters. 10(2):197-211. Doi: 10.1080/20442041.2020.1711681.
- Jeppesen E, Meerhoff M, Holmgren K, Gonzalez-Bergonzoni I, Teixeira-de Mello F, Declerck SAJ, De Meester L, Sondergaard M, Lauridsen TL, Bjerring R et al. 2010. Impacts of climate warming on lake fish community structure and potential effects on ecosystem function. Hydrobiologia. 646(1):73-90. doi: 10.1007/s10750-010-0171-5.
- Jeppesen E, Mehner T, Winfield IJ, Kangur K, Sarvala J, Gerdeaux D, Rask M, Malmquist HJ, Holmgren K, Volta P et al. 2012. Impacts of climate warming on the long-term dynamics of key fish species in 24 European lakes. Hydrobiologia. 694(1):1-39. doi: 10.1007/s10750-012-1182-1.
- Kangur K, Park YS, Kangur A, Kangur P, Lek S. 2007. Patterning long-term changes of fish community in large shallow Lake Peipsi. Ecol Model. 203(1-2):34-44. doi: 10.1016/j.ecolmodel.2006.03.039.
- Kiefer F, Fryer G. 1978. Das Zooplankton der Binnengewässer (2. Teil). In: Elster HJ, Ohle W, editors. Die Binnengewässer, Bd 26. Stuttgart: Schweizerbart; p. 1-380.
- Kirillin G, Shatwell T, Kasprzak P. 2013. Consequences of thermal pollution from a nuclear plant on lake temperature and mixing regime. J Hydrol. 496:47-56. doi: 10.1016/j.jhydrol.2013.05.023.
- Klausmeier CA, Litchman E. 2012. Successional dynamics in the seasonally forced diamond food web. Am Nat. 180(1):1-16. doi: 10.1086/665998.
- Koschel R, Adams DD. 2003. Lake Stechlin: an approach to understanding an oligotrophic lowland lake. Stuttgart: Schweizerbart.
- Kraemer BM, Mehner T, Adrian R. 2017. Reconciling the opposing effects of warming on phytoplankton biomass in 188 large lakes. Sci Rep-Uk. 7:ARTN 10762. doi: 10.1038/s41598-017-11167-3.
- Kraemer BM, Pilla RM, Woolway RI, Anneville O, Ban SH, Colom-Montero W, Devlin SP, Dokulil MT, Gaiser EE, Hambright KD et al. 2021. Climate change drives widespread shifts in lake thermal habitat. Nature Climate Change. 11(6):521-529. doi: 10.1038/s41558-021-01060-3.
- Kröger B, Selmeczy GB, Casper P, Soininen J, Padisak J. 2023. Long-term phytoplankton community dynamics in Lake Stechlin (north-east Germany) under sudden and heavily accelerating eutrophication. Freshwat Biol. 68(5):737-751. doi: 10.1111/fwb.14060.
- Kubecka J. 1993. Succession of fish communities in reservoirs of Central and Eastern Europe. In: Straskrabova M, Duncan A, editors. Comparative reservoir limnology and water quality management. Amsterdam: Kluwer; p. 153-168.
- Lampert W, Taylor BE. 1985. Zooplankton grazing in a eutrophic lake - implications of diel vertical migration. Ecology. 66(1):68-82. doi: 10.2307/1941307.
- Lyons J, Parks TP, Minahan KL, Ruesch AS. 2018. Evaluation of oxythermal metrics and benchmarks for the protection of cisco (Coregonus artedi) habitat quality and quantity in Wisconsin lakes. Can J Fish Aquat Sci. 75(4):600-608. doi: 10.1139/cjfas-2017-0043.
- Maasri A, Jähnig SC, Adamescu MC, Adrian R, Baigun C, Baird DJ, Batista-Morales A, Bonada N, Brown LE, Cai QH et al. 2022. A global agenda for advancing freshwater biodiversity research. Ecol Lett. 25(2):255-263. doi: 10.1111/ele.13931.
- Magee MR, McIntyre PB, Hanson PC, Wu CH. 2019. Drivers and Management Implications of Long-Term Cisco Oxythermal Habitat Decline in Lake Mendota, WI. Environ Manage. 63(3):396-407. doi: 10.1007/s00267-018-01134-7.
- Marjomäki TJ, Auvinen H, Helminen H, Huusko A, Huuskonen H, Hyvärinen P, Jurvelius J, Sarvala J, Valkeajärvi P, Viljanen M et al. 2021. Occurrence of two-year cyclicity, "saw-blade fluctuation", in vendace populations in Finland. Ann Zool Fenn. 58(4-6):215-229. doi: 10.5735/086.058.0408.
- Mehner T. 2006. Prediction of hydroacoustic target strength of vendace (Coregonus albula) from concurrent trawl catches. Fish Res. 79:162-169.
- Mehner T. 2012. Diel vertical migration of freshwater fishes - proximate triggers, ultimate causes and research perspectives. Freshwat Biol. 57(7):1342-1359. doi: 10.1111/j.1365-2427.2012.02811.x.
- Mehner T. 2015. Partial diel vertical migration of sympatric vendace (Coregonus albula) and Fontane cisco (Coregonus fontanae) is driven by density dependence. Can J Fish Aquat Sci. 72(1):116-124. doi: 10.1139/cjfas-2014-0009.
- Mehner T, Brucet S. 2022. Structure of fish communities in lakes and its abiotic and biotic determinants. In: Mehner T, Tockner K, editors. Encyclopedia of Inland Waters (2nd ed). San Diego: Elsevier; p. 77-88.
- Mehner T, Busch S, Helland IP, Emmrich M, Freyhof J. 2010a. Temperature-related nocturnal vertical segregation of coexisting coregonids. Ecol Freshwat Fish. 19:408-419.
- Mehner T, Diekmann M, Brämick U, Lemcke R. 2005. Composition of fish communities in German lakes as related to lake morphology, trophic state, shore structure and human use intensity. Freshwat Biol. 50:70-85.
- Mehner T, Kasprzak P, Hölker F. 2007. Exploring ultimate hypotheses to predict diel vertical migrations in coregonid fish. Can J Fish Aquat Sci. 64:874-886.
- Mehner T, Padisak J, Kasprzak P, Koschel R, Krienitz L. 2008. A test of food web hypotheses by exploring time series of fish, zooplankton and phytoplankton in an oligo-mesotrophic lake. Limnologica. 38(doi: 10.1016/j.limno.2008.05.001): 179-188.
- Mehner T, Palm S, Delling B, Karjalainen J, Kielpinska J, Vogt A, Freyhof J. 2021. Genetic relationships between sympatric and allopatric Coregonus ciscoes in North and Central Europe. Bmc Ecol Evol. 21(1):ARTN 186. doi: 10.1186/s12862-021-01920-8.
- Mehner T, Pohlmann K, Elkin C, Monaghan MT, Nitz B, Freyhof J. 2010b. Genetic population structure of sympatric and allopatric populations of Baltic ciscoes (Coregonus albula complex, Teleostei, Coregonidae). BMC Evol Biol. 10:85.
- Mehner T, Schulz M. 2002. Monthly variability of hydroacoustic fish stock estimates in a deep lake and its correlation to gillnet catches. J Fish Biol. 61:1109-1121.
- Mills KH, Chalanchuk SM. 1987. Population dynamics of Lake Whitefish (Coregonus clupeaformis) during and after the fertilization of Lake-226, the Experimental Lakes Area. Can J Fish Aquat Sci. 44:55-63.
- Mills KH, McCulloch BR, Chalanchuk SM, Allan DJ, Stainton MP. 1998. Growth, size, structure, and annual survival of Lake Whitefish (Coregonus clupeaformis) during eutrophication and oligotrophication of Lake 226, the Experimental Lakes Area, Canada. Archiv für Hydrobiologie, Special Issues Advances of Limnology. 50:151-160.
- Müller R. 1992. Trophic state and its implications for natural reproduction of salmonid fish. Hydrobiologia. 243:261-268. doi: 10.1007/Bf00007041.
- Müller R, Stadelmann P. 2004. Fish habitat requirements as the basis for rehabilitation of eutrophic lakes by oxygenation. Fish Manage Ecol. 11(3-4):251-260. doi: 10.1111/j.1365-2400.2004.00393.x.
- Oberdorff T. 2022. Time for decisive actions to protect freshwater ecosystems from global changes. Knowl Manag Aquat Ec. 423(423):ARTN 19. doi: 10.1051/kmae/2022017.
- Persson G, Ekbohm G. 1980. Estimation of dry-weight in zooplankton populations - methods applied to crustacean populations from lakes in the Kuokkel area, Northern Sweden. Arch Hydrobiol. 89(1-2):225-246.
- Persson L, Diehl S, Johansson L, Andersson G, Hamrin SF. 1991. Shifts in fish communities along the productivity gradient of temperate lakes - patterns and the importance of size-structured interactions. J Fish Biol. 38:281-293.
- Pilla RM, Williamson CE, Adamovich BV, Adrian R, Anneville O, Chandra S, Colom-Montero W, Devlin SP, Dix MA, Dokulil MT et al. 2020. Deeper waters are changing less consistently than surface waters in a global analysis of 102 lakes. Sci Rep-Uk. 10(1):ARTN 20514. doi: 10.1038/s41598-020-76873-x.
- R Development Core Team. 2022. R: a language and environment for statistical computing. Vienna, Austria: R Foundation for Statistical Computing.
- Reid AJ, Carlson AK, Creed IF, Eliason EJ, Gell PA, Johnson PTJ, Kidd KA, MacCormack TJ, Olden JD, Ormerod SJ et al. 2019. Emerging threats and persistent conservation challenges for freshwater biodiversity. Biol Rev. 94(3):849-873. doi: 10.1111/brv.12480.
- Rennie MD, Kennedy PJ, Mills KH, Rodgers CMC, Charles C, Hrenchuk LE, Chalanchuk S, Blanchfield PJ, Paterson MJ, Podemski CL. 2019. Impacts of freshwater aquaculture on fish communities: A whole-ecosystem experimental approach. Freshwat Biol. 64(5):870-885. doi: 10.1111/fwb.13269.
- Ritterbusch D, Blabolil P, Breine J, Erös T, Mehner T, Olin M, Peirson G, Volta P, Poikane S. 2022. European fish-based assessment reveals high diversity of systems for determining ecological status of lakes. Sci Total Environ. 802:ARTN 149620. doi: 10.1016/j.scitotenv.2021.149620.
- Ritterbusch D, Brämick U, Mehner T. 2014. A typology for fish-based assessment of the ecological status of lowland lakes with description of the reference fish communities. Limnologica. 49:18-25. doi: 10.1016/j.limno.2014.08.001.
- Sarvala J, Helminen H. 2021. Two-year cycle of vendace (Coregonus albula) in Pyhajarvi, SW Finland: evidence for asymmetric competition between adults and juveniles. Ann Zool Fenn. 58(4-6):191-213. doi: 10.5735/086.058.0407.
- Schulz M, Freyhof J. 2003. Coregonus fontanae, a new spring-spawning cisco from Lake Stechlin, northern Germany (Salmoniformes: Coregonidae). Ichthyol Explor Freshwat. 14:209-216.
- Schulz M, Kasprzak P, Anwand K, Mehner T. 2003. Diet composition and food preference of vendace (Coregonus albula (L.)) in response to seasonal zooplankton succession in Lake Stechlin. Archiv für Hydrobiologie, Special Issues Advances in Limnology. 58:215-226.
- Schulz M, Koschel R, Reese C, Mehner T. 2004. Pelagic trophic transfer efficiency in an oligotrophic, dimictic deep lake (Lake Stechlin, Germany) and its relation to fisheries yield. Limnologica. 34 264-273.
- Selmeczy GB, Abonyi A, Krienitz L, Kasprzak P, Casper P, Telcs A, Somogyvári Z, Padisák J. 2019. Old sins have long shadows: climate change weakens efficiency of trophic coupling of phyto- and zooplankton in a deep oligo-mesotrophic lowland lake (Stechlin, Germany)—a causality analysis. Hydrobiologia. 831:101-117.
- Stone J, Pangle KL, Pothoven SA, Vanderploeg H, Brandt SB, Hook TO, Johengen TH, Ludsin SA. 2020. Hypoxia's impact on pelagic fish populations in Lake Erie: a tale of two planktivores. Can J Fish Aquat Sci. 77(7):1131-1148. doi: 10.1139/cjfas-2019-0265.
- Tyler AN, Hunter PD, Spyrakos E, Groom S, Constantinescu AM, Kitchen J. 2016. Developments in Earth observation for the assessment and monitoring of inland, transitional, coastal and shelf-sea waters. Sci Total Environ. 572:1307-1321. doi: 10.1016/j.scitotenv.2016.01.020.
- Wanke T, Brämick U, Mehner T. 2017. High stock density impairs growth, female condition and fecundity, but not quality of early reproductive stages in vendace (Coregonus albula). Fish Res. 186:159-167. doi: 10.1016/j.fishres.2016.08.028.
- Wanke T, Brämick U, Mehner T. 2021. Fast somatic growth may cause recruitment overfishing in vendace (Coregonus albula) gillnet fisheries. Ann Zool Fenn. 58(4-6):271-287. doi: 10.5735/086.058.0412.
- Wei T, Simko V. 2021. R package 'corrplot': Visualization of a Correlation Matrix.
- Wickham H. 2016. ggplot2: Elegant graphics for data analysis. New York: Springer.
- Winfield IJ, Fletcher JM, James JB. 2008. The Arctic charr (Salvelinus alpinus) populations of Windermere, UK: population trends associated with eutrophication, climate change and increased abundance of roach (Rutilus rutilus). Environ Biol Fishes. 83(1):25-35.
- Wollrab S, Izmest'yeva L, Hampton SE, Silow EA, Litchman E, Klausmeier CA. 2021. Climate change-driven regime shifts in a planktonic food web. Am Nat. 197(3):281-295. doi: 10.1086/712813.
- Woolway RI. 2023. The pace of shifting seasons in lakes. Nature Communications. 14(1):ARTN 2101. doi: 10.1038/s41467-023-37810-4.
- Woolway RI, Jennings E, Shatwell T, Golub M, Pierson DC, Maberly SC. 2021. Lake heatwaves under climate change. Nature. 589(7842):402-407. doi: 10.1038/s41586-020-03119-1.
- Woolway RI, Sharma S, Smol JP. 2022. Lakes in hot water: The impacts of a changing climate on aquatic ecosystems. Bioscience. 72(11):1050-1061. doi: 10.1093/biosci/biac052.