
 ?Mathematical formulae have been encoded as MathML and are displayed in this HTML version using MathJax in order to improve their display. Uncheck the box to turn MathJax off. This feature requires Javascript. Click on a formula to zoom.
ABSTRACT
Conducting long measurements of infrastructure deformation is a critical engineering task. Conventional methods are both time-consuming and expensive, limiting their use for large-scale applications. The synergy of synthetic aperture radar (SAR) and geographic information systems (GIS) offers a complementary approach. This study focuses on the feasibility of using time series analysis of L-band PALSAR-2 images to discover land displacements in Istanbul and Kocaeli, significant industrial and residential areas in Turkey. PALSAR-2 phase and intensity information were analyzed. For phase analysis, 14 L-band images from 2014 to 2021 were taken into account. Small baseline subset (SBAS) analysis was performed using 44 pairs, and results of the velocity, coherence and backscattering values are presented. Coherence of all pairs and their correlations were calculated. Principal Component Analysis (PCA) reduced the dimension of coherence pairs, enhancing feature extraction and the final geocoded velocity map revealed a fastest subsidence rate of −58 mm/yr and a mean subsidence of −20 mm/yr. These findings were confirmed through mean vertical velocity from Sentinel-1 datasets and field observations. The results showed that immature land subsidence in the mentioned areas are growing slowly, which can be taken as a serious risk in future.
1. Introduction
Conducting long and effective measurements of the displacement of infrastructures are among required critical engineering tasks. The expansion of industrial and tourist activities has resulted in higher numbers of factories, roads and railway networks (Chang et al., Citation2017; Hu et al., Citation2019; Karimzadeh & Matsuoka, Citation2021; Qin et al., Citation2017; Wang et al., Citation2021). The conventional methods for discovering and monitoring structural health basically use in situ measurements by experts. Conventional methods, such as GPS (Lovse et al., Citation1994; Lepadatu & Tiberius, Citation2014) and precise leveling (Chen et al., Citation2012), are also time-consuming, and costly for the employers who cannot apply them at any scale. These limitations make the conventional methods difficult to utilize for real applications in a rather large scale. The synergy of synthetic aperture radar (SAR) remote sensing and geographic information systems (GIS) is not only a complementary method for conventional techniques, but it also can be used as a useful technique for discovering hidden crises in earlier stages, so that the necessary steps can be taken to control or manage such crises (Garg et al., Citation2021; Karimzadeh & Matsuoka, Citation2018).
Land subsidence is a gentle downward movement of the Earth’s surface, which is identified as one of the problematic environmental issues in recent decades (Bull & Polland, Citation1975). This is not only causing serious damage to agricultural lands, but it can also lead to irreparable results in settlement and industrial areas. Typically, the early stages of land subsidence cannot be scaled by the human eyes. Thus, special attention to such long-term phenomena requires special tools other than normal human visual capabilities. PALSAR-2 SAR images have a potential to penetrate tall vegetation and collect dataset from the bare land. Along with high penetration capability of the L-band sensors, high-resolution imagery mode of ALOS-2 satellite allows us to study urban areas together with other C-band and X-band sensors. PALSAR-2 SAR remote-sensing datasets also have shown an acceptable ground coverage (swath) in the recent years, ranging from between 15 km × 15 km (range × azimuth) to 490 km × 490 km (range × azimuth). However, the revisit interval of L-band satellites such as ALOS-2 is higher than the recent C-band and X-band missions such as Sentinel-1 and TerraSAR-X. The main question here is whether we can develop a semi-automated approach to detect land subsidence or changes in urban areas at early stages to mitigate their consequences. As the revisit period of the SAR satellite has been decreasing in recent years (Cigna et al., Citation2021; Karimzadeh & Matsuoka, Citation2018, Citation2020b), the expectation for more effective, semi-kinematic displacement analysis on a centimeter or millimeter scale has increased (Ezquerro, Del Soldato, et al., Citation2020; Ezquerro, Tomás, et al., Citation2020), not only in regional scales but also in nationwide scales (Lazecký et al., Citation2020; Morishita et al., Citation2020). For example, LiCSAR (Looking Into Continents from Space with Synthetic Aperture Radar) is an operational system which is designed for SAR interferometric (InSAR) analysis of Sentinel-1 data in a large scale (Morishita et al., Citation2020). Such continuous spatial and temporal coverage of displacement analysis is an invaluable source of information for monitoring of various short-term (e.g. earthquake) and long-term (e.g. land subsidence) phenomena on the Earth. Aiming for effective infrastructure health monitoring systems, automated and semi-automated data analysis techniques have also been presented recently with very-high-resolution images such as WorldView-2 and object-based image analysis (OBIA) (Miura et al., Citation2020; Omarzadeh et al., Citation2021; Xiu et al., Citation2022). Chen et al. (Citation2019) employed a combination of Persistent Scatterer Interferometric Synthetic Aperture Radar (PS-InSAR) and tomographic SAR techniques. Their research utilized TerraSAR-X and CosmoSkyMed imagery to delve into the displacement analysis of structures including skyscrapers, bridges, and historical landmarks situated in Nanjing City, China. Mele et al. (Citation2022) introduced a novel approach involving joint Differential Interferometric Synthetic Aperture Radar (DInSAR) and Density-Based Spatial Clustering of Applications with Noise (DBSCAN) techniques. This innovative methodology was designed to identify clusters of pixel values associated with buildings. In a subsequent study, Mele et al. (Citation2023) studied health of structures in Barcelona, Spain, using a basic concept for active displacement areas (ADA) using a semi-automated ADAfinder tool for the identified PSs in the study area.
The necessity of this study is to establish a new geodatabase incorporating diverse spatial layers, consolidating them to provide comprehensive insights into infrastructure changes. Here, we introduce a semi-automated GIS-based analysis of spatiotemporal ground characteristics using InSAR time series analysis, focusing on areas within Istanbul and Kocaeli Provinces. The method utilizes coherence and intensity information from PALSAR-2 (StripMap 3) images (with a wavelength of approximately 24 cm) from JAXA (the Japan Aerospace Exploration Agency). This approach is suitable for establishing temporal or spatial relationships among processed intensity, principal components of coherence values, and InSAR displacement maps, providing valuable insights into changes in the Earth’s surface.
2. Study area and datasets
2.1. Study area description
The present study mainly focused in one frame of the ALOS-2 PALSAR-2 images, which cover major parts of Istanbul and Kocaeli Provinces. Both provinces have experienced rapid development in terms of urbanization and industrial activities. About 16 million people are settled in Istanbul, and this number is expected to increase in the coming years. Furthermore, about 2 million people inhabit Kocaeli (Güven, Citation2022; Halicioglu et al., Citation2021). The heavy industrial projects west of Kocaeli and all over Istanbul meet the demands of not only domestic people, but also of international markets. According to Halicioglu et al. (Citation2021), such parallel growth of population and industrial projects manifests itself in the future with serious difficulties and consequences, as both provinces are located in an earthquake-prone area (Aslan et al., Citation2018; Güven, Citation2022; Özarpacı et al., Citation2022). Thus, intensive monitoring of the infrastructures for tectonic and non-tectonic hazards must gain more value for sustainable urban developments in the future. According to Akarvardar et al. (Citation2009), Avcilar district in Istanbul experienced ground subsidence and the same area damaged by the M 7.4 Izmit (Kocaeli) earthquake of 1999 which was mainly associated with compressible material in shallow subsurface layers. Here, we only selected two candidate areas in Istanbul and Kocaeli Provinces, which shows land subsidence displacement as follows: 1—Kadikoy, which is a filled land near a water canal in Istanbul; and 2—Balcik, or Balçık in Kocaeli. Moreover, spatiotemporal changes in the newly inaugurated third bridge of Istanbul (i.e. Yavuz Sultan Selim Bridge), together with the connection roads in the Asian and European sides, are taken into account to investigate the length of the roads constructed within the period of about 7 years, from November 2014 to March 2021.
2.2. Datasets description
Using ERS-1/2, Envisat and Sentinel-1, all in C-band domain (λ ~ 6 cm), and a persistent scatterer interferometric (PS-InSAR) analysis, the ground displacement rate in Istanbul is well studied, especially from the point of view of geological descriptions in previous studies from 1992 to 2017 (Aslan et al., Citation2018; Stramondo et al., Citation2010, Citation2011). From 2015 to 2018, using the same method and Sentinel-1 images, other research was carried out for Istanbul. Alternatively, we used PALSAR-2 images of the ALOS-2 satellite with its better spatial accuracy (~10 m) to provide more information about the (in)stability of the study area. Since X-band SAR datasets are not available for the study area, the finer spatial resolution of the L-band images gain importance for monitoring of urban areas. The PALSAR-2 aboard the ALOS-2 satellite is a SAR sensor, which transmits and receives the backscattered microwave energy from the ground features to provide information about the stability, soil moisture, surface roughness, surface changes including structural damage and fire. This sensor is independent of the source of light such as the sun, and accordingly, PALSAR-2 benefits from the advantage of providing satellite images, both day and night. The wavelength of L-band (~24 cm) used in this sensor is less affected by cloudy, rainy or snowy weather, which provides a suitable capability for rapidly monitoring various objects, structures and phenomena (Aimaiti et al., Citation2018; Natsuaki, Citation2012; Watanabe et al., Citation2016; ALOS-2 Product FormatDescription, Citation2014). Additionally, L-band wavelength penetration is fair enough to reach the ground surface through vegetation, in order to obtain information about the ground surface. PALSAR-2 has SpotLight imagery mode, with a resolution of 1 m × 3 m in the azimuth and range directions, respectively. It allows for the collection of detailed information for small-scale analysis, such as urban analysis. Additionally, StripMap and ScanSAR modes are available for large-scale projects. The spatial resolution for StripMap1 is 3 m (Ultrafine); for StripMap 2, it is 6 m (High sensitive); for StripMap 3, it is 10 m (Fine) (Karimzadeh & Matsuoka, Citation2020a; Natsuaki, Citation2012; ALOS-2 Product Format Description, Citation2014). In this study, only StripMap 3 was available, and accordingly, for Istanbul and Kocaeli, 14 L-band PALSAR-2 images from ascending orbits between 2014 and 2021 were gathered. shows the detailed information of the used images, and also shows the location of the study area and the used SAR track. The total area analyzed by this study was roughly 7300 km2. The path and row numbers of the acquired PALSAR-2 scenes were 188 and 810, respectively. The central latitude and longitude of the scenes were 29.382° and 41.083°, respectively.
Figure 1. The study area with the locations of the investigated sites in Istanbul and Kocaeli provinces. The green box shows the track 188 PALSAR-2 (ascending orbit). Red circles show the investigated sites kadikoy and Balcik. The location of the Yavuz Sultan Selim Bridge is also shown by the red line. The inset is the map of Turkey.
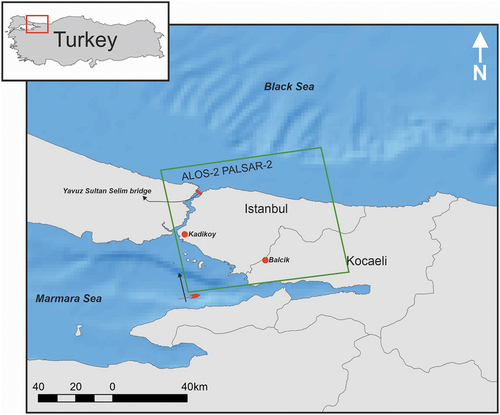
Table 1. SAR images and detailed characteristics of the L-band PALSAR-2 dataset used in this study. “*” indicates super master image, “A” indicates ascending orbit, respectively.
Although the main objective of this study was related with time-series interferometric SBAS analysis, intensity and GIS-based analyses were included as well. Since the main targets in the study area were infrastructures (roads, buildings and railways), only HH polarization of the dual polarized PALSAR-2 data (HH+HV) were used. The choice between HH and HV polarizations in PALSAR-2 data for interferometric analysis depends on the specific objectives of the study. In this study, HH polarization is preferred over HV for interferometric analysis due to higher coherence results (Vaglio Laurin et al., Citation2022). The incidence angle for all images was 40.57 degrees, and the difference of incidence angle during the SBAS analysis (Δθ) was not more than 0.02°, which implied that the acquisition positions or normal baselines were quite acceptable.
3. Methodology
Although image classification techniques for optical images can provide useful information for urban areas (Ghasemi et al., Citation2021), monitoring changes and displacement is more sensitive in SAR images since they deal with phase and intensity information (Karimzadeh & Matsuoka, Citation2020b; Karimzadeh, Ghasemi, et al., Citation2022). However, the interpretation of SAR analysis is sometimes complex and difficult, due to the complex behavior of backscattering coefficients and the unique characteristics of side-looking SAR systems. Thus, this study used both phase and intensity information analyzed by Sarscape 5.5 for all possibilities in a QGIS database, in order to achieve a reliable analysis of urban elements. The methods and techniques used in this study can be divided into three main branches, as follows: 1—intensity analysis; 2—interferometric analysis; and 3—GIS analysis ().
Figure 2. Flowchart of the proposed research.
3.1. Intensity analysis
In this study, the PALSAR-2 images were gathered in SLC (single look complex) format in level 1.1. In order to visualize the high-resolution L1.1 images, a pre-processing step was necessary to bring both phase and intensity information to an actionable manner. The L1.1 is a kind of raw data, right after the imagery, and it is the fundamental product for the main processes (ALOS-2 Product Format Description, Citation2014). The geometry of SAR imaging, rather than a geographic concept, is based on slant range and azimuth coordinates. Thus, in a side-looking SAR sensor, the distortions mainly based on topographic changes are considerable, and an image calibration process and coordinate conversion (from SAR coordinate to geographic coordinate) should be conducted. This conversion is possible using an inverse technique and a digital elevation model (DEM). The Doppler frequencies, the time for pulse transmission time of the SAR image, and the position and velocity vectors of both the sensor and the backscatter feature are used for calibration, as follows (Meier et al., Citation1993):
where is the slant range,
is the satellite position,
is the backscatterer position,
is the velocity of the satellite,
is the velocity of the backscatterer feature, c is the speed of light,
is the frequency of the carrier, and
is the Doppler frequency. During geocoding processing and after processing the Doppler frequencies, the output can be transformed to any reference system. To convert digital numbers (e.g. imaginary and real values) to sigma naught (
) or backscattering coefficients, JAXA provides the following equation for PALSAR-2 ALOS-2 products (ALOS-2 Product Format Description, Citation2014; Karimzadeh et al., Citation2022):
where is the backscattering coefficient in the dB unit,
is a digital number (or raw pixel value), and
is the calibration constant adjusted for the PALSAR-2 ALOS-2 (−83 dB).
To suppress speckle noise on the geocoded intensity images, we used the Lee filter with a window size of 3 × 3 to the geocoded image, in order to reduce the level of noise, especially in the urban areas (Lee, Citation1980; Miura et al., Citation2016). We also applied a multilooking operation to reduce the speckle noise as much as possible by setting a 1 × 3 look size in the range and azimuth directions, respectively. It must be noted that applying large look sizes may reduce the spatial resolution dramatically, which is not ideal for the purpose of this study. Different look sizes can also change the dimensions of the pixels negatively if the pixels are “rectangle” instead of “square”. Scatter plots of the intensity pixel values, with respect to the super master image (2016.06.26) for Kadikoy and Balcik regions, are shown in and , respectively. A comparison of the intensity values shows that the correlation coefficient (CC) is high when the time interval of each image with the super master image is short for both Kadikoy and Balcik.
Figure 3. Scatter plots and correlation coefficients (CCs) of the intensity pixel values of the PALSAR-2 images with respect to the super master image (2016.06.26) in Kadikoy.
Figure 4. Scatter plots and correlation coefficients (CCs) of the intensity pixel values of the PALSAR-2 images with respect to the super master image (2016.06.26) in Balcik.
3.2. SBAS interferometric analysis
Several InSAR studies using ERS-1/2, Envisat, Sentinel-1 datasets and persistent scatterer interferometry (PS-InSAR) were carried out in the study area (Aslan et al., Citation2018; Halicioglu et al., Citation2021; Stramondo et al., Citation2010, Citation2011). The performance of permanent scatterers (PS) interferometry technique is superior to SBAS-InSAR when the number of SAR images is relatively high, but the SBAS-InSAR is less sensitive to temporal decorrelations compared to PS-InSAR (Aimaiti et al., Citation2018; Karimzadeh, Matsuoka, & Ogushi, Citation2018).
Range and azimuth looks are considered as the same of the intensity analysis (i.e. 1 range look and 3 azimuth look). The selection of candidate interferometric pairs was based on their short temporal and spatial baselines. In order to form an SBAS network, we assumed the PALSAR-2 images to be an array of SLC images () for the same area, in which all of the images were taken by the same geometry, orbit and path at the ordered acquisition dates (t1, t2, t3, … , tn). The outcome of the interferometric correlation analysis between the candidate SBAS pairs was directly related with the spatial (normal) baseline of the two images (
), Doppler centroid of the two images (
), temporal gap of the two images (
), and miscellaneous sources of the noise generated by the sensor. Assuming the noise is negligible, the general SAR interferometic correlation is as follows (Berardino et al., Citation2002; Karimzadeh & Matsuoka, Citation2020a):
where is the interferometric joint correlation;
,
and
are time interval, spatial interferometric baseline and Doppler difference, respectively; and
,
and
are critical time interval, critical normal baseline and Doppler centroid difference, respectively. The interferometric correlation (
) is approximated by considering the product of individual correlations, where each component is influenced by differences from reference values through the function (
). The criteria defined by expert or user were taken into account, based on the EquationEquation (4)
(4)
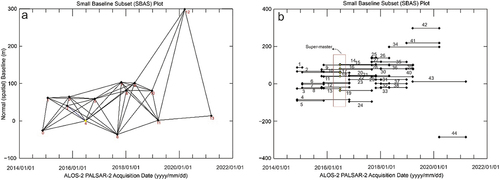
(4) . If the criteria matched with the SBAS requirements, the candidate SAR pair could be included into the SBAS analysis. Here, the maximum time interval was 730 days, and the maximum spatial baseline was 45% of the critical baseline. One image was selected as a “super master” image. The selection of the super master image was based on its fair spatial and temporal baselines with all the other images. The image with label 4 (2016.06.26) in was ideal to be a super master image. L-band PALSAR-2 images are in the long wavelength range of images that pose a higher phase correlation compared to C-band and X-band products. In this study, in spite of large temporal gaps between the images in the L-band PALSAR-2 images, the phase correlation was still in good condition, and we assumed that the acquired images could be contributed into the SBAS analysis. As shown in ), forty-four pairs formed a solid SBAS network to reduce the possible errors. The number of PALSAR-2 images was not too high in this study, but was still enough to form the SBAS analysis, as discussed in previous studies (Karimzadeh & Matsuoka, Citation2020a, Citation2020b). Due to the relatively long time interval of the interferometric pairs, finding the optimal coherence threshold required multiple attempts. After careful consideration, we selected the value 0.7 as the optimal threshold to achieve the desired balance and consequently all the low values were removed from the analysis. The minimum and maximum normal baselines were 25 m and 720 m, respectively.
Figure 5. (a) SBAS SAR network of the analysis for the PALSAR-2 images (black dots). The super master image is highlighted by a yellow dot; (b) arrangement of InSAR pairs and the corresponding pair number over each link.
In this study, SBAS analysis proposed by Berardino et al. (Citation2002) was carried out for entire processes. The minimum number of pairs was one pair with two images, and the phase correlation for N as the odd number of images and M as the number of interferograms could be calculated with EquationEquation (5)(5)
(5) :
Pixel values for the unwrapped interferograms’ () radar coordinate system (in azimuth and range), between the two acquisitions (
and
), could be determined as follows (Karimzadeh & Matsuoka, Citation2020a):
EquationEquation (6)(6)
(6) can be rewritten as follows:
where is an integer from 1 to
;
and
are phase values for the multilooked SAR images in two acquisitions (
and
);
and
are displacement values of low-pass components between
to
in the line-of-sight (LOS) of the satellite;
is the related atmospheric between
and
;
is the used wavelength associated with satellites (e.g. for ALOS-2, the wavelength was 23.6 cm);
is the phase of topography for the Earth, which is not flat in reality. The phase of topography was defined as follows:
Here, is the normal baseline of the two SAR acquisitions, as shown in , and
is the incidence angle of the SAR images. As mentioned in , the incidence angle for the used images was 40.57°, and
was the exposed topographic effect.
In EquationEquation (7)(7)
(7) , the noise effects (which are primarily associated with instrumental performance) are assumed to be negligible. Refinement and re-flattening of the interferograms to remove the turbulent phases were performed by selecting approximately 100 ground control points in motionless and highly coherent areas and using a 3 arc-second Shuttle Radar Topography Mission (SRTM) DEM and a third-order polynomial refinement equation. EquationEquations (7)
(7)
(7) and (Equation8
(8)
(8) ) describe a system with infinite solutions because of the N + 1 unknowns. The singular value decomposition (SVD) method, which does not require prior information about the temporal behaviour of the deformed area, provides a simple solution to invert the system. In the final step of refining the surface displacement data (
, i = 0, … , N), the phase related to the atmospheric effects (
) must be detected and mitigated by considering that the possible atmospheric phase components are clustered primarily in space and time (Berardino et al., Citation2002). Pixels with coherence values smaller than our defined threshold (0.7) were set to dummy variables (NaN).
Once the displacement map in the LOS was estimated with EquationEquation (7)(7)
(7) , the LOS displacement could be converted to vertical displacement. If the descending and ascending datasets were available simultaneously, 3 displacement components could be retrieved (E – W, N – S, and Vertical). Due to a lack of the descending datasets, only vertical values could be estimated by considering some assumptions: 1—the LOS results contained a few N – S movements, since the SAR system was not sensitive for the N – S direction; thus, we assumed N – S movement did not exist; and 2—the E – W movement was trivial, since field observation proved vertical displacement displacement due to long subsidence; thus, only the vertical displacement could be inferred as follows (Karimzadeh & Matsuoka, Citation2018; Su et al., Citation2017):
Here, is the vertical velocity,
is the LOS velocity,
is the east‒west velocity,
is the azimuth angle, and
is the incidence angle of the satellite.
Coherence of all pairs, their correlation and principal component analysis (PCA) were calculated after the velocity conversion. Coherence, as an index for the quality of interferometric pairs and a measure for explaining the Earth’s changes, is defined as follows (Karimzadeh & Matsuoka, Citation2018):
where is the expected value,
and
are master and slave images,
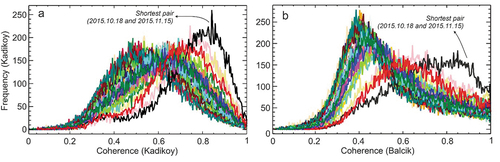
is the complex conjugate of the used images. As shown in , the histogram of coherence values in different epochs shows different peaks for Kadikoy and Balcik, ranging between 0 and 1. In both regions, a large temporal gap manifested itself in a normal distribution histogram, in which the peak formed in lower coherence values. In contrast, the short temporal gap manifested itself in a normal distribution histogram, in which the peak formed in higher coherence values. In , the highest peak belonged to the SAR pair with 2015.10.18 and 2015.11.15, for both the Kadikoy and Balcik regions. The peak coherences for Kadikoy and Balcik were 0.83 and 0.82, respectively. Furthermore, the average coherence values in the shortest pairs for Kadikoy and Balcik were 0.74 and 0.70, respectively.
Figure 6. (a) Histogram of coherence values for different pairs in Kadikoy; (b) histogram of coherence values for different pairs in Balcik.
3.3. GIS and PCA analyses
In order to turn the results of the SAR analysis into an actionable status, geodatabase creation and GIS analysis were necessary. Geodatabase is a collection of layers with a geographical concept in a common management system such as Microsoft SQL (Mohamadzadeh et al., Citation2020). Geodatabase contains not only the results of intensity and interferometric analyses, but also geospatial layers and information, including building inventories, roads and railways. Geodatabase is a comprehensive information model that keeps the attribute tables, and a series of raster values (e.g. velocity values) in the integrated folder accessible for eligible users. Thus, generation of such a database increases the value of the remote-sensing data by providing easy access for the required information and statistics of GIS analyses. We used the road, railway and building information of the OpenStreetMap (OSM) in the GIS Geodatabase. Since the OSM layers sometimes have geometric inconsistencies, the calculation of area (for parcels or buildings) and length (for railways and lines) may produce negative values (Haklay & Weber, Citation2008; Ram, Citation2022; Sehra et al., Citation2016) because outer lines in OSM shapefile (*.shp) that are snapped in a clockwise direction and inner rings that are snapped in a counter-clockwise direction generate a polygon with some errors. This is also called “incorrect ring order”, which creates negative values in the shapefile. In order to fix the errors, the geometric correction was carried out in the GIS environment. Once the area and length for the corresponding layers were calculated, the displacement thresholding for Kadikoy and Balcik was applied in a 5 km × 5 km area. The error sources in OSMs can also be reduced if a unique georeferenced system such as WGS-84 (World Geodetic System) is exploited together with the positioning of the candidate SBAS pixels (Miano et al., Citation2022). Using the spatial queries, the mean velocity values of the SBAS analysis were extracted to the centroid of the buildings, while for roads and railways, the 100 m buffer was used to extract the displacement values.
To further investigate, we applied PCA for the generated coherence pairs. PCA is a quick and a reliable visualization technique for image interpretation, especially when the dimensions of the dataset are rather high (Karimzadeh & Matsuoka, Citation2018; Kim et al., Citation2021). It offers several contributions for:
Dimensionality reduction: coherence pairs involve multi-temporal pixel values, leading to high-dimensional datasets. PCA helps in reducing the dimensionality by transforming the original data into a new set of uncorrelated variables called principal components. This simplifies the dataset while retaining the most critical information, making it easier to visualize and analyze. Here, the forty-four coherence maps are a large source of information, and sometimes redundant information makes interpretation difficult. The coherence maps (from SBAS analysis) were assumed into a matrix of scores of different locations, and the variables were different time spans.
Visualization: PCA facilitates the visualization of SAR datasets. The reduced-dimensional principal components can be plotted, providing a visual representation of the primary variation in the data. This visualization aids in better understanding the relationships and structures within the dataset.
Feature Extraction: coherence results might contain subtle variations (e.g. non-urban changes) that are challenging to detect directly. PCA can uncover hidden features by highlighting variations that might otherwise go unnoticed. This can be particularly useful for uncovering localized displacements or changes in different parts of the dataset.
The PCA calculation was defined as follows (Karimzadeh & Matsuoka, Citation2018):
where is the PCA matrix of different time spans;
is a matrix of the scores;
is a matrix containing the loading factors (transposed matrix); and
is the residuals of the results. The matrix of principal component scores (
) represents the transformed data in the new coordinate system defined by the principal components. Each row in
corresponds to an observation (i.e. coherence map), and each column corresponds to a principal component. It must be noted that PCA originates from a projection method. The size of the dataset was ideal for PCA analysis, and we only created six principal components (PCs), since the first six components can generally explain the whole dataset.
4. Results
Using PALSAR-2 SAR images and the 30 m SRTM (shuttle radar topography mission) DEM of the study area, we performed SAR interferometry and PCA analyses.
4.1. SBAS displacement and field observations
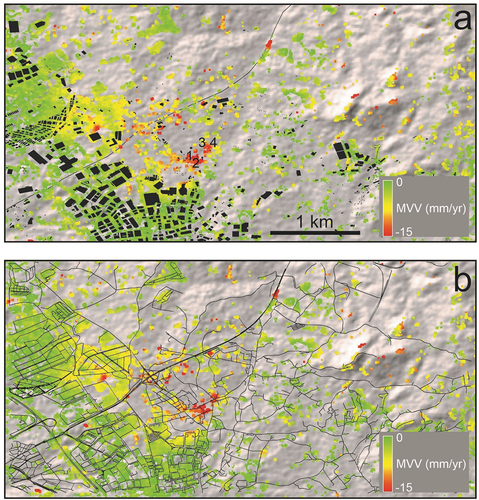
shows the results of the SBAS InSAR for Istanbul and Kocaeli, from November 2014 to March 2021, using HH PALSAR-2 data. Although positive values may be indicative of natural processes such as tectonic uplifts, the predominant cause of positive values in this study is related with tall vegetation and different noises. Thus, the noisy and positive values were removed from the final velocity map. Warm colors are negative values, which indicate downward displacement (mostly land subsidence or landslide movement), while the green color represents motionless regions. The fastest subsidence rate reached −58 mm/yr in landslide and hill slope areas (dashed polygons in ). These areas are located in a military training area and forests. However, gentle subsidence in Kadikoy and Balcik was confirmed by a field visit in November 2022. shows buildings, roads and railways in Kadikoy overlaid on the InSAR vertical velocity map. The maximum vertical velocity rate in Kadikoy was −30 mm/yr in the central parts of the oval-shaped region, while the rates of subsidence in the marginal parts were less than −30 mm/yr. The number of buildings in the Kadikoy (5 km × 5 km) region was 9691 buildings, in which 1754 buildings (parcel) were located in a gap area without InSAR displacement values. The threshold for the critical subsidence rate was calculated from the sample displacement data of the geodatabase, the number of whole buildings and GIS query analysis. The number of buildings in the critical area (red area in with a subsidence rate more than −5 mm/yr was found to be 594. The total area of the critical buildings was 121,875 m2 in Kadikoy. More details about the length of the exposed roads and railways in both Kadikoy and Balcik are given in .
Figure 7. Mean vertical velocity map of Istanbul and Kocaeli. Black dashed polygons are mainly landslide areas or forest. The black rectangles are Kadikoy and Balcik.
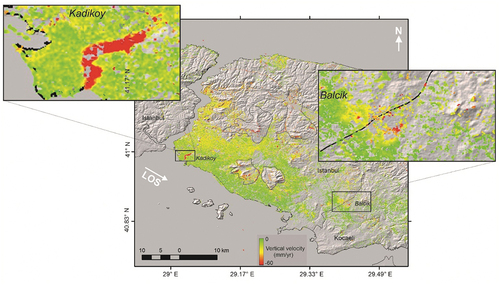
Figure 8. (a) Kadikoy buildings overlaid on the mean vertical velocity (MVV) map; (b) roads overlaid on the MVV map; (c) railways overlaid on the MVV map. The locations of field observations and the water canal (blue polygon) are shown by the numbers in (c).
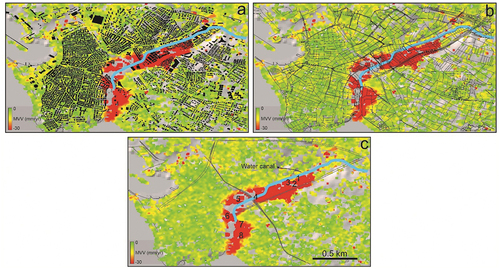
Table 2. Detailed information of affected length of railways and roads in PALSAR-2 and Sentinel-1 displacement maps.
shows buildings and roads in Balcik overlaid on the InSAR vertical velocity map. The fastest vertical velocity rate in Bacik was found to be −15 mm/yr, while the rates of subsidence in the other areas were trivial. The total number of buildings found in this area (7 km × 7 km rectangle) was 1258, in which 607 buildings were located in a gap area without InSAR velocity values. The 651 remaining buildings were mainly located in stable areas. Only 47 buildings were located in the critical red zone and the total area of these buildings was 12,000 m2. If progressive land subsidence in the Balcik continues in the future, towards the industrial areas (south and west of the core of the subsidence), the risk of damage to these buildings may increase. Although the number of deep and semi-deep water wells illegally excavated in Balcik is unknown, the presence of illegal wells in the industrial and agricultural area was confirmed by regional administration. also presents the total road length and the maximum and mean subsidence rates for Balcik.
Figure 9. (a) Balcik buildings overlaid on the mean vertical velocity (MVV) map; (b) roads overlaid on the MVV map. The locations of field observations are shown by the numbers in (b).
The field observations of Kadikoy and Balcik were carried out in November 2022, and signs of progressive land subsidence were confirmed in the visited areas. shows the locations of subsiding areas in the Kadikoy region. The majority of buildings had serious cracks in outside and inside walls. However, most of these cracks were repaired before our field visit ((1, 5)). As a result of progressive land subsidence, most outer doors cannot be locked ((3)). Short interviews with local people and the administrative office in Kadikoy revealed that the oval-shaped area near the water canal is filled land. Thus, the land subsidence due to soil consolidation and traffic effects near the football stadium (Kadikoy stadium) could be the main reasons for subsidence in the urban area. However, the subsidence in Balcik region could be different. shows the locations of subsiding areas in Balcik. Most of the affected buildings are in rural areas (Balcik village). This could be partially because of illegal water extraction in this area, since most of the lands in this area are muddy, and their fertility is good enough for agricultural activities. Our field observations showed that because of local subsidence, cracks are continuously appearing on the inner and outer walls of buildings in this area, despite the local people fixing these cracks from time to time. This subsidence area is also located near an industrial area. Thus, this is a call for action to make necessary decisions, in order to avoid possible damage to large infrastructures west and south of the subsidence zone. shows the geographic location of observed points in the Kadikoy and Balcik regions. Additionally, we also analyzed 7 co-polarized (VV) ascending (orbit 58) images of Sentinel-1 from 1 May 2015 to 18 March 2021 using stacked InSAR technique for the study area. Detailed information of the Sentinel-1 images are presented in Table A1. The mean vertical velocity maps deduced from the ALOS-2 and Sentinel-1 datasets present similar patterns for Kadikoy region (). The correlation between vertical velocities of the two maps for the location of 595 buildings is 0.84 ().
Figure 10. Subsidence evidence in different locations in the Kadikoy region. The locations of the images are shown in figure 8(c).
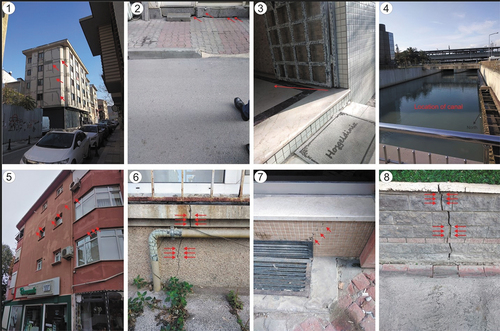
Figure 11. Subsidence evidence in different locations in the Balcik region. The locations of the images are shown in figure 9(a).
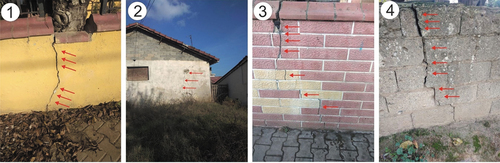
Figure 12. (a) Sentinel-1 mean vertical velocity in the Kadikoy region; (b) scatter plot of mean vertical velocities.
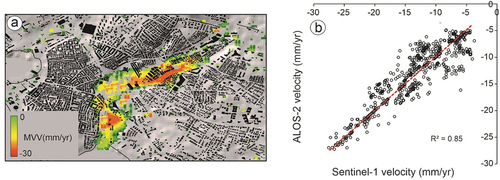
Table 3. Geographic coordinates of the observed areas in Kadikoy and Balbik (see locations in and ).
4.2. Coherence changes
shows the coherence histograms over Kadikoy and Balcik for the near-to-one-year temporal pairs: time span one from 16 November 2014 to 15 November 2015 (364 days); time span two from 15 November 2015 to 30 October 2016 (350 days); time span three from 30 October 2016 to 29 October 2017 (364 days); time span four from 20 October 2017 to 23 December 2018 (420 days); time span five from 17 March 2019 to 15 March 2020 (364 days); and time span six from 15 March 2020 to 14 March 2021. The mean coherence values in Kadikoy for time spans one, two, three, four, five and six are 0.605, 0.610, 0.620, 0.580, 0.620 and 0.631, respectively. For Balcik, the mean coherence values for time spans one, two, three, four, five and six are 0.547, 0.558, 0.555, 0.543, 0.545 and 0.549, respectively. Although the general behavior of the histograms is similar, the peak position of time span four (black curve in ) is shorter than the other time spans. This shows that time span four in both regions has a lower value, due to its longer time interval.
Figure 13. (a) Statistical results of coherence changes for the SAR pairs with a time interval near to one year for Kadikoy and (b) for Balcik.
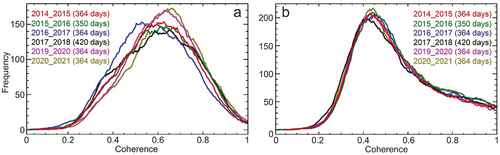
In Kadikoy, for time spans one and two, the correlation coefficient is 0.738; for time spans two and three, the correlation coefficient is 0.739; for time spans three and four, the correlation coefficient is 0.706; for time spans four and five, the correlation coefficient is 0.629; and for time spans five and six, the correlation coefficient is 0.726. For the Balcik area, for the same time spans, the correlation coefficients are 0.734, 0.770, 0.765, 0.697 and 0.715, respectively. Low correlation coefficients between time span three with time span four, and also time span four with time span five, are not surprising; since the temporal gap increases, the correlation decreases because of the urban/land use changes and vegetation growth.
4.3. RGB and PCA visualization
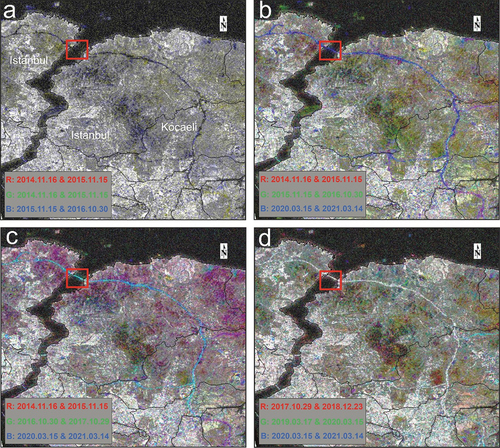
Using RGB coherence combination (Karimzadeh & Matsuoka, Citation2018), we tracked surficial changes in Istanbul. As shown in , RGB combinations in different time spans were applied. shows the changes between 2014.11.16 and 2016.10.30 for almost two years, when the Yazuz Sultan Selim Bridge and the North Marmaray highway (Otoyol 7) were under construction. As a result of this, the bridge and highway are shown in black color, which means that all the channels were at the minimum values, or the values continuously were changing in the corresponding time span. In , the RGB color composite covers between 2014.11.16 and 2021.03.14. The highway (except the southeast segment) is bluish, which means that the blue channel (coherence values from 2020.03.15 to 2021.03.14) had a large contribution, or the major parts of the bridge and the highway were made in this period, with a minimum contribution from the green and red channels. However, in , the contribution of the green channel (coherence values from 2016.10.30 to 2017.10.29) manifested itself by changing the color of the bridge and highway from blue to cyan. In , the color of the bridge and highway are “as white as” the built-up areas, because all of the channels cover from 2017.10.29 to 2021.03.14. This means that construction of the bridge and the highway was almost completed in this period, and the area was not changing anymore.
Figure 14. (a-d) RGB color composite for SBAS coherence pairs with one-year time spans.
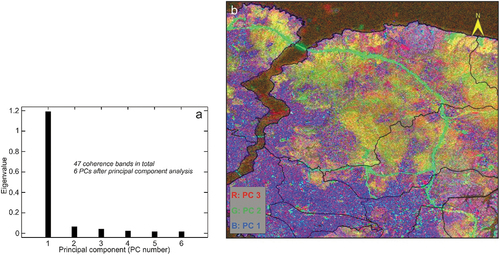
As shown in , PC1 (mainly urban regions) almost explains 92% of the data. PC2, PC3, PC4, PC5 and PC6 explain 5%, 2%, 0.5%, 0.5% and 0.0% of the data, respectively. , shows that PC2 belongs mainly to the bridge and highway. The object-based image analysis shows that in the covered footprint, the total length of the constructed road and the bridge together is 55 km.
Figure 15. (a) Principal components (PCs) for the coherence pairs. Red box shows the location of Yavuz Sultan Selim Bridge; (b) RGB color composite of the first three PCs.
5. Discussion
The SBAS PALASR-2 analysis over the study area revealed new displacement areas. The reliability of the subsidence areas was confirmed by field investigations, and a comparative analysis using Sentinel-1 C-band images was carried out. In this study, the changes such as cracks in the walls are different from the earthquake damage. For example, in EMS-98 (European Macroseismic Scale) the damaged buildings with cracks on the walls are mainly categorized in Grade1. This means that all the damaged buildings due to the ground subsidence fall at the same grade of damage. In addition, the damaged buildings (i.e. buildings with cracks on the wall) are quickly repaired by the owners and the large temporal gap of the SAR images makes the establishment of an empirical relationship difficult. ALOS-2 satellite has a limited revisit frequency, meaning that it does not acquire data for a specific location as frequently as other active SAR satellites such as Sentinel-1. This limitation can affect our ability to monitor dynamic processes over short acquisition dates and further analysis such as X-band InSAR analysis may reveal other aspects of land subsidence in the urban areas. Although there are PALSAR-2 datasets available for Istanbul and Kocaeli, the accessibility of PALSAR-2 data for different regions or time periods may be limited due to factors like satellite orbit, acquisition scheduling, or operational considerations.
The PALSAR-2 images provided higher spatial resolution compared to the others, which was helpful to create a database for Istanbul and Kocaeli, in terms of the past, current and ongoing changes in the earth, especially in the urban-scale projects. For example, its efficiency for monitoring of Yavuz Sultan Selim Bridge before, during and after construction were evaluated with high-resolution coherence images. Coherence PCA provided invaluable information of L-bands regarding the amount of work that had been done by construction companies. Thus, monitoring the performance of different construction companies in terms of volume of work is possible. Dense vegetation around the highway was not problematic for producing high-quality coherence maps, since the penetration of PALSAR-2 images was at an acceptable level. The average coherence values in whole analyzed pairs were more than 0.5, despite the large time intervals. Full coverage of the study area with high spatial resolution remains a question for further investigations. Since there is a trade-off between spatial resolution and spatial coverage, here we used StripMap mode and high resolution, but the ALOS-2 footprint (i.e. track 188) was not able to cover the entire Marmaray highway. On the other hand, the resolution of ALOS-2 ScanSAR mode or Sentinel-1 may be unsatisfactory for calculations of changes over the highway. Further synergetic studies in the future may satisfy the purpose of this research for large areas.
6. Conclusion
In this study, we demonstrated the performance of ALOS-2 PALSAR-2 images for monitoring infrastructures such as roads and railways in Istanbul and Kocaeli. We applied SAR interferometry and SAR intensity analysis for 14 acquisitions that provided surface velocity and change indices for a large area. This approach together with an updated geodatabase allows us to classify the displacement behavior (e.g. mean, maximum and minimum displacements), and total length of displacement for the entire study area. In the central parts of the oval-shaped region in Kadikoy, the maximum vertical velocity rate was −30 mm/yr, whereas the rates of subsidence in the marginal parts were less than −30 mm/yr. The Kadikoy region () comprised a total of 9691 buildings. Among these, 1754 buildings (parcels) were situated in a gap area without InSAR displacement values, and there were 594 buildings located in areas experiencing high subsidence rates, exceeding −5 mm/yr. The total area of the critical buildings was 121,875 m2 in Kadikoy. In Bacik, the maximum vertical velocity rate was −15 mm/yr. The total number of buildings in this area () was 1258, with 607 buildings in a gap area lacking InSAR velocity values. The remaining 651 buildings were mainly situated in stable zones. Only 47 buildings were in the critical red zone. Continued land subsidence towards industrial areas may pose a risk to these structures. Critical construction such as archeological sites and large structures/infrastructures can be selected automatically in the GIS environment based on attributes and descriptions. For example, if the coherence threshold or deformation rate of a certain region is available, the total number of constructions at risk can be initially identified using the floor area, proximity to the possible landslides and multicriteria decision systems.
Thus, the stakeholders in an urban area can derive some benefits from the results of the proposed method. Here are some ways stakeholders can benefit from the results:
Enhanced risk assessement and updates: the results facilitate the definition and creation of the risk maps for the experts who are interested in enriching their damage/risk maps through remote sensing techniques.
Urban planning and infrastructure development: InSAR results identify areas prone to subsidence, landslides, or other ground movements as shown in . Stakeholders, such as local governments and disaster management agencies, can use these insights to plan evacuation routes, and develop strategies to mitigate potential hazards.
Infrastructure maintenance and management: InSAR results highlight infrastructural changes in roads and bridges (as shown in ). Municipalities and transportation authorities can use these insights to prioritize maintenance efforts, identify areas in need of repairs, and ensure the safety of residents and travelers.
Overall, the results offer an enhanced understanding of ground movement and urban changes, enabling stakeholders to make informed decisions and contribute to achieving sustainable development goals.
Supplementary_document_Table_A1.docx
Download MS Word (14.3 KB)Acknowledgements
We thank JAXA for providing the PALSAR-2 images under the agreements via the 3rd Research Announcement on the Earth Observations (EO-RA3) for principal investigator (PI) Sadra Karimzadeh (ER3A2N105).
Disclosure statement
No potential conflict of interest was reported by the author(s).
Data availability statement
The data that support the findings of this study are available on request from the corresponding author.
Supplementary material
Supplemental data for this article can be accessed online at https://doi.org/10.1080/20964471.2024.2320466
Additional information
Funding
Notes on contributors

Sadra Karimzadeh
Sadra Karimzadeh received the Ph.D. degree in engineering with a certificate of commendation from Kanazawa University, Kanazawa, Japan, in 2015. He was a Postdoctoral Researcher with the Department of Geographical Information System (GIS) and Remote Sensing, University of Tabriz, Tabriz, Iran, in 2016. From 2016 to 2018, he was a JSPS Researcher with the Department of Architecture and Building Engineering, Tokyo Institute of Technology, Tokyo, Japan. From January 2019 and July 2019, he was a researcher with Geoinformatics Unit, RIKEN, in Japan. He was also an invited research scientists in Gebze Technical University, Turkey from October 2022 to September 2023. He is currently a research fellow in Tokyo Institute of Technology and an Assistant Professor with the Department of GIS and Remote Sensing, University of Tabriz, Tabriz, Iran. His research interests include SAR interferometry, radar imagery for earthquake damage assessment, infrastructure monitoring using SAR, GIS applications for disaster management, and seismic site characterizations based on GIS and remote sensing technologies. Dr. Karimzadeh is a Reviewer for most of the international journals in remote sensing and earthquake engineering.
Abdullah Can Zulfikar
Abdullah Can Zulfikar received the M.Sc. and Ph.D. degrees in civil or earthquake engineering. He is now with the Disaster Management Institute, Istanbul Technical University, Turkey. His research interests include seismic hazard, risk assessment, earthquake risk reduction technologies, such as near-real-time damage/risk assessment, and early warning systems.

Masashi Matsuoka
Masashi Matsuoka received the B.S. degree in architectural engineering from the Muroran Institute of Technology, Muroran, Japan, in 1990, and the M.S. and Ph.D. degrees from the Tokyo Institute of Technology (Tokyo Tech), Tokyo, Japan, in 1992 and 1996, respectively. He is currently a Professor with the Department of Architecture and Building Engineering, Tokyo Tech. He was with Tokyo Tech, Remote Sensing Technology Center of Japan, Earthquake Disaster Mitigation Research Center, Kobe, and the National Institute of Advanced Industrial Science and Technology, Tsukuba, prior to returning to Tokyo Tech. He is a Member of the Earthquake Engineering Research Institute and the Architectural Institute of Japan. His current research interests include earthquake engineering, geomorphology, GIS, and application of remote sensing technology in disaster management. Dr. Matsuoka is a Member of the Earthquake Engineering Research Institute, Tokyo, Japan and the Architectural Institute of Japan, Tokyo, Japan.
References
- Aimaiti, Y., Yamazaki, F., & Liu, W. (2018). Multi-sensor InSAR analysis of progressive land subsidence over the coastal city of Urayasu, Japan. Remote Sensing, 10(8), 1304. https://doi.org/10.3390/rs10081304
- Akarvardar, S., Feigl, K. L., & Ergintav, S. (2009). Ground deformation in an area later damaged by an earthquake: Monitoring the avcilar district of Istanbul, Turkey, by satellite radar interferometry 1992–1999. Geophysical Journal International, 178(2), 976–988. https://doi.org/10.1111/j.1365-246X.2009.04126.x
- ALOS-2/PALSAR-2 level 1.1/1.5/2.1/3.1 CEOS SAR product format description, Japan Aerospace Exploration Agency, May. (2014).
- Aslan, G., Cakır, Z., Ergintav, S., Lasserre, C., & Renard, F. (2018). Analysis of secular ground motions in Istanbul from a long-term InSAR time-series (1992–2017). Remote Sensing, 10(3), 408. https://doi.org/10.3390/rs10030408
- Berardino, P., Fornaro, G., Lanari, R., & Sansosti, E. (2002). A new algorithm for surface deformation monitoring based on small baseline differential SAR interferograms. IEEE Transactions on Geoscience and Remote Sensing, 40(11), 2375–2383. https://doi.org/10.1109/TGRS.2002.803792
- Bull, W. B., & Poland, J. F. (1975). Land subsidence due to ground-water withdrawal in the los banos-kettleman city area, california: part. 3. interrelations of water-level change, change in aquifer-system thickness, and subsidence (Vol. 3). US Government Printing Office.
- Chang, L., Dollevoet, R. P. B. J., & Hanssen, R. F. (2017). Nationwide railway monitoring using satellite SAR interferometry. IEEE Journal of Selected Topics in Applied Earth Observations and Remote Sensing, 10(2), 596–604. https://doi.org/10.1109/JSTARS.2016.2584783
- Chen, F., Lin, H., Li, Z., Chen, Q., & Zhou, J. (2012). Interaction between permafrost and infrastructure along the Qinghai–Tibet railway detected via jointly analysis of C-and L-band small baseline SAR interferometry. Remote Sensing of Environment, 123, 532–540. https://doi.org/10.1016/j.rse.2012.04.020
- Chen, F., Zhou, W., Chen, C., & Ma, P. (2019). Extended D-TomoSAR displacement monitoring for Nanjing (China) city built structure using high-resolution TerraSAR/TanDEM-X and cosmo skyMed SAR data. Remote Sensing, 11(22), 2623. https://doi.org/10.3390/rs11222623
- Cigna, F., Esquivel Ramírez, R., & Tapete, D. (2021). Accuracy of sentinel-1 PSI and SBAS InSAR displacement velocities against GNSS and geodetic leveling monitoring data. Remote Sensing, 13(23), 4800. https://doi.org/10.3390/rs13234800
- Ezquerro, P., Del Soldato, M., Solari, L., Tomás, R., Raspini, F., Ceccatelli, M., Fernández-Merodo, J. A., Casagli, N., & Herrera, G. (2020). Vulnerability assessment of buildings due to land subsidence using InSAR data in the ancient historical city of Pistoia (Italy). Sensors, 20(10), 2749. https://doi.org/10.3390/s20102749
- Ezquerro, P., Tomás, R., Béjar-Pizarro, M., Fernández-Merodo, J. A., Guardiola-Albert, C., Staller, A., Sánchez-Sobrino, J., & Herrera, G. (2020). Improving multi-technique monitoring using Sentinel-1 and COSMO-SkyMed data and upgrading groundwater model capabilities. Science of the Total Environment, 703, 134757. https://doi.org/10.1016/j.scitotenv.2019.134757
- Garg, S., Motagh, M., Indu, J., & Karanam, V. (2021). Tracking hidden crisis in India’s capital from space: Implications of unsustainable groundwater use. Scientific Reports, 12(1), 651. https://doi.org/10.1038/s41598-021-04193-9
- Ghasemi, M., Karimzadeh, S., & Feizizadeh, B. (2021). Urban classification using preserved information of high dimensional textural features of sentinel-1 images in Tabriz, Iran. Earth Science Informatics, 14(4), 1745–1762. https://doi.org/10.1007/s12145-021-00617-2
- Güven, I. T. (2022). Seismic vulnerability indices for ground in derince-kocaeli (NW Turkey). Environmental Earth Sciences, 81(5), 167. https://doi.org/10.1007/s12665-022-10288-x
- Haklay, M., & Weber, P. (2008). OpenStreetMap: user-generated street maps. IEEE Pervasive Computing, 7(4), 12–18. https://doi.org/10.1109/MPRV.2008.80
- Halicioglu, K., Erten, E., & Rossi, C. (2021). Monitoring displacements of Istanbul metro line stations through sentinel-1 and levelling observations. Environmental Earth Sciences, 80(9), 361. https://doi.org/10.1007/s12665-021-09644-0
- Hu, F., Leijen, F. J., Chang, L., Wu, J., & Hanssen, R. F. (2019). Monitoring deformationalong railway systems combining multi-temporal InSAR and LiDAR data. Remote Sensing, 11(19), 2298. https://doi.org/10.3390/rs11192298
- Karimzadeh, S., Ghasemi, M., Matsuoka, M., Yagi, K., & Zulfikar, A. C. (2022). A deep learning model for road damage detection after an earthquake based on synthetic aperture radar (SAR) and field datasets. IEEE Journal of Selected Topics in Applied Earth Observations and Remote Sensing, 15, 5753–5765. https://doi.org/10.1109/JSTARS.2022.3189875
- Karimzadeh, S., & Matsuoka, M. (2018). Building damage characterization for the 2016 amatrice earthquake using ascending–descending COSMO-SkyMed data and topographic position index. IEEE Journal of Selected Topics in Applied Earth Observations and Remote Sensing, 11(8), 2668–2682. https://doi.org/10.1109/JSTARS.2018.2825399
- Karimzadeh, S., & Matsuoka, M. (2020a). Ground displacement in east azerbaijan province, Iran, revealed by L-band and C-band InSAR analyses. Sensors, 20(23), 6913. https://doi.org/10.3390/s20236913
- Karimzadeh, S., & Matsuoka, M. (2020b). Remote sensing X-Band SAR data for land subsidence and pavement monitoring. Sensors, 20(17), 4751. https://doi.org/10.3390/s20174751
- Karimzadeh, S., & Matsuoka, M. (2021). Development of nationwide road quality map: Remote sensing meets field sensing. Sensors, 21(6), 2251. https://doi.org/10.3390/s21062251
- Karimzadeh, S., Matsuoka, M., Miyajima, M., Adriano, B., Fallahi, A., & Karashi, J. (2018). Sequential SAR coherence method for the monitoring of buildings in Sarpole-Zahab, Iran. Remote Sensing, 10(8), 1255. https://doi.org/10.3390/rs10081255
- Karimzadeh, S., Matsuoka, M., & Ogushi, F. (2018). Spatiotemporal deformationpatterns of the lake urmia causeway as characterized by multisensor InSAR analysis. Scientific Reports, 8(1), 5357. https://doi.org/10.1038/s41598-018-23650-6
- Karimzadeh, S., Valizadeh, K., & Mahdavifard, M. (2022). A multisensor satellite image classification for the detection of mangrove forests in Qeshm Island (Southern Iran). Applied Geomatics, 15(1), 177–188. https://doi.org/10.1007/s12518-022-00475-7
- Kim, J.-R., Lin, C.-W., & Lin, S.-Y. (2021). The use of InSAR phase coherence analyses for the monitoring of aeolian erosion. Remote Sensing, 13(12), 2240. https://doi.org/10.3390/rs13122240
- Lazecký, M., Spaans, K., González, P. J., Maghsoudi, Y., Morishita, Y., Albino, F., Elliott, J., Greenall, N., Hatton, E., Hooper, A., Juncu, D., McDougall, A., Walters, R. J., Watson, C., Weiss, J. R., & Wright, T. J. (2020). LiCSAR: An automatic InSAR tool for measuring and monitoring tectonic and volcanic activity. Remote Sensing, 12(15), 2430. https://doi.org/10.3390/rs12152430
- Lee, J. S. (1980). Digital image enhancement and noise filtering by use of local statistics. IEEE Transactions on Pattern Analysis & Machine Intelligence, 2(2), 165–168. https://doi.org/10.1109/TPAMI.1980.4766994
- Lepadatu, A., & Tiberius, C. (2014). GPS for structural health monitoring – case study on the Basarab overpass cable-stayed bridge. Journal of Applied Geodesy, 8(1), 65–86. https://doi.org/10.1515/jag-2013-0020
- Lovse, J., Teskey, W. F., Lachapelle, G., & Cannon, M. (1995). Dynamic deformationmonitoring of tall structure using GPS technology. Journal of Surveying Engineering, 121(1), 35–40. https://doi.org/10.1061/(ASCE)0733-9453(1995)121:1(35)
- Meier, E., Frei, U., & Nuesch, D. (1993). Precise terrain corrected geocoded images. Wichmann Verlag, SAR Geocoding. In Data and System.
- Mele, A., Crosetto, M., Miano, A., & Prota, A. (2023). Adafinder tool applied to EGMS data for the structural health monitoring of urban settlements. Remote Sensing, 15(2), 324. https://doi.org/10.3390/rs15020324
- Mele, A., Vitiello, A., Bonano, M., Miano, A., Lanari, R., Acampora, G., & Prota, A. (2022). On the joint exploitation of satellite DInSAR measurements and DBSCAN-Based techniques for preliminary identification and ranking of critical constructions in a built environment. Remote Sensing, 14(8), 1872. https://doi.org/10.3390/rs14081872
- Miano, A., DiCarlo, F., Mele, A., Giannetti, I., Nappo, N., Rompato, M., Striano, P., Bonano, M., Bozzano, F., Lanari, R., et al. (2022). GIS integration of DInSAR measurements, geological investigation and historical surveys for the structural monitoring of buildings and infrastructures: An application to the valco san paolo urban area of Rome. Infrastructures, 7(7), 89. https://doi.org/10.3390/infrastructures7070089
- Miura, H., Aridome, T., & Matsuoka, M. (2020). Deep learning-based identification of collapsed, non-collapsed and blue tarp-covered buildings from post-disaster aerial images. Remote Sensing, 12(12), 1924. 1924. https://doi.org/10.3390/rs12121924
- Miura, H., Midorikawa, S., & Matsuoka, M. (2016). Building damage assessment using high-resolution satellite SAR images of the 2010 Haiti earthquake. Earthquake Spectra, 32(1), 591–610. https://doi.org/10.1193/033014EQS042M
- Mohamadzadeh, P., Pourmoradian, S., Feizizadeh, B., Sharifi, A., & Vogdrup-Schmidt, M. (2020). A GIS-Based approach for spatially-explicit sustainable development assessments in East Azerbaijan Province, Iran. Sustainability, 12(24), 10413. https://doi.org/10.3390/su122410413
- Morishita, Y., Lazecky, M., Wright, T. J., Weiss, J. R., Elliott, J., & Hooper, A. (2020). LiCSBAS: An open-source InSAR time series analysis package integrated with the LiCSAR automated sentinel-1 InSAR processor. Remote Sensing, 12(3), 424. https://doi.org/10.3390/rs12030424
- Natsuaki, R. (2012). Local, fine Co-registration of SAR Interferometry Using the Number of Singular Points for the evaluation. IntechOpen.
- Omarzadeh, D., Karimzadeh, S., Matsuoka, M., & Feizizadeh, B. (2021). Earthquake aftermath from very high-resolution WorldView-2 image and semi-automated object-based image analysis (case study: Kermanshah, Sarpol-e Zahab, Iran). Remote Sensing, 13(21), 4272. https://doi.org/10.3390/rs13214272
- Özarpacı, S., Doğan, U., Ergintav, S., Çakır, Z., Özdemir, A., Floyd, M., & Reilinger, R. (2022). Present GPS velocity field along 1999 Izmit rupture zone: Evidence for continuing afterslip 20 yr after the earthquake. Geophysical Journal International, 224(3), 2016–2027. https://doi.org/10.1093/gji/ggaa560
- Qin, X., Liao, M., Zhang, L., & Yang, M. (2017). Structural health and stability assessment of high-speed railways via thermal dilation mapping with time-series InSAR analysis. IEEE Journal of Selected Topics in Applied Earth Observations and Remote Sensing, 10(6), 2999–3010. https://doi.org/10.1109/JSTARS.2017.2719025
- Ram, F. (2022, March). OpenStreetMap data in layered GIS format, version 0.7.12. Geofabrik.
- Sehra, S., Singh, J., & Rai, H. (2016). Analysing OpenStreetMap data for topological errors. International Journal of Spatial Temporal and Multimedia Information Systems, 1(1), 87. https://doi.org/10.1504/IJSTMIS.2016.076800
- Stramondo, S., Browitt, C., Cooksley, G., Parcharidis, I., & Zulfikar, C. (2010). PSInSAR applications in seismology: Products and services for end users management tools, SD11/P11/ID59 Proc., European Seismological Commission ESC, 32nd General Assembly, Montpellier, France, September 6-10.
- Stramondo, S., Zulfikar, C., Demircioglu, M., Lagios, E., Sakkas, V., Ganas, A., Stamatopoulos, K., Foumelis, M., Parcharidis, I., Novali, F., Bignami, C., & Chini, M. (2011). Surface displacements in active tectonic areas studied by PSI Techniques. IEEE International Geoscience and Remote Sensing Symposium, Vancouver, Canada, July 24-29.
- Su, Z., Wang, E., Hu, J., Talebian, M., & Karimzadeh, S. (2017). Quantifying the termination mechanism along the north tabriz-north mishu fault zone of Northwestern Iran via small baseline PS-InSAR and GPS decomposition. IEEE Journal of Selected Topics in Applied Earth Observations and Remote Sensing, 10(1), 130–144. https://doi.org/10.1109/JSTARS.2016.2586742
- Vaglio Laurin, G., Mattioli, W., Innocenti, S., Lombardo, E., Valentini, R., & Puletti, N. (2022). Potential of ALOS2 polarimetric imagery to support management of poplar plantations in northern Italy. Remote Sensing, 14(20), 5202. https://doi.org/10.3390/rs14205202
- Wang, Y., Bai, Z., Zhang, Y. /., Qin, Y., Lin, Y., Li, Y., & Shen, W. (2021). Using TerraSAR X-Band and Sentinel-1 C-Band SAR interferometry for deformation along Beijing-Tianjin intercity railway analysis. IEEE Journal of Selected Topics in Applied Earth Observations and Remote Sensing, 14, 4832–4841. https://doi.org/10.1109/JSTARS.2021.3076244
- Watanabe, M., Thapa, R. B., Ohsumi, T., Fujiwara, H., Yonezawa, C., Tomii, N., & Suzuki, S. (2016). Detection of damaged urban areas using interferometric SAR coherence change with PALSAR-2. Earth, Planets and Space, 68(1), 131. https://doi.org/10.1186/s40623-016-0513-2
- Xiu, H., Liu, X., Wang, W., Kim, K., Shinohara, T., Chang, Q., & Matsuoka, M. (2022). DS-Net: A dedicated approach for collapsed building detection from post-event airborne point clouds. International Journal of Applied Earth Observation and Geoinformation, 116, 103150. https://doi.org/10.1016/j.jag.2022.103150