
Abstract
Objective
Sporadic and familial amyotrophic lateral sclerosis (ALS) is a fatal progressive neurodegenerative disease that results in loss of motor neurons and, in some patients, associates with frontotemporal dementia (FTD). Apart from the accumulation of proteinaceous deposits, emerging literature indicates that aberrant mitochondrial bioenergetics may contribute to the onset and progression of ALS/FTD. Here we sought to investigate the pathophysiological signatures of mitochondrial dysfunction associated with ALS/FTD.
Methods
By means of label-free mass spectrometry (MS) and mRNA sequencing (mRNA-seq), we report pre-symptomatic changes in the cortices of TDP-43 and FUS mutant mouse models. Using tissues from transgenic mouse models of mitochondrial diseases as a reference, we performed comparative analyses and extracted unique and common mitochondrial signatures that revealed neuroprotective compensatory mechanisms in response to early damage.
Results
In this regard, upregulation of both Acyl-CoA Synthetase Long-Chain Family Member 3 (ACSL3) and mitochondrial tyrosyl-tRNA synthetase 2 (YARS2) were the most representative change in pre-symptomatic ALS/FTD tissues, suggesting that fatty acid beta-oxidation and mitochondrial protein translation are mechanisms of adaptation in response to ALS/FTD pathology.
Conclusions
Together, our unbiased integrative analyses unveil novel molecular components that may influence mitochondrial homeostasis in the earliest phase of ALS.
Introduction
Despite significant recent progress in the study of molecular mechanisms underlying the pathogenesis of neurodegenerative disorders (NDs), the initial causative factors of sporadic NDs remain poorly understood. ALS is a severe, chronic, progressive ND characterized by irreversible degeneration of upper and lower motor neurons leading to muscle atrophy, paralysis, and death within 5 years of symptom onset. A significant portion of ALS patients also develop FTD. FTD is characterized by progressive neuronal atrophy with loss in the frontal and temporal cortices associated with deterioration in behavior, progressive apathy, and dementia during the later stages of the disease. Although ALS and FTD were historically considered distinct diseases, evidence now indicates significant overlaps, with some ALS patients exhibiting clear traits of FTD, and some FTD patients exhibiting the motor neuron degeneration associated with ALS (Citation1). Moreover, the genetic and pathological causes of familial forms of ALS and FTD also overlap (Citation2). For example, the most common mutations in both ALS and FTD are repeat expansion mutations of C9orf72 (Citation3), and mutations or dysregulation of the TAR DNA-binding protein 43 (TDP-43, also known as TARDBP) and the DNA/RNA-binding protein FUS (Citation4). These pathological proteins stimulate and directly participate in the formation of intraneuronal protein aggregates, characteristic of patients with ALS and FTD (Citation5), that sequester several mRNAs and proteins. While the pathology associated with FUS and TDP-43 is believed to affect several aspects of motor neuron function, it may specifically target mitochondrial metabolism. Cellular and animal models have shown that FUS disrupts the formation of the ATP synthase complex and can interfere with mitochondrial protein folding (Citation6). Similarly, TDP-43-associated aggregates colocalise with mitochondria and impair their dynamics and morphology (Citation7), as well as inhibit translation of mitochondrial mRNAs that encode the ND3 and ND6 subunits of oxidative phosphorylation (OXPHOS) complex I (Citation8). Interestingly, several in vitro and in vivo TDP-43- and FUS-related ALS/FTD models have identified impaired bioenergetics and mitochondrial dysfunction as early critical events driving neurodegeneration (Citation6,Citation7,Citation9–11). Other TDP-43 ALS-related models have detected alterations in mitochondrial transport but no defects in mitochondrial bioenergetics (Citation12–14), a finding also observed in vitro in patient-derived motoneurons (Citation15). Hence, it is possible that mitochondrial dysfunction may only be present and detectable once neurodegeneration has occurred, in the symptomatic stages of these disorders.
To explore the role of mitochondrial dysfunction as an early, contributing factor to the disease progression, we here aimed to investigate the association between the ALS/FTD- -initiating proteinopathy and mitochondrial dysfunction, focusing on pre-symptomatic disease stages and the possibility of determining stress adaptation mechanisms. We conducted label-free mass spectrometry (MS) and mRNA sequencing (mRNA-seq) and compared proteomic and transcriptomic signatures between two pre-symptomatic ALS/FTD progression models and between two mitochondrial disease models. We performed bioinformatics analyses to identify transcriptional master regulators.
Materials and methods
Animals and ethics approval
This study was conducted in strict accordance with Directive 2010/63/EU on the protection of animals used for scientific purposes. Ethical approval at RCSI was obtained from the Animal Research Ethics Committee of the Royal College of Surgeons in Ireland (ethics reference number: REC1122b) under license from the Irish Health Products Regulatory Authority (AE19127/P004). Experiments at DZNE were performed according to the guidelines of the State Agency for Nature, Environment and Consumer Protection in North Rhine Westphalia.
ALS disease models: FUS (ΔFUS(1-359)) mice on a congenic C57Bl/6 background were generated in the laboratory of Prof. Vladimir Buchman (Cardiff University; (Citation16)) and re-derived at the Institute of Molecular Genetics of the ASCR, Prague, Czechia. TDP (TDP-43A315T) mice, on a congenic C57Bl/6 background (B6.Cg-Tg(Prnp-TARDBP*A315T)95Balo/J), were purchased from The Jackson Laboratory (Bar Harbor, Maine, USA) and originally generated in the laboratory of Dr Baloh (Citation17). TDP mice were maintained using a protocol that ensures development of symptomatic motor dysfunction after postnatal day (PND) 120 (Citation18). Only male TDP mice were used, as female mice have variable disease penetrance (Citation19). FUS mice were maintained on a regular diet and develop motor dysfunction and pathology after PND90 (Citation20). Both sexes of FUS mice were used. Mice were age- and litter-matched according to ALS pre-clinical trial guidelines (Citation21). Animals were housed in cages with 3-5 mice at a constant temperature (22 °C) on a 12h light/dark cycle (07:00h on, 19:00h off), with ad libitum availability of food and water. Mice were genotyped by PCR.
AIF-deficient mouse models: Hq (B6CBACa Aw-J/A-Aifm1Hq/J) mutant mice were obtained from JAX (stock number:000501). Aifm1 (R200 del) KI mice were generated as previously described (Citation22).
Study design
This study was not pre-registered. No randomization was performed to allocate subjects in the study. No blinding was performed. No sample calculation was performed. This study was exploratory. For FUS (ΔFUS(1-359)), TDP (TDP-43A315T), Aifm1 (R200 del) KI and Harlequin mutant mice, no animals were excluded from the study. Experiments were conducted in the morning.
Cerebral cortex tissue dissection
Mice were euthanized by cervical dislocation. Cerebral cortices were harvested from TDP (n = 6) and FUS (n = 7) mutant mice, along with their littermate wildtype controls, at PND 60 (range PND 57-62) and PND 50 (range PND 49-51), respectively, corresponding to the pre-symptomatic stage of disease progression (Citation19). Cortices from Hq (n = 4) and Aifm1 (n = 4) mice, and their littermate wildtype controls, were harvested around PND180. In brief, mice were sacrificed by rapid cervical dislocation, and the brain was carefully isolated and placed in ice-cold dissection buffer (1× PBS with 0.25% glucose and 0.3% BSA). The meninges were removed, and the cerebral cortex was isolated and placed in labeled cryotubes and frozen in liquid nitrogen. The samples were stored at −80 °C until use.
RNA extraction and RNA-sequencing
RNA was extracted from the cortex using the standard protocol for TRIzol extraction. In brief, TRIzol was added to the frozen tissue before mechanical disruption, addition of chloroform, and centrifugation at 12000g, 4 °C for 15min. The upper, aqueous phase was isolated, and the RNA was precipitated using isopropanol, before diluting to the desired concentration in RNase-free water. The RNA samples were sent to VIB-KU Leuven for whole-transcript mRNA sequencing using the KAPA stranded mRNAseq kit as previously described (Citation23).
Protein extraction and LC-MS/MS proteomics
Cortical samples were first homogenized in lysis buffer (100 mM Tris (hydroxymethyl) amino-methane hydrochloride (Tris-HCl), pH 7.5) with protease (complete Mini Protease Inhibitor Tablets, Roche) and phosphatase inhibitors (PhosSTOP, Roche). 2% SDS was added before sonication and subsequent centrifugation. Protein concentration was quantified using the Pierce BCA protein assay kit (Thermo Scientific). Samples were further processed in Dr Matallanas’ laboratory as described previously (Citation24). Briefly, SDS removal and protein multi-digestion was conducted by filtered aided sample preparation (Citation25,Citation26). The resulting trypsin peptides were loaded onto C18 Stage tips for centrifugation before elution in 50% AcN − 0.1% TFA. A spike-in of 2 pmol Hi3 E.Coli Standard per sample was added prior to the MS run.
MS proteomics was performed by the UCD Conway Institute Mass Spectrometry Core Facility on a Q Exactive™ Hybrid Quadrupole-Orbitrap™ Mass Spectrometer (Thermo Scientific) coupled to an Ultimate™ 3000 RSLCnano (Dionex) ultra-high pressure nanoflow chromatography system. Peptides were separated on a reversed-phase column packed in-house (15cm x 75μm ID; Reprocil® Pur C18, 1.9 μm) at a constant flow rate of 250 nL/min and an increasing acetonitrile gradient. Mobile phases were 0.1% (v/v) acetic acid, 2.5% (v/v) acetonitrile in water (phase A) and 0.1% (v/v) acetic acid, 2.5% (v/v) water in acetonitrile (phase B). Peptides were separated by a gradient starting at 1% mobile phase B and increased linearly to 27% over 180 minutes. The injection volume was 5 μL, equivalent to an estimated 10 μg per sample. The mass spectrometer was operated in positive ion polarity. All data were acquired in automatic data dependent switching mode. High resolution MS scans (70,000 FWHM) were performed in a mass range from 300 to 1600 m/z prior to switching to MS/MS analysis using HCD. Two technical replicates were run for FUS and TDP samples while one technical replicate was obtained for the Hq and Aifm1 samples due to limited sample availability.
OCR and ECAR measurements
Oxygen consumption rate (OCR) and extracellular acidification rate (ECAR) were simultaneously measured in ex vivo cortical slice punches using a Seahorse XFe96 Extracellular Flux Analyzer (Agilent) following the addition of 1) glucose (20 mM) and 2) rotenone + antimycin A (10 μM) to inhibit mitochondrial respiration and induce minimal OCR and maximal ECAR. Full details are provided in Suppl. Methods.
RNA-sequencing data analysis
Transcriptome profiles were created using in-house bioinformatics pipelines in collaboration with KU-VIB. Raw reads were first pre-processed for optical duplicate removal using Clumpify (https://sourceforge.net/projects/bbmap). Processed reads were mapped to the mouse genome (GRCm38) using STAR (V2.6) aligner (Citation27). Mapped SAM files were converted into BAM files using samtools (Citation28). Htseq-count was used to process the BAM files to obtain count data (Citation29). Count data were normalized and differential expression analysis was performed using edgeR (v3.28) in R (Citation30). mRNAs with p-value < 0.05 were considered differentially expressed. Sequencing data are deposited on gene expression omnibus (GEO) under accession GSE196482.
Proteomics data analysis
Preliminary iBAQ LC-MS/MS quantities were processed in Perseus v1.6.7.0 environment (Citation31). Processing included: deletion of proteins matching to reverse database and contaminants; relative iBAQ (riBAQ) normalization (Citation32,Citation33); exclusion of proteins identified by site, log2 transformation. Further analysis was continued in the R environment (Citation34). Differentially expressed proteins (DEPs) were identified by moderated t-test with Benjamini-Hochberg FDR adjustment with the limma package (v3.40.6) (Citation35). To account for technical replicate dependence in the case of FUS and TDP proteomics, the correlation approach with duplicateCorrelation function was applied (Citation36). Proteomics data are deposited on the ProteomeXchange Consortium via the PRIDE partner repository under identifier PXD030210.
Gene Ontology (GO) enrichment analysis
Enrichment of gene ontology (GO) in biological process (BP) terms and KEGG Pathway terms was performed by hypergeometric testing using enrichGO and enrichKEGG functions from the clusterProfiler package (Version 3.12.0) (Citation37). For further identification of more specific GO BP terms, we employed the topGO package (Version 2.38.1) (Citation38) that performs GO over representation tests accounting for the topology of the GO graph. GO BP terms among differentially expressed mRNAs (DEGs) and proteins (DEPs) were tested with the following topGO parameters: node = 5, algorithm = “weight01”, statistic = “fisher”.
Master Regulator (MR) analysis
To identify systematic changes in the protein profile associated with transcriptional regulation, we performed MR analysis on a set of proteins of interest, selected by comparing DEPs to their mRNA expression. The final list of proteins of interest is comprised of DEPs that were also differentially expressed at the mRNA level in the same mutant model (DEGs with p < 0.05) or DEPS whose expression positively correlated (Spearman’s correlation with p < 0.05) with mRNA levels across both WT and mutant samples. Moreover, we considered both positive and negative associations between DEPs and their corresponding DEGs. Thus, we account for genes whose transcription is triggered in response to decreased protein levels and, vice versa, whose expression is suppressed due to the abnormal protein accumulation.
As Hq and Aifm1 models were profiled for protein and mRNA in different samples DEPs of interest for these models were identified based on co-occurrence of DEPs and associated DEGs only.
We utilized the MAster Regulator INference algorithm (MARINa) and single-sample MAster Regulator INference algorithm (ssMARINa) (Citation39–42) to identify prominent transcriptional drivers of early disease development in each model. To derive cortex-specific master regulators (MRs) that drive the initial pathology network, the choice of a reference interactome is critical. For this reason, we used the whole-brain murine interactome (BrainNet) (Citation41,Citation42) which has been shown to outperform all other available regulons in the context of murine neurodegenerative pathology pathway analysis (Citation41). ssMARINa MRs with FDR <0.01 were further validated with the JASPAR database (Citation43), Enrichr tool (Citation44,Citation45), and ChEA3 enrichment platform (Citation46).
Cell type deconvolution
Cell type deconvolution was performed with the Single-cell Assisted Deconvolutional Network (SCADEN) tool with default parameters (Citation47). Mouse brain single cell RNA-seq data obtained from the scRNA-seq dataset collection at the Hemberg laboratory (https://hemberg-lab.github.io/scRNA.seq.datasets/) was used as a training dataset to assign cells in the bulk RNA-seq data.
Antibodies. The following antibodies were used in this study: mouse anti-ATP5 subunit alpha for complex V (abcam, ab14748, Lot:GR160041-5, RRID:AB_301447); mouse anti-MTCO1 for complex IV (Abcam, ab14705, Lot:GR3338268-15, RRID:AB_2084810); mouse anti-NDUFS3 for complex I (abcam, ab110246, Lot:GR3222037-1, RRID:AB_10861972); mouse anti-GFP (Roche, 11814460001; RRID:AB_390913); mouse anti-actin (Sigma, MAB1501 Millipore, RRID:AB_94235); mouse anti-tubulin (Sigma, T6074, RRID:AB_477582); secondary antibody: goat anti-mouse IgG (H + L) HRP conjugated (Invitrogen, G21040).
Results
Disease models under study
We compared proteomic and transcriptomic signatures in the cerebral cortex between pre-symptomatic ALS/FTD progression models. We focused on a TDP-43 transgenic mouse model, as cytoplasmic protein aggregates containing phosphorylated and ubiquitinated TDP-43 are a hallmark of sporadic ALS (Citation48). In addition, we included a FUS transgenic mouse model, as FUS, similar to TDP-43, functions as an RNA-binding protein. These two disease models are driven by TDP-43 (TDP-43A315T (Citation17)) and FUS (ΔFUS(1-359) (Citation16)) mutations and were extensively characterized previously in our lab (Citation18,Citation19,Citation49). Both mutations induce mislocalization of these predominantly nuclear proteins, leading to their aggregation, solid cytoplasmic protein inclusions, and functional deficits after postnatal day (PND) 120 or 90, respectively (Citation18,Citation20). Since our study focused on pre-symptomatic signatures, we extracted cerebral cortex samples from mice around PND 60 and 50 for the TDP and FUS models (), respectively. We conducted label-free mass spectrometry (MS) and mRNA sequencing (mRNA-seq) on matched samples and performed bioinformatics analysis comparing signatures between models ().
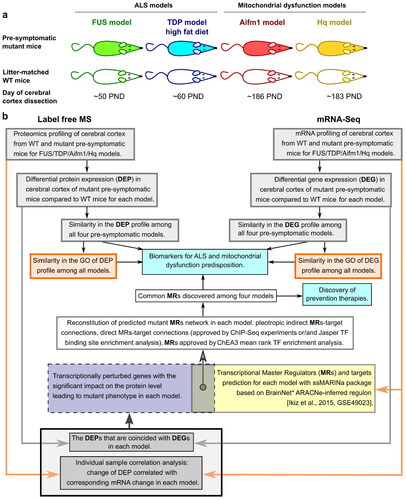
Figure 1 Study Pipeline. a Animal models used: FUS model - ΔFUS(1-359) mice on a congenic C57Bl/6 background, TDP model - TDP-43A315T mice on a congenic C57Bl/6 background, Hq model - Harlequin (Hq) mutant mice (B6CBACa Aw-J/A-Aifm1Hq/J), and Aifm1 model - Aifm1 (R200 del) KI mice. b Schematic diagram representing the methodological design of this study.
Pre-symptomatic samples from the ALS/FTD mouse models were also compared to two related mouse models with a primary mitochondrial dysfunction due to a deficiency of Aifm1 (Apoptosis-inducing factor mitochondria associated 1), the gene encoding the AIF protein. AIF-deficient transgenic mice are excellent models of a neurological disorder caused by mitochondrial dysfunction, as an assembly of multiple mitochondrial complexes, most prominently OXPHOS complex I, are involved in disease pathology (Citation50). Specifically, we used Harlequin (Hq) mutant mice (B6CBACa Aw-J/A-Aifm1Hq/J) at PND 180, with a roviral insertion that disrupts Aifm1 expression (Hq model), and Aifm1(R200 del) knock-in (KI) mice at PND 180, carrying a disease-causing mutation that impairs post-transcriptional AIF expression (Aifm1 model) (Citation51–55). In both models the loss of AIF function disrupts the expression of several OXPHOS complexes (Citation50), interrupting mitochondrial bioenergetics and triggering neuropathy (Citation22,Citation56). As these mitochondrial disease models do not exhibit overt neurodegeneration within the cortex at the time of sample acquisition (Citation22,Citation57–60), this enabled us to compare pre-symptomatic gene/protein signatures in the ALS/FTD models with signatures in established models of mitochondrial dysfunction.
Distinct functional defects specific for mitochondrial disorders are pronounced in pre-symptomatic TDP and FUS ALS models at the proteomic level
We started by analyzing proteomic signatures at the pre-symptomatic stages in the ALS/FTD mouse models, using label-free quantitative mass spectrometry (Materials and methods) and comparing changes to the Hq mutant and Aifm1(R200 del) KI mice. We identified DEPs for each mutant model (, Supplementary Table 1), determining the statistical significance of the difference with a P-value ≤ 0.05 (Citation61), and compared enriched biological processes across all four models using GO enrichment analysis on the sets of DEPs (Supplementary Table 1).
Figure 2 Comparison of mutant and wildtype (WT) mice cerebral cortex mRNA and protein expression profiles. a Volcano plots illustrate differentially expressed proteins (DEPs) and differentially expressed genes (DEGs) in FUS WT (n = 5) versus FUS mutant (mut) (n = 7), TDP WT (n = 5) versus TDP mut (n = 6), Aifm1 WT (n = 4) versus Aifm1 mut (n = 4), and Hq WT (n = 4) versus Hq mut (n = 4) samples. Horizontal dashed lines are drawn at p-value = 0.05, and blue dots indicate p-value ≤ 0.05. Proteins and mRNAs indicated by purple dots have FDR adjusted p-value ≤ 0.1. DEPs and DEGs are labeled with corresponding gene names. b Commonly enriched Gene Ontology (GO) Biological Process (BP) terms in DEPs across the four mice models. Yellow boxes represent overlapping Biological Process GO terms (BP).
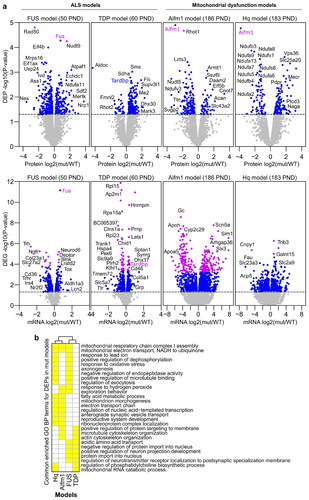
The FUS model revealed an imbalance in the expression of proteins involved in mitochondrial respiratory chain complex I (CI) assembly and mitochondrial electron transport, in similarity with the mitochondrial dysfunction models Hq and Aifm1 (). Consistent with aberrant assembly of mitochondrial respiratory chain complexes due to AIF deficiency (Citation22,Citation50,Citation56), we found a significant loss of CI subunits in Hq mutant mice (NDUFA2/6-11/13, NDUFB3/5/7/9-11, NDUFC2, NDUFS5/6/8, NDUFV1) and a less severe loss in Aifm1(R200 del) KI mice (NDUFB6, NDUFS 4/6) (). The FUS model, on the other hand, demonstrated reduced expression of the complex III (CIII) subunit BCS1L and CI subunit NDUFA6, and increased expression of four other CI subunits NDUFA1/11, NDUFB6, and NDUFV1 (Supplementary Table 1). This dysregulation may suggest an early compensatory mechanism associated with FUS pathology that appears prior to symptom onset.
The cytoplasmic mutant FUS aggregates sequester a high number of mRNAs and promote their translational silencing. Among these sequestered mRNA are transcripts that encode for a number of respiratory chain complex proteins (Citation9,Citation62). To discriminate whether BCS1L and NDUFA6 protein expression is reduced due to transcription or translation alterations, we performed mRNA-seq analysis on the same set of samples (, Supplementary Table 1). Interestingly, we found that neither of these two subunits were downregulated at the mRNA level, suggesting that proteomic suppression occurs rather than due to translational silencing or protein degradation. Surprisingly, the upregulated proteins NDUFA1/11, NDUFB6 and NDUFV1 were also not transcriptionally overexpressed. Thus, the proposed compensatory mechanism potentially evolved through translational regulation, or through protein stability and degradation control.
Finally, Seahorse respirometry experiments on cortical tissue slices from the FUS model confirmed that there were no significant defects in basal OCR between mutant and wildtype, indicating that protein dysregulation observed at the pre-symptomatic stages is not sufficient to impact basal mitochondrial respiratory function at this stage (Supplementary Figure 2a). Interestingly, FUS cortical slices exhibited significantly reduced extracellular acidification rates (ECAR; Supplementary Figure 2(b)), suggesting that functional bioenergetic alterations are at the level of glycolysis-induced lactate release or other acidification processes such as mitochondrial oxidative decarboxylation or the oxidative pentose phosphate pathway.
In contrast, the pre-symptomatic TDP model shared biological processes with the AIF-deficient mitochondrial disease models that were not enriched in the FUS model. Specifically, we found that enrichment of mitochondrial RNA catabolism and regulation of phosphatidylcholine biosynthesis were shared with the Hq model, whereas microtubule/actin cytoskeleton organization and positive regulation of protein targeting to the membrane were shared with the Aifm1 model (). All proteins populating the two GO terms shared between TDP and Hq were upregulated (Supplementary Table 2). Moreover, within these GO terms, Acyl-CoA Synthetase Long-Chain Family Member 3 (ACSL3) and Suv3 Like RNA Helicase (SUPV3L1) were mutually overexpressed in both Hq and TDP models. This may signify synergy between increased mitochondrial RNA processing and lipid turnover efficiency in these models.
The GO terms shared by the TDP and Aifm1 models primarily included upregulated proteins for TDP. However, all proteins populating the GO term “positive regulation of protein targeting to membrane” from the Aifm1 model were downregulated. In addition, a substantial portion of proteins populating the GO term “microtubule/actin cytoskeleton organization” were also downregulated in the Aifm1 model. The influence of the high fat diet, exclusive to the TDP model, may play a central role in these observed differences, making it difficult to integrate the origin of these dysregulations.
Overlapping metabolic adaptation signatures unite ALS/FTD and AIF-deficient mitochondrial disease models at the individual protein level
We next investigated whether specific proteins were commonly overexpressed () or downregulated (Supplementary Figures 1(a), Citation3) in the ALS/FTD and AIF-deficient models.
Figure 3 Protein overexpression shared across ALS/FTD and AIF-deficient mitochondrial disease models. a Protein overexpression observed in at least two models with a p-value ≤ 0.05. Proteins are grouped and color coded according to their annotated function. b Metabolic pathways utilized by commonly overexpressed metabolic enzymes (coloured red), adapted from the KEGG PATHWAY database (Citation94).
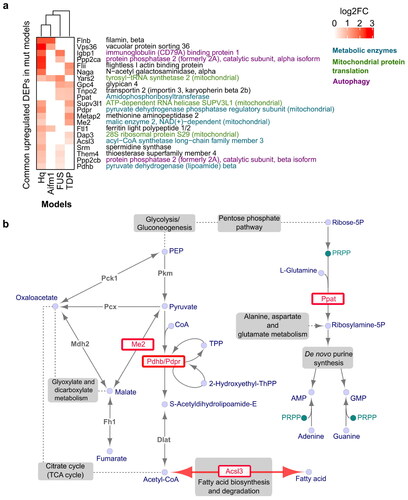
Firstly, we found that upregulation of metabolic enzymes was consistently observed across ALS and AIF-deficient mice (). The overexpression of pyruvate dehydrogenase subunits, PDHB (Hq, FUS) and PDPR (Hq, TDP), and the malic enzyme ME2 (Hq, TDP) may indicate increased pyruvate utilization and synthesis of Acetyl-CoA (). Increased Acetyl-CoA synthesis may also be suggested by the overexpression of ACSL3 (Hq, TDP), which can supply Acetyl-CoA by fatty acid (FA) catabolism through β-oxidation. Interestingly, ACSL3 was also upregulated at the mRNA level in the FUS model, possibly in response to low protein expression in this model (Supplementary Table 1). Indeed, ACSL3 has a dual function. In addition to FA catabolism, ACSL3 also stimulates FA synthesis and retention within lipid droplets (LDs) that can rescue metabolic function during energetic stress (Citation63–65). The reduced ECAR observed in the FUS model is an indicator of energetic stress and could indicate shuttling of pyruvate to Acetyl-CoA rather than lactate (Supplementary Figure 2(b)). Thus, this reversible function of ACSL3 possibly explains the co-occurrence of low protein with high mRNA expression in the pre-symptomatic FUS model, as a temporal adjustment to the required recovery program. Considering that ACSL3 is specifically expressed in the brain, having the highest mRNA level compared to other tissues (Citation66), dysregulation of ACSL3 expression could be a good candidate for a biomarker of early adaptation to the energetic stress characteristic of ALS/FTD and mitochondrial diseases.
As an additional signature, we found that both FUS and TDP models overexpress the amidophosphoribosyl-transferase, PPAT, one of three monofunctional enzymes that catalyze the initiation of de novo purine (AMP and GMP) biosynthesis. Of note, the upregulation of this metabolic enzyme was not detected in tissues from AIF-deficient mice, suggesting it is specifically regulated in the ALS/FTD models.
Among commonly downregulated metabolic proteins, NDUFA13 was observed in both Hq and TDP models, and NDUFA6 in the Hq and FUS models (Supplementary Figure 3). NDUFA6 and NDUFA13 are subunits of the OXPHOS CI NADH:Ubiquinone Oxidoreductase. Lack of both these proteins has been found to be associated with CI deficiency that is known to play a key role in Alzheimer’s, Huntington’s, Parkinson’s, and many more neurodegenerative and mitochondrial disorders (Citation67–72).
Early ALS/FTD models and mitochondrial dysfunction models demonstrate a proteomic signature of strengthened mitochondrial protein synthesis
In addition to the metabolic signature that unites the early ALS/FTD models, TDP and FUS, with the AIF-deficient models, Hq and Aifm1, we identified increased expression of proteins involved in mitochondrial protein synthesis. Two mitochondrial proteins, 28S ribosomal protein S29 (DAP3) and SUPV3L1, were overexpressed in both the TDP and Hq models. SUPV3L1, as mentioned earlier, is involved in mitochondrial RNA catabolism by stabilizing the maintenance of mtDNA and promoting mtRNA translation (Citation73).
Additionally, we also found one mitochondrial protein, YARS2, that was upregulated in three models, FUS, Hq, and Aifm1 (). YARS2 encodes the mitochondrial tyrosyl-tRNA synthetase 2. Mutations in the YARS2 gene are associated with myopathy with lactic acidosis, and OXPHOS complex dysregulation (Citation74–79). Moreover, brain tissue in general has the highest mitochondrial tRNA (mito-tRNA) levels (Citation80), including tyrosyl-tRNA, indicating a higher demand on mito-tRNA synthesis in neuronal tissue. The reason for the specifically enhanced tyrosyl-tRNA synthesis through YARS2 overexpression in these models remains to be determined. Nevertheless, based on our analysis, we consider YARS2 up-regulation as a potential biomarker of adaptation to energetic stress conditions that can be detected at the pre-symptomatic stage of ALS development.
Finally, we performed mRNA-based cell type deconvolution in both ALS models (Supplementary Figure 4) and confirmed that all proteomic signatures we identified are apparent before any significant loss of neurons, microglia activation or astrogliosis.
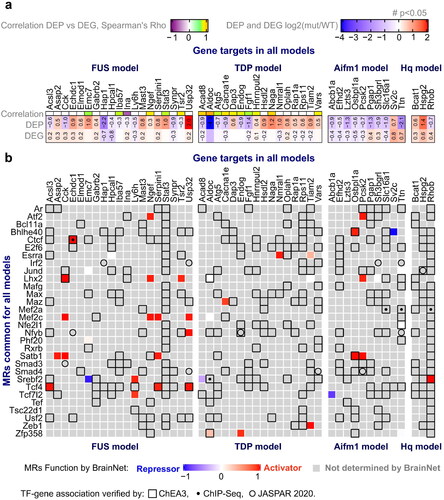
Figure 4 Common master regulators (MRs) among all models. a Proteins/gene targets of interest were selected if significant Spearman correlation (Rho) was identified between protein and mRNA expression across WT and mutant samples, or they exhibited significant differential expression at both the protein and gene level (p-value <0.05 as indicated by a number (#)) (see Materials and methods). b Common MRs found by ssMARINa (Citation39–42) with reference BrainNet (Citation41,Citation42) regulon across the four disease models are shown in the rows, with the genes of interest for each model in the columns. MR – target gene associations verified by ChEA3 (Citation46), ChIP-Seq, or JASPAR (Citation43) are indicated by an empty square, dot or empty circle respectively. The effect of MRs on the genes of interest (repressor, activator) for each model are indicated (blue, red respectively). MRs without a reported function on a gene are denoted in grey.
Master regulator analysis
To investigate proteomic adaptations and their transcriptional regulation by master regulators (MRs), we analyzed our mRNA sequencing performed on the FUS, TDP, Hq mutant and Aifm1(R200 del) KI mice (Materials and methods, ). Due to the relatively low sample numbers and early pre-symptomatic effects that may be less pronounced at this stage, we considered all genes that were differentially regulated with a p-value ≤ 0.05 (DEGs). We first derived a set of genes/proteins of interest by comparing DEPs to their mRNA expression with a correlation method (Materials and methods). The final list of DEPs may either have a feedback effect on their own transcription, in case of negative correlation between protein and mRNA, or have been affected by transcription changes, in case of positive correlation (). This list of DEPs was subjected to Master Regulator (MR) analysis. First, we applied the MARINa algorithm (Citation39–42) with the whole-brain murine interactome (BrainNet) (Citation41,Citation42) as the reference regulon for the differential expression signature. This approach did not identify significantly enriched MRs in any of the 4 models, possibly because of limited dysregulation. Therefore, we applied the single sample MARINa algorithm (ssMARINa) (Citation39–42) with the same regulon to generate a matrix of regulator activity from the gene expression profiles on a sample-by-sample basis. MRs with FDR < 1% were selected as preliminary candidates. Next, we checked whether these candidates were also predicted by other approaches. First, we identified transcription factor (TF) binding site enrichment in our genes of interest by using the JASPAR database (Citation43). A second approach was based on mouse ChIP-seq TF binding site enrichment, acquired with the Enrichr tool (Citation44,Citation45). Third, we also probed genes of interest using the ChEA3 enrichment platform (Citation46) which is based on the orthogonal omics integration approach including tissue-specific co-expression patterns (GTEx, ARCHS4). The ssMARINA-based MR candidates confirmed by any of the other three approaches were considered verified. This process was repeated for DEPs and DEGs from all four animal models. The table of verified MRs common across all models in connection to their targets is shown in . Among them, TCF4 was identified as an MR that can coordinate proteomic-related signatures including transcriptional activation of ACSL3, which we found to be affected in three models (at the protein or mRNA level). By conducting gene enrichment analysis, we made a noteworthy discovery. The analysis revealed a highly significant enrichment of MRs (Smad4 and Atf2) associated with the term GO:0003360, which is related to brainstem development. Remarkably, this term comprises only four genes, and only two of them, Smad4 and Atf2, are transcription factors. This finding underscores the relevance of Smad4 and Atf2 MRs in regulating the genetic mechanisms involved in brainstem development. Moreover, four of MRs: Mef2c, Atf2, Max and Jund, together significantly contribute to MAPK signaling pathway (KEGG:mmu04010). Indeed, upregulation of MAPK pathway found to play key role in motoneuron degeneration and recent studies are reporting on success in the prevention of degeneration with the application of the inhibitors of MAPK signaling pathway (Citation81,Citation82).
Discussion
We herein provide signatures of early ALS/FTD development related to mitochondrial dysfunction. Our analysis compared proteomic and transcriptomic profiles of two presymptomatic ALS/FTD mouse models together with two transgenic mouse models carrying genetic lesions of the Aifm1 gene that lead to AIF deficiency and mitochondrial dysfunction ().
Our analysis identified that TDP and FUS models share different proteomic signatures with the AIF-deficient models, Aifm1(R200 del) KI and Hq. While the FUS model exhibited an early imbalance in the components of the mitochondrial OXPHOS complexes (seen in both AIF-deficient models), the TDP model showed dysregulation of cytoskeleton integrity and transport (seen in the Aifm1 model) and mitochondrial RNA catabolism and regulation of phosphatidylcholine biosynthesis (characteristic of the Hq model) (). These proteome-level similarities were not accompanied by mRNA expression changes, indicating regulation of translation and/or protein stability and degradation. A lack of overlapping pathways suggests that TDP and FUS models exhibit differences in their early metabolic adaptive mechanisms.
We note that we cannot confirm whether the observed proteomic/transcriptomic changes were protective or pathogenic in these models. Nevertheless, focusing on individual proteomic markers, we propose that some proteomic changes were related to a compensatory/adaptation program to overcome pathological processes. It has previously been shown that cytoplasmic FUS mutant aggregates lead to the depletion of mRNAs encoding respiratory chain proteins (Citation9). Here, we confirmed the downregulation of several mitochondrial respiratory chain subunits possibly suppressed through FUS aggregation (Suppl. Figure 3). However, we also found an increased abundance of other respiratory chain subunits such as CI subunits NDUFA1/11, NDUFB6, and NDUFV1, along with the absence of mitochondrial respiration defects (Supplementary Figure 2(a)). These results suggest the existence of an early compensatory/adaptative mechanism through which FUS-induced mitochondrial dysfunction may be attenuated/delayed. In fact, recent studies identified mitochondrial defects and reduced OCR in a HEK293T cell line upon transfection with mutant FUS or overexpression of WT FUS (Citation9), although this effect was not found in motor neurons derived from ALS patients carrying FUS mutations (Citation15). The mitochondrial response to the expression of mutant FUS may be a transient event, as shown in a tetracycline-inducible system developed in the HEK293 cell line, where increased mitochondrial membrane potential, detected at 16–24 h after induction, subsequently dissipated by the 48–72 h time interval (Citation6).
We also identified potential metabolic adaptations in the efficiency of pyruvate utilization across both ALS/FTD and AIF-deficient models, through the overexpression of several metabolic enzymes such as subunits of pyruvate dehydrogenase PDHB (in Hq, FUS) and PDPR (in Hq, TDP), and upregulation of ME2 (in Hq, TDP) (). Pyruvate is known to prevent development of cognitive defects in amyloid and tau aggregate pathology-related NDs (Citation83). Interestingly, we also detected significantly reduced ECAR in FUS mutant compared to wildtype. Reductions in ECAR may occur due to reduced glycolysis, although this is not suggested at the transcript or protein level or may suggest redistribution of pyruvate conversion from lactate to Acetyl-CoA via increased expression of PDH subunits. The oxidative pentose phosphate pathway also contributes to ECAR (Citation84). Moreover, upregulation of PPAT in both ALS/FTD models indicates possible enhancement of de novo purine biosynthesis normally accomplished by the oxidative pentose phosphate pathway.
Third, we aimed to identify particular protein overexpression common to both ALS/FTD and AIF-deficient models that may represent these adaptive/compensatory mechanisms and carry protective function. ACSL3 was an evident candidate that was overexpressed in the Hq and TDP models at the protein level, and in the FUS model at mRNA level. ACSL3 can supply Acetyl-CoA trough FA catabolism to directly support mitochondrial function, and can also stimulate FA synthesis and retention within lipid droplets (LDs) to rescue metabolic function during energetic stress (Citation63–65). Recently, the acceleration of Acetyl-CoA synthesis accompanied by increased FA metabolism and impaired mitochondrial function were proven to be involved in recovery after proteotoxic stress triggered by proteasomal inhibition in cancer (Citation85). Furthermore, LD accumulation, observed in glial cells during oxidative stress, protects neurons from peroxidation damage (Citation86–88). Lack of ACSL3 expression can impair the accumulation of neutral lipids that leads to smaller and fewer mature LDs (Citation89). Furthermore, downregulation of ACLS3 and, as a result, impaired LD biogenesis, could be associated with the development of VAPB-mediated ALS pathology (Citation90). Additionally, the fact that a high fat diet can significantly delay ALS symptom onset and prolong survival in ALS mice models (SOD1 and TDP-43 particularly) (Citation18,Citation91), suggests potential involvement of ACSL3 in neuroprotection. Understanding the role of ACSL3 in neurodegeneration should be addressed in future studies.
Finally, we identified common proteomic signatures of enhanced mitochondrial protein synthesis between ALS/FTD and AIF-deficient models. In particular, we found overexpression of DAP3 and SUPV3L1 in the TDP and Hq models and especially overexpression of YARS2 in the FUS, Hq and Aifm1 models. These proteins regulate mitochondrial RNA catabolism and support protein synthesis. Considering that aggregates of mutant TDP are imported into mitochondria and mutant FUS are proximally associated with mitochondria where both sequester the respiratory chain complex transcripts leading to translational suppression (Citation8,Citation9,Citation62), overexpression of SUPV3L1, DAP3 and especially YARS2 could be indispensable in rescuing the mitochondrial proteome which is devoted to the maintenance of OXPHOS. A recent study in patient-derived fibroblasts identified decreased mitochondrial respiration and decreased mitochondrial translation associated with low YARS2 expression (Citation92). Moreover, YARS2 not only regulates mitochondrial protein translation, but also controls the stability and activity of OXPHOS complexes directly interacting with the CI and CIV subunits (Citation93). Most importantly, mitochondrial dysfunction has been shown to be rescued by overexpression of YARS2 (Citation93). Therefore, our findings suggest that YARS2 upregulation may also be a sign of adaptation in early ALS/FTD models, and its activation may be further investigated as a therapeutic target in ALS, FTD and other NDs accompanied by mitochondrial dysfunction.
In conclusion, our unbiased integrative analyses unveiled several novel molecular components that may underlie compensatory mechanisms influencing mitochondrial homeostasis in the earliest phase of ALS/FTD.
Authors’ contributions
AM, NK and DG analyzed and interpreted the data, and drafted the manuscript. OW, AR, DG, IFP, ILF, CF, ELC, JJ, AP, LW, IW, LH, MH, AGM, ETD, DM, IA, DL acquired the data. AR, DG, JJ, AP, LW, NMC analyzed and interpreted the data. DB, NMC and JHMP acquired funding, supervised the project, interpreted the data and drafted the manuscript. All authors have read and approved the final version of the manuscript.
Supplemental Material
Download Zip (6.2 MB)Acknowledgements
We wish to thank Ms. Christiane Bartling-Kirsch (DZNE) for her technical assistance.
Disclosure statement
No potential conflict of interest was reported by the author(s).
Data availability statement
The datasets supporting the conclusions of this article are available in the Gene Expression Omnibus (GEO) repository [GSE196482, https://www.ncbi.nlm.nih.gov/geo/query/acc.cgi?acc=GSE196482] and on the ProteomeXchange Consortium via the PRIDE partner repository [PXD030210, http://proteomecentral.proteomexchange.org/cgi/GetDataset?ID=PXD030210].
Additional information
Funding
References
- Neumann M. Frontotemporal lobar degeneration and amyotrophic lateral sclerosis: molecular similarities and differences. Rev Neurol. 2013;169:793–8.
- Ling S-C, Polymenidou M, Cleveland DW. Converging mechanisms in ALS and FTD: disrupted RNA and protein homeostasis. Neuron. 2013;79:416–38.
- van Blitterswijk M, DeJesus-Hernandez M, Rademakers R. How do C9ORF72 repeat expansions cause amyotrophic lateral sclerosis and frontotemporal dementia: can we learn from other noncoding repeat expansion disorders? Curr Opin Neurol. 2012; 25:689–700.
- Guerrero EN, Wang H, Mitra J, Hegde PM, Stowell SE, Liachko NF, et al. TDP-43/FUS in motor neuron disease: complexity and challenges. Prog Neurobiol. 2016;145–146:78–97.
- Hedl TJ, San Gil R, Cheng F, Rayner SL, Davidson JM, De Luca A, et al. Proteomics approaches for biomarker and drug target discovery in ALS and FTD. Front Neurosci. 2019;13:548.
- Deng J, Wang P, Chen X, Cheng H, Liu J, Fushimi K, et al. FUS interacts with ATP synthase beta subunit and induces mitochondrial unfolded protein response in cellular and animal models. Proc Natl Acad Sci U S A. 2018;115:E9678–E9686.
- Wang W, Li L, Lin W-L, Dickson DW, Petrucelli L, Zhang T, et al. The ALS disease-associated mutant TDP-43 impairs mitochondrial dynamics and function in motor neurons. Hum Mol Genet. 2013;22:4706–19.
- Wang W, Wang L, Lu J, Siedlak SL, Fujioka H, Liang J, et al. The inhibition of TDP-43 mitochondrial localization blocks its neuronal toxicity. Nat Med. 2016; 22:869–78.
- Tsai Y-L, Coady TH, Lu L, Zheng D, Alland I, Tian B, et al. ALS/FTD-associated protein FUS induces mitochondrial dysfunction by preferentially sequestering respiratory chain complex mRNAs. Genes Dev. 2020; 34:785–805.
- Lee S, Kim S, Kang H-Y, Lim HR, Kwon Y, Jo M, et al. The overexpression of TDP-43 in astrocytes causes neurodegeneration via a PTP1B-mediated inflammatory response. J Neuroinflammation. 2020; 17:299. Available from: https://doi.org/10.1186/s12974-020-01963-6
- Baek M, Choe Y-J, Bannwarth S, Kim J, Maitra S, Dorn GW, et al. TDP-43 and PINK1 mediate CHCHD10S59L mutation–induced defects in Drosophila and in vitro. Nat Commun. 2021;12:1924.
- Kawamata H, Peixoto P, Konrad C, Palomo G, Bredvik K, Gerges M, et al. Mutant TDP-43 does not impair mitochondrial bioenergetics in vitro and in vivo. Mol Neurodegener. 2017;12:37.
- Davis SA, Itaman S, Khalid-Janney CM, Sherard JA, Dowell JA, Cairns NJ, et al. TDP-43 interacts with mitochondrial proteins critical for mitophagy and mitochondrial dynamics. Neurosci Lett. 2018; 678:8–15.
- Onesto E, Colombrita C, Gumina V, Borghi MO, Dusi S, Doretti A, et al. Gene-specific mitochondria dysfunctions in human TARDBP and C9ORF72 fibroblasts. Acta Neuropathol Commun. 2016; 4:47.
- Vandoorne T, Veys K, Guo W, Sicart A, Vints K, Swijsen A, et al. Differentiation but not ALS mutations in FUS rewires motor neuron metabolism. Nat Commun. 2019;10:4147.
- Shelkovnikova TA, Peters OM, Deykin AV, Connor-Robson N, Robinson H, Ustyugov AA, et al. Fused in sarcoma (FUS) protein lacking nuclear localization signal (NLS) and major RNA binding motifs triggers proteinopathy and severe motor phenotype in transgenic mice. J Biol Chem. 2013;288:25266–74.
- Wegorzewska I, Bell S, Cairns NJ, Miller TM, Baloh RH. TDP-43 mutant transgenic mice develop features of ALS and frontotemporal lobar degeneration. Proc Natl Acad Sci U S A. 2009; 106:18809–14.
- Coughlan KS, Halang L, Woods I, Prehn JHM. A high-fat jelly diet restores bioenergetic balance and extends lifespan in the presence of motor dysfunction and lumbar spinal cord motor neuron loss in TDP-43A315T mutant C57BL6/J mice. Dis Model Mech. 2016; 9:1029–37.
- Hogg MC, Halang L, Woods I, Coughlan KS, Prehn JHM. Riluzole does not improve lifespan or motor function in three ALS mouse models. Amyotroph Lateral Scler Frontotemporal Degener. 2018;19:438–45.
- Funikov SY, Rezvykh AP, Mazin PV, Morozov AV, Maltsev AV, Chicheva MM, et al. FUS(1-359) transgenic mice as a model of ALS: pathophysiological and molecular aspects of the proteinopathy. Neurogenetics. 2018; 19:189–204.
- Ludolph AC, Bendotti C, Blaugrund E, Chio A, Greensmith L, Loeffler J-P, et al. Guidelines for preclinical animal research in ALS/MND: a consensus meeting. Amyotroph Lateral Scler. 2010;11:38–45.
- Wischhof L, Gioran A, Sonntag-Bensch D, Piazzesi A, Stork M, Nicotera P, et al. A disease-associated Aifm1 variant induces severe myopathy in knockin mice. Mol Metab. 2018;13:10–23.
- Lucantoni F, Salvucci M, Düssmann H, Lindner AU, Lambrechts D, Prehn JHM. BCL(X)L and BCL2 increase the metabolic fitness of breast cancer cells: a single-cell imaging study. Cell Death Differ. 2021; 28:1512–31.
- Farrell J, Kelly C, Rauch J, Kida K, García-Muñoz A, Monsefi N, et al. HGF induces epithelial-to-mesenchymal transition by modulating the mammalian hippo/MST2 and ISG15 pathways. J Proteome Res. 2014;13:2874–86.
- Ni M-W, Wang L, Chen W, Mou H-Z, Zhou J, Zheng Z-G. Modified filter-aided sample preparation (FASP) method increases peptide and protein identifications for shotgun proteomics. Rapid Commun Mass Spectrom. 2017;31:171–8.
- Wiśniewski JR, Zougman A, Mann M. Combination of FASP and stagetip-based fractionation allows in-depth analysis of the hippocampal membrane proteome. J Proteome Res. 2009;8:5674–8.
- Dobin A, Davis CA, Schlesinger F, Drenkow J, Zaleski C, Jha S, et al. STAR: ultrafast universal RNA-seq aligner. Bioinformatics. 2013;29:15–21.
- Li H, Handsaker B, Wysoker A, Fennell T, Ruan J, Homer N, et al. The sequence alignment/map format and SAMtools. Bioinformatics. 2009;25:2078–9.
- Anders S, Pyl PT, Huber W. HTSeq–a Python framework to work with high-throughput sequencing data. Bioinformatics. 2015;31:166–9.
- Robinson MD, McCarthy DJ, Smyth GK. edgeR: a bioconductor package for differential expression analysis of digital gene expression data. Bioinformatics. 2010;26:139–40.
- Tyanova S, Temu T, Sinitcyn P, Carlson A, Hein MY, Geiger T, et al. The Perseus computational platform for comprehensive analysis of (prote)omics data. Nat Methods. 2016;13:731–40.
- Krey JF, Wilmarth PA, Shin J-B, Klimek J, Sherman NE, Jeffery ED, et al. Accurate label-free protein quantitation with high- and low-resolution mass spectrometers. J Proteome Res. 2014;13:1034–44.
- Krey JF, Scheffer DI, Choi D, Reddy A, David LL, Corey DP, et al. Mass spectrometry quantitation of proteins from small pools of developing auditory and vestibular cells. Sci Data. 2018;5:180128.
- R Core Team. R: A Language and Environment for Statistical Computing. Vienna, Austria; 2013.
- Ritchie ME, Phipson B, Wu D, Hu Y, Law CW, Shi W, et al. Limma powers differential expression analyses for RNA-sequencing and microarray studies. Nucleic Acids Res. 2015;43:e47–e47.
- Smyth GK, Michaud J, Scott HS. Use of within-array replicate spots for assessing differential expression in microarray experiments. Bioinformatics. 2005;21:2067–75.
- Yu G, Wang L-G, Han Y, He Q-Y. clusterProfiler: an R package for comparing biological themes among gene clusters. Omics. 2012; 16:284–7.
- Alexa A, Rahnenführer J, Lengauer T. Improved scoring of functional groups from gene expression data by decorrelating GO graph structure. Bioinformatics. 2006;22:1600–7.
- Carro MS, Lim WK, Alvarez MJ, Bollo RJ, Zhao X, Snyder EY, et al. The transcriptional network for mesenchymal transformation of brain tumours. Nature 2010;463:318–25.
- Lefebvre C, Rajbhandari P, Alvarez MJ, Bandaru P, Lim WK, Sato M, et al. A human B-cell interactome identifies MYB and FOXM1 as master regulators of proliferation in germinal centers. Mol Syst Biol. 2010;6:377.
- Ikiz B, Alvarez MJ, Ré DB, Le Verche V, Politi K, Lotti F, et al. The regulatory machinery of neurodegeneration in in vitro models of amyotrophic lateral sclerosis. Cell Rep. 2015;12:335–45.
- Brichta L, Shin W, Jackson-Lewis V, Blesa J, Yap E-L, Walker Z, et al. Identification of neurodegenerative factors using translatome-regulatory network analysis. Nat Neurosci. 2015;18:1325–33.
- Khan A, Fornes O, Stigliani A, Gheorghe M, Castro-Mondragon JA, van der Lee R, et al. JASPAR 2018: update of the open-access database of transcription factor binding profiles and its web framework. Nucleic Acids Res. 2018;46:D260–D266.
- Kuleshov MV, Jones MR, Rouillard AD, Fernandez NF, Duan Q, Wang Z, et al. Enrichr: a comprehensive gene set enrichment analysis web server 2016 update. Nucleic Acids Res. 2016;44:W90–W97.
- Chen EY, Tan CM, Kou Y, Duan Q, Wang Z, Meirelles GV, et al. Enrichr: interactive and collaborative HTML5 gene list enrichment analysis tool. BMC Bioinformatics. 2013;14:128.
- Keenan AB, Torre D, Lachmann A, Leong AK, Wojciechowicz ML, Utti V, et al. ChEA3: transcription factor enrichment analysis by orthogonal omics integration. Nucleic Acids Res. 2019;47:W212–W224.
- Menden K, Marouf M, Oller S, Dalmia A, Magruder DS, Kloiber K, et al. Deep learning-based cell composition analysis from tissue expression profiles. Sci Adv. 2020;6:eaba2619.
- Kwong LK, Neumann M, Sampathu DM, Lee VM-Y, Trojanowski JQ. TDP-43 proteinopathy: the neuropathology underlying major forms of sporadic and familial frontotemporal lobar degeneration and motor neuron disease. Acta Neuropathol. 2007;114:63–70.
- Crivello M, Hogg MC, Jirström E, Halang L, Woods I, Rayner M, et al. Vascular regression precedes motor neuron loss in the FUS (1-359) ALS mouse model. Dis Model Mech. 2019;12(8).
- Vahsen N, Candé C, Brière J-J, Bénit P, Joza N, Larochette N, et al. AIF deficiency compromises oxidative phosphorylation. Embo J. 2004;23:4679–89.
- Vafai SB, Mootha VK. Mitochondrial disorders as windows into an ancient organelle. Nature 2012;491:374–83.
- Zeviani M, Di Donato S. Mitochondrial disorders. Brain. 2004;127:2153–72.
- DiMauro S, Schon EA, Carelli V, Hirano M. The clinical maze of mitochondrial neurology. Nat Rev Neurol. 2013;9:429–44.
- Koopman WJH, Distelmaier F, Smeitink JAM, Willems PHGM. OXPHOS mutations and neurodegeneration. Embo J. 2013;32(1):9–29.
- Koopman WJH, Willems PHGM, Smeitink JAM. Monogenic mitochondrial disorders. N Engl J Med. 2012;366:1132–41.
- El Ghouzzi V, Csaba Z, Olivier P, Lelouvier B, Schwendimann L, Dournaud P, et al. Apoptosis-inducing factor deficiency induces early mitochondrial degeneration in brain followed by progressive multifocal neuropathology. J Neuropathol Exp Neurol. 2007; 66:838–47.
- Bénit P, Pelhaître A, Saunier E, Bortoli S, Coulibaly A, Rak M, et al. Paradoxical inhibition of glycolysis by pioglitazone opposes the mitochondriopathy caused by AIF deficiency. EBioMedicine 2017;17:75–87.
- Bénit P, Goncalves S, Dassa EP, Brière J-J, Rustin P. The variability of the harlequin mouse phenotype resembles that of human mitochondrial-complex I-deficiency syndromes. PLOS One. 2008;3:e3208.
- Hintze M, Griesing S, Michels M, Blanck B, Wischhof L, Hartmann D, et al. Alopecia in Harlequin mutant mice is associated with reduced AIF protein levels and expression of retroviral elements. Mamm Genome. 2021;32:12–29.
- Klein JA, Longo-Guess CM, Rossmann MP, Seburn KL, Hurd RE, Frankel WN, et al. The harlequin mouse mutation downregulates apoptosis-inducing factor. Nature 2002;419:367–74.
- Pascovici D, Handler DCL, Wu JX, Haynes PA. Multiple testing corrections in quantitative proteomics: a useful but blunt tool. Proteomics 2016;16:2448–53.
- Coady TH, Manley JL. ALS mutations in TLS/FUS disrupt target gene expression. Genes Dev. 2015;29:1696–706.
- Padanad MS, Konstantinidou G, Venkateswaran N, Melegari M, Rindhe S, Mitsche M, et al. Fatty acid oxidation mediated by Acyl-CoA synthetase long chain 3 is required for mutant KRAS lung tumorigenesis. Cell Rep. 2016; 16:1614–28.
- Fujimoto Y, Itabe H, Kinoshita T, Homma KJ, Onoduka J, Mori M, et al. Involvement of ACSL in local synthesis of neutral lipids in cytoplasmic lipid droplets in human hepatocyte HuH7. J Lipid Res. 2007; 48:1280–92.
- Pennetta G, Welte MA. Emerging links between lipid droplets and motor neuron diseases. Dev Cell. 2018;45:427–32.
- Fujino T, Kang M-J, Suzuki H, Iijima H, Yamamoto T. Molecular characterization and expression of rat acyl-CoA synthetase 3. J Biol Chem. 1996;271:16748–52.
- Zeidán-Chuliá F, de Oliveira B-HN, Salmina AB, Casanova MF, Gelain DP, Noda M, et al. Altered expression of Alzheimer’s disease-related genes in the cerebellum of autistic patients: a model for disrupted brain connectome and therapy. Cell Death Dis. 2014;5(5):e1250–e1250.
- Alston CL, Heidler J, Dibley MG, Kremer LS, Taylor LS, Fratter C, et al. Bi-allelic mutations in NDUFA6 establish its role in early-onset isolated mitochondrial complex I deficiency. Am J Hum Genet. 2018;103:592–601.
- Murray J, Taylor SW, Zhang B, Ghosh SS, Capaldi RA. Oxidative damage to mitochondrial complex I due to peroxynitrite: identification of reactive tyrosines by mass spectrometry. J Biol Chem. 2003;278:37223–30.
- Grünewald A, Rygiel KA, Hepplewhite PD, Morris CM, Picard M, Turnbull DM. Mitochondrial DNA depletion in respiratory chain-deficient parkinson disease neurons. Ann Neurol. 2016;79:366–78.
- Adav SS, Park JE, Sze SK. Quantitative profiling brain proteomes revealed mitochondrial dysfunction in Alzheimer’s disease. Mol Brain. 2019; Jan12:8.
- Napoli E, Wong S, Hung C, Ross-Inta C, Bomdica P, Giulivi C. Defective mitochondrial disulfide relay system, altered mitochondrial morphology and function in Huntington’s disease. Hum Mol Genet. 2013;22:989–1004.
- Borowski LS, Dziembowski A, Hejnowicz MS, Stepien PP, Szczesny RJ. Human mitochondrial RNA decay mediated by PNPase-hSuv3 complex takes place in distinct foci. Nucleic Acids Res. 2013;41:1223–40.
- Riley LG, Cooper S, Hickey P, Rudinger-Thirion J, McKenzie M, Compton A, et al. Mutation of the mitochondrial tyrosyl-tRNA synthetase gene, YARS2, causes myopathy, lactic acidosis, and sideroblastic anemia–MLASA syndrome. Am J Hum Genet. 2010;87:52–9.
- Riley LG, Heeney MM, Rudinger-Thirion J, Frugier M, Campagna DR, Zhou R, et al. The phenotypic spectrum of germline YARS2 variants: from isolated sideroblastic anemia to mitochondrial myopathy, lactic acidosis and sideroblastic anemia 2. Haematologica 2018;103:2008–15.
- Shahni R, Wedatilake Y, Cleary MA, Lindley KJ, Sibson KR, Rahman S. A distinct mitochondrial myopathy, lactic acidosis and sideroblastic anemia (MLASA) phenotype associates with YARS2 mutations. Am J Med Genet. 2013;161:A2334–8.
- Riley LG, Menezes MJ, Rudinger-Thirion J, Duff R, de Lonlay P, Rotig A, et al. Phenotypic variability and identification of novel YARS2 mutations in YARS2 mitochondrial myopathy, lactic acidosis and sideroblastic anaemia. Orphanet J Rare Dis. 2013;8:193.
- Sommerville EW, Ng YS, Alston CL, Dallabona C, Gilberti M, He L, et al. Clinical features, molecular heterogeneity, and prognostic implications in YARS2-related mitochondrial myopathy. JAMA Neurol. 2017; 74:686–94.
- Meyer-Schuman R, Antonellis A. Emerging mechanisms of aminoacyl-tRNA synthetase mutations in recessive and dominant human disease. Hum Mol Genet. 2017; 26:R114–R127.
- Dittmar KA, Goodenbour JM, Pan T. Tissue-specific differences in human transfer RNA expression. PLOS Genet. 2006; 2:e221.
- Sansa A, Miralles MP, Beltran M, Celma-Nos F, Calderó J, Garcera A, et al. ERK MAPK signaling pathway inhibition as a potential target to prevent autophagy alterations in spinal muscular atrophy motoneurons. Cell Death Discov. 2023;9:113.
- Watts ME, Wu C, Rubin LL. Suppression of MAP4K4 signaling ameliorates motor neuron degeneration in amyotrophic lateral sclerosis-molecular studies toward new therapeutics. J Exp Neurosci. 2019;13:1179069519862798.
- Isopi E, Granzotto A, Corona C, Bomba M, Ciavardelli D, Curcio M, et al. Pyruvate prevents the development of age-dependent cognitive deficits in a mouse model of Alzheimer’s disease without reducing amyloid and tau pathology. Neurobiol Dis. 2015;81:214–24.
- Connolly NMC, Theurey P, Adam-Vizi V, Bazan NG, Bernardi P, Bolaños JP, et al. Guidelines on experimental methods to assess mitochondrial dysfunction in cellular models of neurodegenerative diseases. Cell Death Differ. 2018;25:542–72.
- Saavedra-García P, Roman-Trufero M, Al-Sadah HA, Blighe K, López-Jiménez E, Christoforou M, et al. Systems level profiling of chemotherapy-induced stress resolution in cancer cells reveals druggable trade-offs. Proc Natl Acad Sci U S A 2021;118(17):e2018229118.
- Bailey AP, Koster G, Guillermier C, Hirst EMA, MacRae JI, Lechene CP, et al. Antioxidant role for lipid droplets in a stem cell niche of Drosophila. Cell 2015;163:340–53.
- Li N, Sancak Y, Frasor J, Atilla-Gokcumen GE. A protective role for triacylglycerols during apoptosis. Biochemistry [Internet]. 2018; 57:72–80. Available from: https://doi.org/10.1021/acs.biochem.7b00975
- Liu L, Zhang K, Sandoval H, Yamamoto S, Jaiswal M, Sanz E, et al. Glial lipid droplets and ROS induced by mitochondrial defects promote neurodegeneration. Cell [Internet]. 2015; 160:177–90. Available from: https://linkinghub.elsevier.com/retrieve/pii/S009286741401589X
- Kassan A, Herms A, Fernández-Vidal A, Bosch M, Schieber NL, Reddy BJN, et al. Acyl-CoA synthetase 3 promotes lipid droplet biogenesis in ER microdomains. J Cell Biol. 2013;203:985–1001. Available from: https://rupress.org/jcb/article/203/6/985/37677/AcylCoA-synthetase-3-promotes-lipid-droplet
- Sanhueza M, Chai A, Smith C, McCray BA, Simpson TI, Taylor JP, et al. Network analyses reveal novel aspects of ALS pathogenesis. PLOS Genet. 2015;11:e1005107.
- de Aguilar J-LG, Dupuis L, Oudart H, Loeffler J-P. The metabolic hypothesis in amyotrophic lateral sclerosis: insights from mutant Cu/Zn-superoxide dismutase mice. Biomed Pharmacother. 2005;59:190–6.
- Carreño-Gago L, Juárez-Flores DL, Grau JM, Ramón J, Lozano E, Vila-Julià F, et al. Two novel variants in YARS2 gene are responsible for an extended MLASA phenotype with pancreatic insufficiency. J Clin Med 2021; 10:3471. Available from: https://www.mdpi.com/2077-0383/10/16/3471
- Jin X, Zhang Z, Nie Z, Wang C, Meng F, Yi Q, et al. An animal model for mitochondrial tyrosyl-tRNA synthetase deficiency reveals links between oxidative phosphorylation and retinal function. J Biol Chem. 2021; 296:100437.
- Kanehisa M, Sato Y, Kawashima M, Furumichi M, Tanabe M. KEGG as a reference resource for gene and protein annotation. Nucleic Acids Res. 2016;44:D457–D462.