
 ?Mathematical formulae have been encoded as MathML and are displayed in this HTML version using MathJax in order to improve their display. Uncheck the box to turn MathJax off. This feature requires Javascript. Click on a formula to zoom.
Abstract
Several reasons underlie the use of Contractor Full Pre-Financed (CPF), which provides a much higher return opportunity than a standard payment contract system or the Monthly Certificate (MC). The case study in this research is one of the toll road construction projects in Indonesia that uses the CPF scheme. This study uses qualitative risk analysis to determine the dominant risk, quantitative risk analysis using the PERT distribution method to measure the impact of adding days due to the dominant risk on the critical path and produce a strategy to reduce the added days value due to risks in toll road projects with the CPF scheme. Strategy development is carried out to reduce the value of inherent risk to become a residual risk. The potential value of additional project completion time due to dominant risk is 30.68%–38.33% of the initial duration of the project. Through the development of strategies for each critical path activity, the potential added value of project completion time due to dominant risk can be reduced to 11.45%–16.73% of the initial project duration.
Reviewing Editor:
1. Introduction
Transportation infrastructure such as toll roads is an economic infrastructure that is used for activities in the economic sector, the use of large capital in large investments is required in infrastructure development (Grimsey & Lewis, Citation2002). The government’s efforts continue to be made in realizing increased connectivity without obstacles in the form of connected toll roads (Badan Pengatur Jalan Tol, Citation2021b). The construction of the toll road has had a major impact on increasing connectivity between regions, connecting distribution areas and production areas, accelerating added value to the economy (Badan Pengatur Jalan Tol, Citation2021b). From 2015 to November 2020, the government and business entities have operated 1545 kilometers (km) of toll roads. Among these road lengths, there are 10 toll road sections which will be inaugurated in 2020 with a total length of 246.13 km. The toll road development target for 2020–2024 stretches across Indonesia with a total length of 2724 km (Badan Pengatur Jalan Tol, Citation2021a).
The implementation of the project is expected to achieve within the time, cost and quality performance that has been determined. Establishing a system with a Contractor Full Pre-Financing Contract has risks that may affect the achievement of time, cost and quality performance. Major impacts that may occur such as failure in project implementation, problems with project funding, non-fulfillment of predetermined business targets so that it is not financially feasible (Winarsa, Citation2005). In particular, the increase in time and cost in Infrastructure projects appears to be a global phenomenon, ie without a decrease in the last 70 years and the average cost exceeds 28% (Larsen et al., Citation2016). Project delays have had a negative impact on road infrastructure development in developing countries. For road construction projects, timely project completion is a critical success factor (Aziz & Abdel-Hakam, Citation2016), but project delays are still a common problem. Unfavorable consequences of project delays involve cost overruns, contract disputes, arbitrations, and quality discrepancies (Mejía et al., Citation2020).
In toll road projects, delays cause several impacts, including national impacts, company impacts, and impacts on the project itself. The impact on a national basis is both National Issues, declining government image, and not achieving government targets (National Strategic Projects). Impact on the Company in the form of Cost Overrun, Dispute, reduced net income. The impact on the project is in the form of delays in construction implementation, additional time and project overhead costs. In Indonesia, there have been several cases of delays in toll road construction projects. Based on the author’s processed results from the monitoring data of the Toll Road Regulatory Agency in July 2021, there have been several construction delays in the construction of the Transjaawa, Non-Transjawa, Jabodetabek and Trans Sumatra toll roads. There were several delays in toll road projects during the construction phase, including on the TransJava section 20% toll section, on non-TransJava sections 33% toll section, on the Jabodetabek section 76% toll section, and on the Trans Sumatran section 57% toll section.
The use of the Contractor Pre Financing (CPF) scheme is attractive to some contractors rather than using a contract with a standard scheme. Several reasons underlying the use of CPF provide a much higher return opportunity compared to using a standard payment contract system or in this case the Monthly Certificate (MC) (Indopremier, Citation2017). Contractors take jobs with standard payment contracts, so the potential margin that can be obtained is ±10%, whereas if you use the CPF scheme or a turn key project, the potential margin that you can get can be above ±15% (Indopremier, Citation2017). Therefore, it is important for Contractors to have a strategy in carrying out construction work with CPF contracts. A risk-based strategy that is able to accommodate strategic policies for both the company and the project itself. The contractor must accept all major risks so that the contractor must be able to have good risk management. The contractor must also be able to develop a delay risk analysis schedule in its implementation to determine the strategic steps of the project. Only a few studies have used toll road projects with the CPF scheme as their research subject, and the majority of those that have mostly used either a qualitative or a quantitative approach to risk assessment. This study will attempt to evaluate qualitative and quantitative risk in that order so that it can calculate the additional time that the case study project’s critical path requires as an effect of dominant risk. A risk-based strategy is also produced by this study that was not in previous research. Although this risk-based strategy is actually required by planners in order to carry on CPF scheme toll road development projects.
The purpose of this research:
Identify the factors that cause time performance in toll road construction projects with the Contractor Full Pre-Financed scheme.
Identify the dominant risk factors in toll road construction projects with a Contractor Full Pre-Financed scheme that have an impact on time performance.
Measuring the magnitude of the estimated impact of the additional time on toll road construction projects with the Contractor Full Pre-Financed contract scheme.
Developing a risk based strategy to anticipate dominant risks in toll road construction projects with a Full Pre-Financed Contractor scheme so as to improve project time performance.
2. Literature review
2.1. Contractor’s full pre-finance
The contract form of full pre-financing by the contractor (contractor’s full prefinance) is a form of construction contract in which the costs of carrying out the work are entirely borne by the contractor in advance, therefore the project owner is required to submit a bank guarantee as payment guarantee (Kementerian Pekerjaan Umum dan Perumahan Rakyat, Citation2016).
After all the work is 100% completed and well received by the service user, the service provider gets paid at once and at that time the service user can pay 95% of the contract value, while 5% is retained (retention money) congratulations on defects or full payment 100%, but the service provider needs to provide a guarantee for the period of responsibility for defects or other things that occur according to the contract.
2.2. PERT analysis
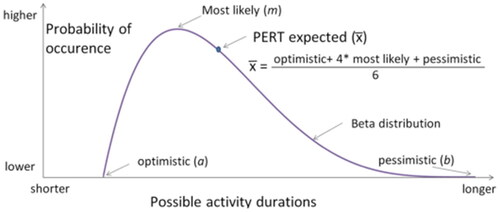
PERT analysis (PERT analysis) is an analysis technique whose working time is probability and is widely used for project planning and control. The PERT method uses three time estimates for each project activity, namely the longest time to work (pessimistic), the optimal time to work and the fastest time to work (optimistic)(Mariana & Wijaksono, Citation2021). In a PERT network, activity duration is determined by stochastic variables which are assumed to be independent of one another. The distribution of activity duration follows what is called the PERT-beta distribution. The beta function formula is shown below (EquationEquation (1)(1)
(1) ). In the formula, α and β are parameters of the beta distribution; while a and b are the endpoints of the x domain. Outside the interval, f(x) = 0. The distribution is identified as PERT beta if the parameters α and β of EquationEquation (1)
(1)
(1) are greater than 1 (α > 1 and β > 1), ensuring that f(x) has one maximum, and f(x) tends to zero at the domain endpoints f(a) = f(b) = 0 ().
(1)
(1)
Figure 1. Typical density function of the PERT-beta distribution. Source: Hajdu and Bokor (Citation2016).
The mean (x) and variance (σx2) of activity duration in PERT are determined according to EquationEquations (2)(2)
(2) and (3), respectively:
(2)
(2)
(3)
(3)
where a, m and b are subjective values, determined by a specialist, representing optimistic (a), most likely (m) and pessimistic (b) activity durations (). The process of defining this subjective value is called the PERT three-point estimation method.
The main objective of PERT analysis is to create a distribution of project durations. According to PERT theory, project durations follow a normal distribution, with the mean being the result of a time analysis based on the average activity duration (x) and the variance equal to
(4)
(4)
where σPD2 is the variance of the project duration (PD) distribution and x represents activities on the critical path (CP). This calculation is based on the central limit theorem of mathematical statistics. The theoretical optimistic and pessimistic project duration, namely the lower and upper limits of the project duration distribution can be defined as the results of a time analysis carried out with optimistic and pessimistic values respectively (Hajdu & Bokor, Citation2016).
2.3. Application of PERT analysis in construction projects
The PERT method was developed by many researchers and practitioners to investigate the practicality of other methods based on probability distributions over the duration of each project activity. PERT is one of the evaluations by reviewing activity-on-arrow network that show dependency relationships between activities, in this way it can describe logical dependencies between activities that occur (Hajdu, Citation2013). PERT is one way that planners can do by considering the time and cost needed to produce an estimate of project duration with a certain level of confidence. From a practical standpoint, using various activity duration distributions does not result in noticeably different results (Hajdu & Bokor, Citation2016). The distribution of project durations is significantly more influenced by the three-point estimate’s accuracy (Hajdu & Bokor, Citation2016). For any practical size project, computer simulation is the only reasonable approach to study the impact of variable activity durations on other activities and overall project duration (Lawrence, Citation2001). In the following, there are several developments and applications of the Pert method in construction projects which are discussed in several other studies ().
Table 1. Application of PERT analysis in construction projects.
Table 2. Problem formulation in research strategy.
Table 3. Validated risk factor.
2.4. Inherent and residual risk
Inherent risk is raw or untreated risk that produces a series of possible outcomes, without control (Monahan, Citation2008). Internal control factors are not considered in determining inherent risk because they are treated separately as control risk in the examination risk model (Ikhtiari et al., Citation2021). While residual risk is an inherent risk that has been mitigated by controls which are the vehicles used by the company’s risk management office to mitigate inherent risk. In the absence of controls, the residual risk equals the inherent risk. More generally, we can express the relationship as:
3. Research method
3.1. Research strategy ()
3.2. Research process
Research Instrument and Data Collection Stage 1: Expert Validation
This instrument is designed to confirm the causal risk impact on time performance on highway work with the CPF scheme. This stage is carried out to determine whether the identified risk factors influence time performance. The authors validated with 5 experts with the criteria of having experience as a project manager or equivalent to a minimum of 10 years experience int Toll Road Project and the last minimum education was Bachelor degree.
Research Instrument and Data Collection Stage 2: Analysis of Archival and Historical Data
At this stage, it is required to obtain toll road project schedule data with the CPF scheme which is used as a case study. Furthermore, to be able to determine the critical path of existing activities in the toll road project schedule with CPF husks which is used as a case study. The data criteria needed are toll road projects with CPF scheme contracts and are still under construction. At this data collection stage, it is necessary to obtain toll road project schedule data with the CPF scheme which is used as a case study. Phase 3 data collection requires the results of critical path analysis so that it can determine the dominant risk and quantitative impact on each critical path activity. At stage 4 data collection will require the results of critical path analysis so that it can determine the strategy for each critical path activity that is affected by the dominant risk.
Research Instrument and Data Collection Stage 3: Focus Group Discussion (FGD)
At this stage, it is designed to collect qualitative risk data. The reason for using FGD at this stage is the need to generate a discussion about the risks that occur in the research topic and the meanings that lie behind those views (including their experiences and beliefs) (Asmamaw et al., Citation2011). Focus group discussions, as opposed to more traditional methods like individual interviews and surveys, give participants the chance to debate topics that are either poorly understood or the subject of little prior research (Nyumba et al., Citation2018). FGDs were utilized in this study not only to gather qualitative data, but also to gather quantitative data. In this study, researchers also used FGDs as a quantitative data collecting method even though they were often used as a qualitative data collection tool. The FGDs used were mixed-system FGDs. Discussion groups with researchers determine the risks that impact each activity on the critical path of the project that is used as a case study. The discussion group with the researchers filled in the data in the form of the probability of each risk impacting the critical path activity of the project case study. The number of FGD participants is 5 participants with with the condition that the participants included in this study were experts in the practitioner’s field; Has a minimum of 10 years working experience in toll road project and holds a managerial/board of directors’ position in a construction company, and the last minimum education was Bachelor degree. Each risk variable that has been validated in phase 1 data collection is then followed by the FGD participants assessing each risk that impacts each activity on the critical path.
Research Instrument and Data Collection Stage 4: Focus Group Discussion
At this stage, FGD were carried out with experts regarding the causes, impacts, preventive actions, corrective actions and assessing the impact of the risk of additional days remaining due to dominant risk factors in each critical path activity of the CPF toll road project. The reason for using the FGD at this stage is because it wants to produce data continuity with the qualitative assessment process at the previous stage which was carried out with the FGD. First, the FGD participants can fill in the possible causes and impacts of each dominant risk in each activity on the critical path, then experts determine preventive actions to prevent dominant risk causes from occurring in critical path activities and corrective actions to reduce the impact of dominant risks on critical path activities. case study project. Experts can determine the risk response of each preventive action and corrective action for each dominant risk that occurs in the critical path of the case study project.
4. Results
4.1. Variables and indicators causing time performance in a toll road construction project with a Contractor Full Pre-Financed contract scheme ()
Of the 24 risks that were validated, the results showed that 20 risks were selected that had an impact on time performance for toll road projects with the CPF scheme. There are 4 variables that are not validated as risks that affect time performance. From these results, the variables that are not selected at least 3 experts will be eliminated. There are 6 risk categories out of 24 risks, namely financial risk, external risk, design risk, management risk, technical risk and contractual risk.
The author divides the risk category into 6 categories, including financial risk according to the author’s literature studies (Aziz & Abdel-Hakam, Citation2016; Choudhry, Citation2019; Hossen et al., Citation2015; Larsen et al., Citation2016; Mejía et al., Citation2020). External risk according to the author’s literature studies (Ariyanto et al., Citation2020; Choudhry, Citation2019; Mahamid et al., Citation2012; Mejía et al., Citation2020; Larsen et al., Citation2016; Rivera et al., Citation2020). Design risk is in accordance with the authors’ literature studies (Aziz & Abdel-Hakam, Citation2016; Choudhry, Citation2019; Mahamid et al., Citation2012; Mejía et al., Citation2020). Risk management is according to the authors’ literature studies (Choudhry, Citation2019; Larsen et al., Citation2016; Mejía et al., Citation2020). Technical risks which include tools, materials, and scheduling according to the author’s literature studies (Aziz & Abdel-Hakam, Citation2016; Larsen et al., Citation2016; Mahamid et al., Citation2012; Mejía et al., Citation2020). Contractual risk is in accordance with the authors’ literature studies (Aziz & Abdel-Hakam, Citation2016; Choudhry, Citation2019; Jia Yau & Bin Yang, Citation2012; Larsen et al., Citation2016; Mejía et al., Citation2020).
This study discusses financial risk as one of the risks that affect time performance including contractor liquidity problems, losses due to fluctuations in interest rates, and sub-contractor liquidity problems. Liquidity problems are a financial risk that results in the unavailability of funds to start work, according to Larsen et al. (Citation2016), the problem of lack of funds in projects causes poor time, cost and quality performance in public construction projects. In several studies from (Ariyanto et al., Citation2020; Aziz & Abdel-Hakam, Citation2016; Koulinas et al., Citation2020; Nurwahyudo, Citation2021; Vu et al., Citation2017) also said that the risk variable financial and fiscal capabilities as one of the risks that impact project performance, especially time.
4.2. Dominant risk indicators in toll road construction projects with a Contractor Full Pre-Financed scheme that have an impact on time performance
The critical path consists of an integrated network consisting of a series of activities with one another intended to obtain maximum work efficiency. The critical path also concentrates on the most important tasks the project can confirm on time and according to a predetermined schedule (Atin & Lubis, Citation2019). The Critical Path method is a method that uses an activity diagram network to determine the critical path used to estimate activity duration (Zakia & Febrianti, Citation2021). With this method you can find out the estimated completion of the project by finding the critical path of the project activity net, identifying the start and finish times of each activity, and calculating the free slack and total slack of each activity (Zakia & Febrianti, Citation2021). Slack is some flexibility and time on a network of activities. There are two types of Slack, namely Total Slack and Free Slack. An activity in the project will be said to be a critical path when it has Total Slack = Free Slack = 0 ( and ).
Table 4. Critical path of a case study project.
Table 5. Qualitative risk analysis results: dominant risk in critical path activities.
Risk determination is based on data from the occurrence of risk events that have a high probability and have a very large impact on activities. 17 risks that are not selected as dominant risks/high risks do not mean that these risks do not occur but that these risks have a small probability and have a smaller impact on activities on the project’s critical path which is a case study. Of course, the different project characteristics and scope of the critical path analyzed will determine the dominant risk that occurs. Based on data, the results of a qualitative risk analysis on risks that have an impact on time performance. This analysis shows the impact of risk on each activity on the critical path. Of the risks that have been validated, only a few are included in the dominant risk category in the qualitative risk analysis and have a significant impact on increasing the time on the critical path.
Financial problems are a critical issue in the implementation of construction projects because contractor liquidity greatly influences the successful completion of projects (J. I. Lee et al., Citation2018). Conditions in which the contractor company’s ability is unable to meet its obligations when they are due in a timely manner so that it has an impact on project work. Contractor liquidity is one of the most important pieces of information when analyzing a contractor company’s financial capabilities related to financial assets with short-term liabilities of the company itself (Penttinen et al., Citation2011).
According (J. I. Lee et al., Citation2018) problems related to the finances of contractor companies, sub-contractors and/or vendors can cause managerial problems. Liquidity problems can arise due to a company’s earnings crisis and affect the company’s balance sheet. According to J. I. Lee et al. (Citation2018) project owners will face many problems due to the influence of contractor liquidity and very limited efforts to solve these problems. Contractors will face potential payment difficulties if they do not calculate cash flows and do not analyze financial liquidity for certain work contracts. Negotiating payment terms with sub-contractors and/or vendors can greatly affect the contractor’s financial liquidity (Anysz & Rogala, Citation2019). Contractor liquidity has negative consequences in projects and causes delays in project completion (Alashwal & Al-Sabahi, Citation2019). In addition, the liquidity of sub-contractors and/or vendors also plays an important role in project completion. Many sub-contractors pay little attention to the financial aspects of the business (Ross et al., Citation2013). According to Schaufelberger (Citation2004), the highest level of bankruptcy occurs in special contractors who run their business as sub-contractors. The financial status of sub-contractors and/or vendors greatly influences the company’s performance in the field as sub-contractors and/or vendors.
4.3. The impact of additional time due to risk on toll road construction projects case study with a full pre-financed contractor contract scheme
In Quantitative Risk Analysis, this study uses The Program Evaluation and Review Technique (PERT) method to determine the magnitude of the impact of adding days to activities on the critical path of the case study project. By using PERT activity duration is defined as a form of stochastic variables which are assumed to be independent of other variables. This method considers 3 values, namely the most optimistic value (O), the most likely value (M), and the pessimistic value (P). Changing the estimated results from PERT requires a conversion of the confidence level (α). In this study used confidence levels (α) of 80%, 90%, and 95% ().
Table 6. Quantitative analysis inherent risk using with the PERT distribution method.
The estimated value at each level of confidence has a different estimated time value. This study also divides the confidence level (α) based on theoretical value and simulation value. In principle, the theoretical value produces a value according to the calculation of the number formula from PERT, while the simulation value is calculated based on the number of model iterations carried out. The number of iterations used in this study is 10,000 iterations. Iteration is a method of recalculating the model during a simulation program, a single simulation consisting of many iterations. The number of iterations is not a way to determine whether a distribution model is better or not, the number of iterations will increase the length of time needed to complete the simulation, and after the distribution reaches convergence, additional iterations are no longer needed. Some determination of the number of iterations and the confidence level (α) using a similar distribution model ( and ).
Table 7. Number of model iterations and confidence level in several other studies.
Table 8. The PERT distribution model in a case study project with inherent risk.
4.4. Development of a project strategy to anticipate dominant risks in toll road construction projects with a Contractor Full Pre-Financed (CPF) scheme so as to improve project time performance
In this FGD process, an analysis of the causes and impacts of each dominant risk was carried out in the critical path activities of the case study project. Cause and impact analysis is carried out to find out the root causes and impacts arising from each dominant risk factor in each critical path activity of the case study project and how the risk response is. Cause and impact analysis was carried out by tabulating and coding for each of the causes, preventive actions, impacts and corrective actions obtained from expert questionnaires through FGDs ().
Figure 2. Results of the strategy development FGD in the case study Project-1. Source: Author Processed Results, 2022.
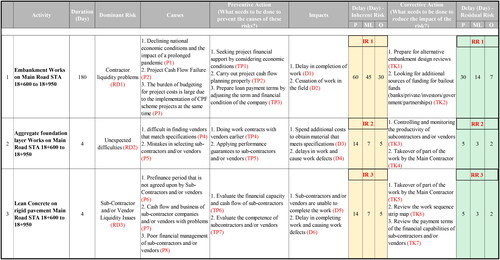
Figure 3. Results of the strategy development FGD in the case study Project-2. Source: Author Processed Results, 2022.
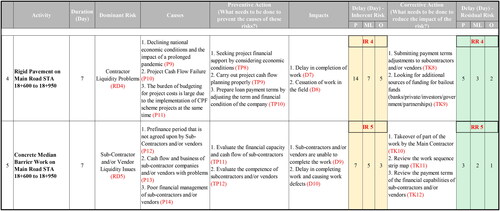
Figure 4. Risk Strategy Model on Main Road STA 18 + 600 to 18 + 950.
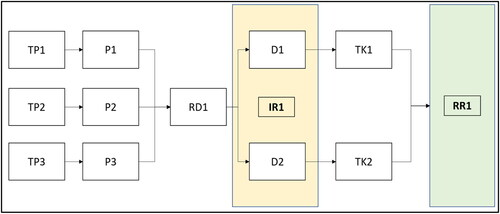
4.5. Embankment work ()
Figure 5. Risk Strategy Model on Main Road STA 18 + 600 to 18 + 950.
4.6. Aggregate foundation layer work ()
Figure 6. Risk Strategy Model on Main Road STA 18 + 600 to 18 + 950.
4.7. Lean concrete work ()
Figure 7. Risk Strategy Model on Main Road STA 18 + 600 to 18 + 950.
4.8. Rigid pavement work ()
Figure 8. Risk Strategy Model on Main Road STA 18 + 600 to 18 + 950.
4.9. Concrete median barrier work
Based on the table above, it is known that the value of the inherent risk reduction level becomes different residual risks (). This is influenced by the type of activity, initial duration value, dominant risk, and corrective actions used as a strategy to reduce this value. However, from the table above it can be seen that at least the corrective actions taken are able to reduce the value of inherent risk in each critical path activity. Furthermore, after knowing the residual risk value in each critical path activity, quantitative analysis can then be carried out on the residual risk value to determine the impact of adding time after carrying out the risk management strategy. In the Quantitative Risk Analysis on the residual risk value using The Program Evaluation and Review Technique (PERT) method to determine the magnitude of the impact of adding days after carrying out the risk mitigation strategy on activities on the critical path of the case study project. In this risk value analysis, the same level of confidence and the number of iterations used is the same as the analysis on the inherent risk value prior to the existence of a risk mitigation strategy for each critical path activity. Following are the results of quantitative risk analysis on residual risk values ( and ).
Table 9. Change of inherent risk value to residual risk value (days delay) after implementing the strategy on the critical path due to dominant risk.
Table 10. Quantitative analysis residual risk using with the PERT distribution method .
Table 11. The PERT distribution model in a case study project with residual risk.
From the results of data analysis in stage 4, it can be seen that the mapping of strategies that can be carried out in an effort to improve the time performance of the case study project. The strategy is formed based on the relationship between preventive actions, causes, dominant risks, and corrective actions. According to Rizka (Citation2021) a cause and impact analysis can be carried out to find out the root causes and impacts that may occur on each dominant risk factor. With corrective actions, it can reduce the inherent risk value to residual risk value and have an impact on reducing the additional time on the project due to dominant risk. In the Theoretical Value schedule model (Confidence Level 80%), it shows the rate of adding days to project completion time to the initial duration of 34.72%, through the strategy developed it has succeeded in reducing the rate of adding days to project completion time to the initial duration to 14.06%. In the Theoretical Value schedule model (Confidence Level 90%), it shows the rate of adding days to project completion time to the initial duration of 36.78%, through the strategy developed it has succeeded in reducing the rate of adding days to project completion time to the initial duration to 15.57%. In the Theoretical Value schedule model (Confidence Level 95%) shows the rate of adding days to project completion time to the initial duration of 38.33%, through the developed strategy it has succeeded in reducing the rate of adding days to project completion time to the initial duration to 16.73%. In the Simulation Value schedule model (Confidence Level 80%), it shows the rate of adding days to project completion time to the initial duration of 34.72%, through the developed strategy it has succeeded in reducing the rate of adding days to project completion time to the initial duration to 14.06%. In the Simulation Value schedule model (Confidence Level 90%), it shows the rate of adding days to project completion time to the initial duration of 36.78%, through the developed strategy it has succeeded in reducing the rate of adding days to project completion time to the initial duration to 15.57%. In the Simulation Value schedule model (Confidence Level 95%), it shows the rate of adding days to project completion time to the initial duration of 38.33%, through the developed strategy it has succeeded in reducing the rate of adding days to project completion time to the initial duration to 16.73%. Based on the results of the analysis, it shows that the developed strategy can reduce the inherent risk impact value to the residual risk value in each critical path activity. The potential value of additional project completion time due to dominant risk is 30.68–38.33% of the initial duration of the project. Through the development of preventive and corrective action strategies for each critical path activity, the potential added value of project completion time due to dominant risk can be reduced to 11.45–16.73% of the initial project duration ().
Table 12. Comparison of time performance based on inherent and residual value schedule model.
5. Conclusions
In this study, sequential qualitative and quantitative evaluation is attempted. This is a method that wasn’t covered in a number of earlier studies on toll road projects using the CPF scheme. The case study project’s critical path’s dominant risk is revealed by the qualitative analysis’s findings. Dominant risk factors in critical path activities: Contractor Liquidity Problems in Main Road activities STA 18 + 600 to 18 + 950 Embankment Works, and Rigid Pavement Works, Problems Unexpected difficulties in construction implementation in Main Road activities STA 18 + 600 to 18 + 950 LPA Works (Aggregate Foundation Layer), Sub-Contractor and/or Vendor Liquidity Issues in Main Road STA 18 + 600 to 18 + 950 LC (Lean Concrete) Work activities, and Concrete Media Barriers. Quantitative analysis using the PERT method results in an estimate of the additional time for project completion due to the dominant risk on the critical path. The potential value of additional project completion time due to dominant risk is 30.68–38.33% of the initial duration of the project. This research succeeded in developing a risk-based strategy in implementing the CPF scheme on toll road projects which is also something new from other studies. Through the development of preventive and corrective action strategies for each critical path activity, the potential added value of project completion time due to dominant risk can be reduced to 11.45–16.73% of the initial project duration.
6. Recommendations
Methods of data collection in qualitative risk analysis can be done with different methods in this study so that it can determine the effect of using the method on qualitative risk results. Using the same method, a larger number of FGD participants could be used than the number of FGD participants in this study. Can use several other model distributions besides PERT so that you can find out the differences in other distribution models that are not used in this study. If you use the PERT distribution model, you can use variations in the number of iterations and different confidence levels in this study. Furthermore, research can also be carried out on the impact on cost and quality as a result of implementing a strategy on the critical path which has an impact on accelerating the completion time.
Disclosure statement
No potential conflict of interest was reported by the author(s).
Additional information
Notes on contributors
Mohammad Ichsan
Dr. Mohammad Ichsan is an Assistant Professor in the Binus Business School of Bina Nusantara University. He has pursued his Diplom Ingenieur in Electrical Engineering from the Hochschule Darmstadt, Germany prior to obtain his Master’s in Project Management from the University of Indonesia. He has continued his study and received his Doctoral in Strategic Management. His teaching area is project management and operations management, meanwhile his research domain is project portfolio management, project management office practices and project risk management.
Wisnu Isvara
Dr. Wisnu Isvara is an Assistant Professor in the Civil Engineering Department Faculty of Engineering Universitas Indonesia. He has been lecturing in subjects of project management, construction management, cost management, procurement management and engineering system. He completed his Bachelor’s degree in Civil Engineering from Universitas Indonesia. He has continued his study and received his master’s degree and completed his doctorate degree majoring in Construction Management from Universitas Indonesia. Dr Wisnu Isvara also served as General Manager of Institute of Technology Faculty of Engineering Universitas Indonesia since 2007 until now.
Jodi Noor Handibyanto
Jodi Noor Handibyanto is a civil servant at the Ministry of Public Works and Housing, Republic of Indonesia. He holds a Bachelor’s degree in Civil Engineering from University of Indonesia and Master of Engineering in Project Management from University of Indonesia. Some of his research objects include research on buton rock asphalt mixtures and project management in toll road projects.
Farras Ammar Muhammad
Farras Ammar Muhammad is a graduate in the field of civil engineering and project management where in his undergraduate program he took research in buton rock asphalt mixtures and in his master’s program he took research in project risk management, both from the University of Indonesia. Currently working as an operational supervisor in the oil and gas industry and has interests in project management & operations management.
References
- Alashwal, A. M., & Al-Sabahi, M. H. (2019). Risk factors in construction projects during unrest period in Yemen. Journal of Construction in Developing Countries, 23(2), 43–62. https://doi.org/10.21315/jcdc2018.23.2.4
- Anysz, H., & Rogala, W. (2019). Sensitivity analysis of the contractor’s financial effects achieved on a single building site. Przegląd Naukowy Inżynieria i Kształtowanie Środowiska, 28(2), 183–191. https://doi.org/10.22630/PNIKS.2019.28.2.17
- Ariyanto, I. N., Purba, H. H., & Purba, A. (2020). A systematic review and analysis of risk assessment in highway construction projects. Operational Research in Engineering Sciences: Theory and Applications, 3(3), 29–47. https://doi.org/10.31181/oresta20303029a
- Arnold, U., & Yildiz, Ö. (2015). Economic risk analysis of decentralized renewable energy infrastructures - A Monte Carlo Simulation approach. Renewable Energy. 77(1), 227–239. https://doi.org/10.1016/j.renene.2014.11.059
- Asmamaw, L. B., Mohammed, A. A., & Lulseged, T. D. (2011). Land use/cover dynamics and their effects in the Gerado Catchment, Northeastern Ethiopia. International Journal of Environmental Studies, 68(6), 883–900. https://doi.org/10.1080/00207233.2011.637701
- Atin, S., & Lubis, R. (2019). Implementation of critical path method in project planning and scheduling. IOP Conference Series: Materials Science and Engineering, 662(2), 022031. https://doi.org/10.1088/1757-899X/662/2/022031
- Aziz, R. F., & Abdel-Hakam, A. A. (2016). Exploring delay causes of road construction projects in Egypt. Alexandria Engineering Journal, 55(2), 1515–1539. https://doi.org/10.1016/j.aej.2016.03.006
- Badan Pengatur Jalan Tol. (2021a). Transformasi Jalan Tol Merajut Nusantara. https://bpjt.pu.go.id/booklet/buku_BPJT_2020/index.html#p=3
- Badan Pengatur Jalan Tol. (2021b, January 8). Kilas Balik Capaian Kinerja BPJT Kementerian PUPR Tahun 2020. https://bpjt.pu.go.id/berita/kilas-balik-capaian-kinerja-bpjt-kementerian-pupr-tahun-2020-part-1
- Choudhry, R. M. (2019). Risk Analysis Related to Cost and Schedule for a Bridge Construction Project. www.intechopen.com
- Grimsey, D., & Lewis, M. K. (2002). Evaluating the risks of public private partnerships for infrastructure projects. www.elsevier.com/locate/ijproman
- Hajdu, M. (2013). Effects of the application of activity calendars on the distribution of project duration in PERT networks. Automation in Construction, 35, 397–404. https://doi.org/10.1016/j.autcon.2013.05.025
- Hajdu, M., & Bokor, O. (2016). Sensitivity analysis in PERT networks: Does activity duration distribution matter? Automation in Construction, 65, 1–8. https://doi.org/10.1016/j.autcon.2016.01.003
- Handoko, J. R., & Gondokusumo, O. (2019). Comparison of PERT and M-PERT scheduling for a construction project in Malang, Indonesia. IOP Conference Series: Materials Science and Engineering, 508(1), 012034. https://doi.org/10.1088/1757-899X/508/1/012034
- Hendradewa, A. P. (2019). Schedule risk analysis by different phases of construction project using CPM-PERT and Monte-Carlo simulation. IOP Conference Series: Materials Science and Engineering, 528(1), 012035. https://doi.org/10.1088/1757-899X/528/1/012035
- Hossen, M. M., Kang, S., & Kim, J. (2015). Construction schedule delay risk assessment by using combined AHP-RII methodology for an international NPP project. Nuclear Engineering and Technology, 47(3), 362–379. https://doi.org/10.1016/j.net.2014.12.019
- Hsiau, H. J., & Lin, C. W. R. (2009). A fuzzy pert approach to evaluate plant construction project scheduling risk under uncertain resources capacity. Journal of Industrial Engineering and Management, 2(1), 31–47. https://doi.org/10.3926/jiem.2009.v2n1.p31-47
- Ikhtiari, K., Kalsum, U., Rahim, S., & Anjarsari, R. (2021). Pengaruh Inherent Risk dan Detection Risk Terhadap Kualitas Opini Audit. Profita : Komunikasi Ilmiah Akuntansi Dan Perpajakan, 14(1), 49–62. https://doi.org/10.22441/profita.2021.v14i1.005
- Indopremier. (2017, December 18). Skema CPF Lebih Menguntungkan Ketimbang Kontrak Standar. Indopremier.Com. https://www.indopremier.com/ipotnews/newsDetail.php?jdl=Waskita___Skema_CPF_Lebih_Menguntungkan_Ketimbang_Kontrak_Standar&news_id=85075&group_news=IPOTNEWS&news_date=&taging_subtype=WSKT&name=&search=y_general&q=Waskita%20Karya%20(Persero)&halaman=1
- Jia Yau, N., & Bin Yang, J. (2012). Factors causing design schedule delays in turnkey projects in Taiwan terminology and literature review. Project Management Journal, 43(3), 50–61. https://doi.org/10.1002/pmj.21265
- Kehinde Onifade, M., Oluwaseyi, A. J., Morakinyo Kehinde, O., Joseph Afolabi, O., & Babawale, A. (2017). Article in European Project Management Journal. European Project Management Journal, 7(2), 3–13. www.epmj.org
- Kementerian Pekerjaan Umum dan Perumahan Rakyat. (2016). Modul Dokumen Kontrak. Kementerian Pekerjaan Umum dan Perumahan Rakyat.
- Koulinas, G., Xanthopoulos, A., Tsilipiras, T., & Koulouriotis, D. (2020). Schedule delay risk analysis in construction projects with a simulation-based expert system. Buildings, 10(8), 134. (https://doi.org/10.3390/buildings10080134
- Larsen, J. K., Shen, G. Q., Lindhard, S. M., & Brunoe, T. D. (2016). Factors affecting schedule delay, cost overrun, and quality level in public construction projects. Journal of Management in Engineering, 32(1), 4015032. https://doi.org/10.1061/(asce)me.1943-5479.0000391
- Lawrence, B. F. (2001). Simplified CPM/PERT simulation model. Journal of Construction Engineering and Management, 127(6). https://doi.org/10.1061/(ASCE)0733-9364(2001)127:6(513)
- Lee, H. C., Lee, E. B., & Alleman, D. (2018). Schedule modeling to estimate typical construction durations and areas of risk for 1000 MW ultra-critical coal-fired power plants. Energies, 11(10), 2850. https://doi.org/10.3390/en11102850
- Lee, J. I., Lee, H.-S., & Park, M. (2018). Contractor liquidity evaluation model for successful public housing projects. Journal of Construction Engineering and Management, 144(12), 04018109. https://doi.org/10.1061/(asce)co.1943-7862.0001569
- Liu, X., Shen, L., & Zhang, K. (2021). Estimating the probability distribution of construction project completion times based on drum-buffer-rope theory. Applied Sciences, 11(15), 7150. https://doi.org/10.3390/app11157150
- Mahamid, I., Bruland, A., & Dmaidi, N. (2012). Causes of delay in road construction projects. Journal of Management in Engineering, 28(3), 300–310. https://doi.org/10.1061/(ASCE)ME.1943-5479.0000096
- Mariana, Y., & Wijaksono, S. (2021). Project Evaluation and Review Technique (PERT) analysis in the renovation project of the Church of St. John the Evangelist, Jakarta. IOP Conference Series: Earth and Environmental Science, 794(1), 012188. https://doi.org/10.1088/1755-1315/794/1/012188
- Maulana, A., & Kurniawan, F. (2019). Time optimization using CPM, PERT and PDM methods in the Social and Department of Kelautan Building Development Project Gresik District. JTI International Journal of Transportation and Infrastructure, 2, 57–66.
- Mejía, G., Sánchez, O., Castañeda, K., & Pellicer, E. (2020). Delay causes in road infrastructure projects in developing countries. Revista de la Construcción, 19(2), 220–234. https://doi.org/10.7764/RDLC.19.2.220
- Monahan, G. (2008). Enterprise risk management: A methodology for achieving strategic objectives. Wiley.
- Mubin, S., Jahan, S., & Gavrishyk, E. (2019). Monte Carlo simulation and modeling of schedule, cost and risks of Dasu Hydropower Project. Mehran University Research Journal of Engineering and Technology, 38(3), 557–570. https://doi.org/10.22581/muet1982.1903.03
- Nemaa, Z. K., & Aswed, G. K. (2021). Forecasting construction time for road projects and infrastructure using the fuzzy PERT method. IOP Conference Series: Materials Science and Engineering, 1076(1), 012123. https://doi.org/10.1088/1757-899X/1076/1/012123
- Nurwahyudo, T. (2021). Manajemen Risiko Kontrak Skema Contractor Full Pre-Financed pada Proyek Konstruksi Jalan Tol di Indonesia. https://repository.its.ac.id/86673/
- Nyumba, T. O., Wilson, K., Derrick, C. J., & Mukherjee, N. (2018). The use of focus group discussion methodology: Insights from two decades of application in conservation. Methods in Ecology and Evolution, 9(1), 20–32. https://doi.org/10.1111/2041-210X.12860
- Penttinen, M., Rummukainen, A., & Mikkola, J. (2011). Profitability, liquidity and solvency of wood harvesting contractors in Finland. Small-Scale Forestry, 10(2), 211–229. https://doi.org/10.1007/s11842-010-9143-x
- Plebankiewicz, E., Juszczyk, M., & Malara, J. (2015). Estimation of task completion times with the use of the PERT method on the example of a real construction project. Archives of Civil Engineering, LXI(3). http://archive.sciendo.com/ACE/ace.2015.61.issue-3/ace-2015-0024/ace-2015-0024.pdf
- Purnus, A., & Bodea, C.-N. (2013). Considerations on project quantitative risk analysis. Procedia - Social and Behavioral Sciences, 74, 144–153. https://doi.org/10.1016/j.sbspro.2013.03.031
- Rivera, L., Baguec, H., & Yeom, C. (2020). A study on causes of delay in road construction projects across 25 developing countries. Infrastructures, 5(10), 84. https://doi.org/10.3390/infrastructures5100084
- Rizka, M. (2021). Pengembangan Strategi Kontraktor Asing dengan Skema Kerjasama Joint Operation Berbasis Risiko untuk Meningkatkan Kinerja Waktu Proyek Pembangunan Gedung Bertingkat Tinggi. https://lib.ui.ac.id/m/detail.jsp?id=9999920532772&lokasi=lokal
- Ross, A., Williams, P., & Williams, R. (2013). Financial management in construction contracting. Wiley-Balckwell. www.wiley.com/go/rossfi
- Sadeghi, N., Fayek, A. R., & Pedrycz, W. (2010). Fuzzy Monte Carlo simulation and risk assessment in construction. Computer-Aided Civil and Infrastructure Engineering, 25(4), 238–252. https://doi.org/10.1111/j.1467-8667.2009.00632.x
- Schaufelberger, J. E. (2004). Causes of subcontractor business failure and strategies to prevent failure [Paper presentation]. Construction Research Congress 2003.
- Vu, H. A., Cu, V. H., Min, L. X., & Wang, J. Q. (2017). Risk analysis of schedule delays in international highway projects in Vietnam using a structural equation model. Engineering, Construction and Architectural Management, 24(6), 1018–1039. https://doi.org/10.1108/ECAM-06-2016-0138
- Winarsa, A. J. W. (2005). Manajemen Resiko pada Kontrak Kerja Konstruksi dengan Sistem Contractor Full Pre Financing. https://lib.ui.ac.id/file?file=pdf/abstrak-83427.pdf
- Zakia, & Febrianti, D. (2021). The critical path method in construction project rescheduling. IOP Conference Series: Earth and Environmental Science, 832(1), 012009. https://doi.org/10.1088/1755-1315/832/1/012009