
 ?Mathematical formulae have been encoded as MathML and are displayed in this HTML version using MathJax in order to improve their display. Uncheck the box to turn MathJax off. This feature requires Javascript. Click on a formula to zoom.
Abstract
Climate change effects are expected to be profoundly local and region-specific, underlining the urgent need for local-level assessments. This study emphasizes the agriculturally important Zanzan region of northeastern Côte d’Ivoire and examines future changes in precipitation, temperature, and resultant drought conditions based on six global climate models (GCMs) from the Coupled Model Intercomparison Project 6 (CMIP6) under shared socioeconomic pathways (SSPs) scenarios - SSP2-4.5 and SSP5-8.5. We integrate data from 12 stations within the Zanzan region, applying CMhyd software to correct model biases. Key statistical metrics confirm the well-calibrated nature of the corrected GCMs vis-à-vis observed data. Projections show a decrease in annual precipitation by an average of 133 mm and 177 mm under SSP2-4.5 and SSP5-8.5 scenarios respectively by 2100. Future precipitation patterns suggest a shift towards the prevalent dry season. Tmax and Tmin are projected to increase by +3 °C and +4.8 °C (SSP2-4.5 and SSP5-8.5) and +3.3 °C (both scenarios) respectively, by the end of the century. These changes suggest an intensification of severe droughts, particularly in the 2050s and 2080s, as assessed by the SPEI. Additionally, extreme temperatures (TX90p) and consecutive dry days (CDD) are projected to intensify, posing imminent threats to food security, water resources, and public health in the Zanzan region. This study bridges a critical gap by offering localized insights into future climate scenarios, thereby enhancing our understanding of the region-specific impacts of climate change. The research also underscores the urgency of adaptation and mitigation strategies tailored to the Zanzan region’s vulnerabilities.
1. Introduction
Among the various regions in Africa, West Africa has experienced notable impacts from climate variability and change (Akpoti et al., Citation2022; Siabi et al., Citation2023), emerging as an area of heightened vulnerability and susceptibility to these changes. In recent decades, noticeable changes have been observed in precipitation and temperature patterns in West Africa (Yeboah et al., Citation2022), with evidence of a warming trend of approximately 0.5 °C per decade (Sylla et al., Citation2016). Regarding future projections, Todzo et al. (Citation2020) demonstrated, for example, that West Africa is likely to undergo a more rapid temperature rise of +0.5 °C per decade, surpassing the global average of +0.3 °C per decade, throughout the 21st century, as well as an anticipated increase in average precipitation along the Guinean coast and a decrease in the Sahel region. Indeed, the combination of rising temperatures and heightened precipitation variability will result in disrupted agricultural seasons, disturbed crop life cycles, and a decline in agricultural productivity (McMichael, Citation2001). While it is true that these climate variabilities will affect several livelihood assets in West Africa, the rain-dependent agricultural sector raises significant concerns, particularly in light of the current drought conditions. Throughout history, West Africa has experienced recurrent and severe drought events that have posed significant obstacles to food production in the sub-region, thereby undermining efforts to ensure food security. During the 1970s and 1980s, the Sahelian regions of West Africa encountered severe droughts, resulting in significant impacts and challenges (Masih et al., Citation2014; Traore et al., Citation2014). Recent cases of drought have also been demonstrated in Nigeria (Abubakar & Yamusa, Citation2013), Senegal (Faye, Citation2022; Faye et al., Citation2017), Ghana (Ankrah et al., Citation2023), and Côte d‘Ivoire (Soro et al., Citation2014). The current frequency of droughts in West Africa is projected to be more intense, leading to a substantial decline in agricultural production (Sylla et al., Citation2016). Therefore, it is important to assess future drought conditions, especially at the local level, for better planning by policymakers. The evaluation of future drought scenarios plays a critical role in various sectors of the national economy, such as forestry, biodiversity, energy, and health, as well as the water sectors and agriculture (Jenkins & Warren, Citation2014).
Côte d‘Ivoire is highly susceptible to the negative impacts of climate change in West Africa, primarily due to its significant reliance on rainfed agriculture and hydropower, rendering it one of the most vulnerable countries in the region (MINSEDD, Citation2017). In addition, Côte d‘Ivoire faces various climate change-related challenges, including unmanaged socio-economic impacts caused by floods, land degradation, rising sea levels, coastal erosion, reduced agricultural productivity, heightened vulnerability to endemic diseases (such as meningitis and malaria), and more frequent drought events (Dje, Citation2014). Historically, Côte d‘Ivoire has experienced precipitation fluctuations since the 1950s, with the 1950s and 1960s being relatively wet and the decades from the 1970s to the 1990s being dry (FAO et al., Citation2018). The analysis of 1971-2000 normal compared to the 1961-1990 normal showed an average reduction of 6% in rainfall amounts across the Ivorian territory (Dje et al., Citation2014). Therefore, from the early 1980s until 2000, there was a particularly deficient rainfall pattern. In specific regions of Côte d‘Ivoire from 1940 to 2010, there has been a significant decrease in rainfall. Soubré experienced a reduction of 23.5%, Abidjan saw a decrease of 28.9%, Abengourou, and Gagnoa in the forest zone had minimal declines, Bouaké and Bondoukou had a decrease of 12.5%, and Korhogo had a decrease of 7.7% (FAO et al., 2018). These historical rainfall deficits observed in Côte d‘Ivoire have resulted in numerous drought events, with a significant recurrence of drought since the 1970s and a high percentage of stations experiencing rainfall deficits, particularly in 1987 when 50% of the country was affected (MINEDD, Citation2020). Approximately 17% of the regions experienced the effects of drought between 1981 and 2000 (MINEDD, Citation2020). Previous studies in Côte d‘Ivoire have also highlighted the recurrence of these droughts in the northern region (Soro et al., Citation2014), the western region (Santé et al., Citation2019; Savané et al., Citation2001), and the coastal areas (Santé et al., Citation2019). Currently, in Côte d‘Ivoire, an average of 1.3 million people (5.4%) are affected by droughts annually, and this number is projected to reach 2.4 million people (7.9%) when accounting for population growth (UNDRR & CIMA, Citation2019). Furthermore, the probability of drought occurrence is expected to increase by 7.5% from 2051 to 2100 (MINEDD, Citation2020). Moreover, it is anticipated that the economic impact of droughts will rise from approximately 4 billion to over 8 billion USD per year, with the current GDP affected by around 11% and projected to reach 25% (UNDRR & CIMA, Citation2019). Historically, there has been a documented increase in temperatures in Côte d‘Ivoire, with the country experiencing a temperature rise of 1.6 °C between 1960 and 2010 (FAO et al., 2018). Other studies have shown that Côte d‘Ivoire has experienced an average warming of 0.5 °C since the 1980s, and since 1998, a persistent warming trend has been observed with an increase of over 0.5 °C compared to the average in most regions (MINEDD, Citation2020; MINSEDD, Citation2017). During the past three decades, the country’s average temperature has remained higher than the 1961-1990 reference average, with the period from 2001 to 2010 being particularly warm, showing a deviation of 0.8 °C (MINEDD, Citation2020). Previous studies, mostly based on Representative Concentration Pathways (RCPs) scenarios, have projected an increase in temperatures in Côte d‘Ivoire. For example, the UNDRR and CIMA (Citation2019) study highlighted a projected temperature rise of 1.5 to 4 °C between 2050 and 2075 under the RCP8.5 scenarios. According to MINSEDD (Citation2017), mean temperatures could also rise by 3 °C by 2100 across most of the country, from north to south, under the RCP 4.5 scenario. Furthermore, Diomandé et al. (Citation2023) projected an increase of +1 °C and +1.5 °C under the RCP 4.5 and RCP 8.5 scenarios, respectively, by 2050 throughout the Ivorian territory. The precipitation projections associated with these previous studies have shown a lot of uncertainties. However, at a smaller scale, such as the Bandama River Basin in Côte d‘Ivoire, Soro et al. (Citation2017) indicated, for example, a future decrease in precipitation under RCP 4.5 and RCP 8.5, accompanied by a tendency of increasing temperatures. This previous observation was also demonstrated by Balliet et al. (Citation2016) in the Central-West region of Côte d‘Ivoire under the A2 and B2 scenarios. Conducting local-scale studies enables a comprehensive examination of regional climate patterns and their variability, leading to an enhanced understanding of the underlying processes responsible for local climate variations (Kumar et al., Citation2016). However, studies on future climate projections, especially regarding droughts in the regions of Côte d‘Ivoire, particularly in the north, are almost non-existent, especially when considering the projections based on the new Shared Socioeconomic Pathways (SSPs) scenarios (Riahi et al., Citation2016).
The Zanzan region in northeastern Côte d‘Ivoire, which is the focus of this study, is one of the least industrialized regions in the country, with the livelihoods of the population relying solely on rainfed agriculture. This region is one of the major agricultural producers in Côte d‘Ivoire, providing staple crops such as maize and cassava, particularly yam. Cashew nuts play a crucial role as the primary commercial crop in this region of Côte d‘Ivoire, making a substantial contribution to the country’s GDP. Previous studies in this region on climate change are insufficient to enable effective planning by decision-makers. Previous studies have shown disruption in rainfall patterns in the Zanzan region in the past (Dje et al., Citation2018), and these changes have had a significant impact on crops (Noufé et al., Citation2015). The recent study by Kouman et al. (Citation2022) solely focused on the historical evolution of precipitation and temperature. This study by Kouman et al. (Citation2022) demonstrated a general decrease in precipitation in this region, accompanied by an increase in consecutive dry days and warm spells, indicating the presence of drought. However, studies based on future climate projections are nonexistent. Despite advances in climate science, there remain significant gaps in understanding the localized effects of climate change, particularly in regions like the Zanzan region. To address these gaps, sustained research efforts and capacity-building initiatives are necessary to generate context-specific data and actionable insights for policymakers. In this context, this study aims to evaluate the projections of climatic variables such as precipitation and temperature, as well as the derived drought conditions in the northeast of Côte d‘Ivoire, using data from global climate models (GCMs) from the Coupled Model Intercomparison Project Phase 6 (CMIP6). By employing downscaling techniques or bias correction methods to global climate projections, GCMs can offer valuable insights into the potential temporal and spatial variations of climate change, enabling a better understanding of the regional and local impacts, including changes in temperature, precipitation, and other relevant variables. Using GCMs remains a prominent and effective method for investigating the future trends of droughts in a dynamically changing climate (Zhiña et al., Citation2019). In recent years, notable advancements have been made in the development of reliable GCMs that offer valuable insights into climatic variables. The latest release of the CMIP6, which incorporates the newest state-of-the-art climate models, offers advanced ensemble simulations (Eyring et al., Citation2016), and was used in the latest IPCC’s Sixth Assessment Report (AR6). Compared to CMIP3 and CMIP5, CMIP6 is considered to have improved accuracy in capturing observed large-scale patterns of surface temperature and precipitation (Xin et al., Citation2020; Zhu et al., Citation2020). CMIP6 introduces also a set of new scenarios called SSPs, which provide a framework for assessing future climate change impacts based on different socioeconomic development pathways (O'Neill et al., Citation2016). The objectives of this study are therefore (1) to assess the performance of GCM models (CMIP6) after bias correction in simulating temperature and precipitation in the Zanzan region of Côte d‘Ivoire; (2) to evaluate projected future changes in precipitation and temperature; and (3) to characterize future drought conditions using the Standardized Precipitation Evapotranspiration Index (SPEI) and indices of extreme temperature and precipitation.
2. Materials and methods
2.1. Description of the study area
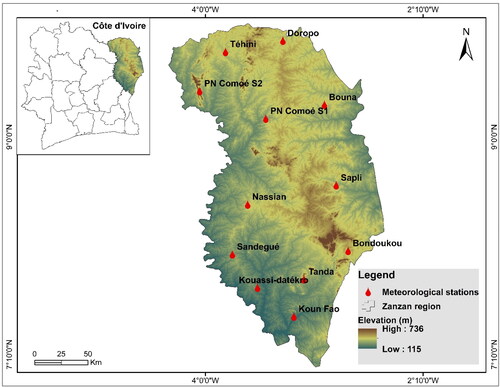
Côte d‘Ivoire is a country located in West Africa and is composed of 31 regions, including the Zanzan region situated in the northeastern part of the country, spanning latitudes 7° to 10° North and longitudes 4°30’ to 2°30’ West (). The Zanzan region covers an approximate land area of 38,000 square kilometers and is estimated to have a population of 1,344,865 inhabitants, according to the 2021 National Population and Housing Census. Agriculture serves as the primary income source for the local population, with over 90% of the population engaged in this sector, primarily through traditional family farming practices. Cultivated crops such as yam, maize, banana, and cassava form significant components of agricultural activities in the region. Additionally, cashew nut stands out as the primary commercial crop. The Zanzan region is characterized by a humid tropical Sudanese Guinean climate, featuring four well-defined seasons. It experiences two distinct rainy seasons from March to June and September to October, while the intervening periods are marked by two dry seasons, which occur from November to February and July to August. The region receives annual precipitation ranging from 800 to 1200 mm, accompanied by an average temperature of approximately 28 °C (Brou et al., Citation2005).
Figure 1. Study area map of the Zanzan region in Côte d'Ivoire.
2.2. Datasets
The ground-based observed data for this study consisting of daily temperature and precipitation data were collected from the ‘Société d‘exploitation et de développement aéroportuaire, aéronautique et météorologique (SODEXAM)’ in Côte d‘Ivoire for the Zanzan region (). It is a set of 12 stations, whose geolocation is described in (See Appendix). A critical analysis of these observational data, followed by their control and quality assessment, has already been successfully established in the study by Kouman et al. (Citation2022). These observed data covering the period 1981–2014 were used for the bias correction of the GCMs data. Data were collected also from six GCMs under the CMIP6 project () for both historical (1950-2014) and future (2015-2100) periods using two shared socioeconomic pathways (SSPs) - SSP2-4.5 and SSP5-8.5. The data for the r1i1p1f1 ensemble were specifically acquired and are accessible from the following website: https://esgf-node.llnl.gov/search/cmip6/. These future projection data were specifically composed of precipitation, minimum and maximum temperature data. The CMIP6 dataset has improved representations of physical processes and greater horizontal and vertical resolution compared to the CMIP5 dataset, as noted by Eyring et al. (Citation2016). The potential range of greenhouse gas emissions in the future is described by SSPs, which take into account factors such as economic and population growth, investments in health and education, and efforts toward climate mitigation as outlined in the ScenarioMIP (O'Neill et al., Citation2016). The two SSPs considered in this study correspond to radiative forcing pathways that lead to an increase of 4.5 W/m2 (SSP2-4.5, representing a middle-of-the-road scenario) and 8.5 W/m2 (SSP5-8.5, representing a high-end forcing pathway) by the end of the 21st century. According to Cook et al. (Citation2020) and Tebaldi et al. (Citation2021), the two SSPs (SSP2-4.5 and SSP5-8.5) correspond to an estimated increase in average annual temperature of about 3 °C and 5 °C, respectively, by the end of the 21st century compared to pre-industrial levels. This study divided future scenarios into three distinct 30-year periods: 2011-2040 (2020s), 2041-2070 (2050s), and 2071-2100 (2080s). In CMIP6, the shift from historical simulation to future SSPs happened around 2014/2015, resulting in the inclusion of four years from the historical simulation in the 2020s intervals. This same division of future periods was also established in the study by Sobie et al. (Citation2021).
Table 1. Information on CMIP6 GCMs used in this study.
2.3. Methods
2.3.1. Statistical bias correction used
The Climate Model Hydrologic Modeling (CMhyd) software, which is a tool that implements statistical bias correction to adjust GCMs and Regional Climate Models (RCMs) data (Rathjens et al., Citation2016), was used in this study. The basic principle of statistical bias correction is to correct the GCMs or RCMs data by removing systematic biases and errors in the data. This involves comparing the GCMs data to historical observations of climate variables (such as temperature and precipitation) for a given location or region and identifying any systematic differences between the two datasets (Ezéchiel et al., Citation2016). These differences can then be used to develop a statistical model that adjusts the GCMs data to better match the observed data. The CMhyd software has been widely utilized in various applications (Andrade et al., Citation2021; de Carvalho et al., Citation2021; Siabi et al., Citation2023; Yeboah et al., Citation2022). The selection of the CMhyd tool for this study was based on its capability to simulate historical and future climates using the CMIP6 data. A flowchart outlining the bias correction procedure used in this study is presented in (see Appendix). There are eight bias-correction methods available in the CMhyd tool, which include power transformation of precipitation, precipitation local intensity scaling, distribution mapping, delta change correction (additive and multiplicative), variance scaling of temperature, and linear scaling (additive and multiplicative). In this study, the quantile mapping (distribution mapping) approach was utilized, which was identified by Zhang et al. (Citation2018) as the most effective method after evaluating five bias correction techniques. Quantile mapping involves adjusting the GCMs data to match the observed data at specific percentiles (or quantiles) of the distribution. To change the frequency of temperature and precipitation, the predicted GCMs data was utilized along with the transfer function relying on average monthly values (Zhang et al., Citation2018). The suitability of the Gamma distribution for precipitation events has been previously demonstrated by Teutschbein and Seibert (Citation2012).
(1)
(1)
Where the parameters’ form and scale are represented by α and β, respectively; the Gamma cumulative distribution function (CDF) is denoted by and the Gamma function is denoted by Γ. Studies have shown that the Gaussian distribution with parameter “μ’’ and scale parameter “𝜎’’ is the most appropriate for temperature events, as evidenced by the use of the distribution in various studies (Bisht et al., Citation2020; Teutschbein & Seibert, Citation2012). Additional insights into the Gamma and Gaussian distributions are provided in Teutschbein and Seibert (Citation2012).
2.3.2. Evaluation of the accuracy of bias correction
To evaluate the performance of the bias-corrected models, the study utilized several assessment metrics, including the Nash-Sutcliffe Efficiency (NSE) (EquationEq. 2(2)
(2) ), the Root Mean Square Error (RMSE) (EquationEq. 3
(3)
(3) ), the Percent bias (PBIAS) (EquationEq. 4
(4)
(4) ), and the coefficient of determination (R2) (EquationEq. 5
(5)
(5) ). According to Nash and Sutcliffe (Citation1970), the NSE metric ranges from negative infinity to one, and a value equal to or greater than 0.5 indicates satisfactory performance of the model. A value greater than 0.7 is considered to be a very good fit. To evaluate the goodness-of-fit, RMSE was used as a measure of the standard deviation between the observed and modeled data. Smaller RMSE values indicate better model performance. To assess the potential overestimation or underestimation of the observed data by the model, the PBIAS metric was utilized. As the value of PBIAS approaches zero, the accuracy of the model is improved. In addition, the R2 was utilized to evaluate how well the modeled and observed data fit. As the R2 value gets closer to one, the model performance improves.
(2)
(2)
(3)
(3)
(4)
(4)
(5)
(5)
Where represents the predicted data,
represents the observed data, N is the number of observations, and
represents the average of the observed data.
2.3.3. Future change analysis and drought indices
The GCMs’ outputs for minimum temperature (Tmin), maximum temperature (Tmax), and precipitation (PR) were compared with the baseline period (1981-2010) to assess future changes for the following three timeframes (the 2020s, 2050s, and 2080s). The absolute and relative differences in temperature and precipitation were estimated using Equationequations 6(6)
(6) and Equation7
(7)
(7) respectively, to determine the underlying anomalies.
(6)
(6)
(7)
(7)
Where Δ denotes the absolute or relative changes, while represents Tmin, Tmax, or Precipitation for the baseline period, and
represents Tmin, Tmax, or Precipitation for the future period. Positive and negative anomalies indicate respectively the increase and decrease of the variables in the future period. Additionally, for the characterization of future drought conditions, four drought indices were considered including one meteorological drought index: The Standardized Precipitation Evapotranspiration Index (SPEI), and three other extreme climate indices that are characteristic of the presence of drought: Consecutive dry days (CDD), Number of hot days (TX90p), and the Warm spell duration indicator (WSDI). presents the definition of these indices. Specifically, the SPEI index is classified into negative and positive values, representing different degrees of moisture or drought in the environment (see ). The computation of the indices was done using ClimPACT2 software (Alexander & Herold, Citation2016). The indices related to extreme temperature and precipitation, as well as the SPEI index, are incorporated into the ClimPACT2 software, which only requires daily data of Tmin, Tmax, and precipitation as input data.
Table 2. Meteorological drought and extreme precipitation and temperature indices.
3. Results
3.1. Assessment of the bias correction performance
Graphical comparisons of precipitation, Tmax, and Tmin are presented in and (see Appendix), and Figure S1 (in the Supplementary Material), depicting both the ensemble bias-corrected and raw data. These graphical comparisons show that modeled precipitation, Tmax, and Tmin were well adjusted to observed data, even though it was previously observed that raw simulations were overestimated. However, statistical calculations were applied to each model to evaluate their performance, and the various results are presented in the Supplementary material. Regarding the Nash-Sutcliffe Efficiency (NSE), the accuracy of the bias-corrected precipitation, Tmax, and Tmin spanned from 0.97-0.99, 0.95-0.99, and 0.92-0.99, respectively, in comparison to the raw precipitation, Tmax, and Tmin which spanned from -0.89-0.86, -2.09-0.88, -6.72-0.51, respectively (Figure S2 in Supplementary Material). For RMSE, the performance of bias-corrected precipitation ranged from 0.71 to 4.75, compared to a range of 1.28 to 612.74 for raw precipitation. On the other hand, bias-corrected Tmax and Tmin displayed a range of 0.00-0.02 and 0.00-0.01, respectively, while raw Tmax and Tmin varied from 0.04-1.19 and 0.02-1.4 (Figure S3 in Supplementary Material). In terms of PBIAS, the overall performance of precipitation, Tmax, and Tmin varied from 0.001 to 0.24, -0.04 to 0.02, and -0.03 to 0.01, respectively, in contrast to -5.09 to 4.04, -0.68 to 1.07, and -1.87 to 0.99 for the raw data (Figure S4 in Supplementary Material). The bias-corrected precipitation exhibited improved capture of the monthly precipitation distribution in contrast to the raw precipitation across all models, as substantiated by the R2 values. The bias-corrected precipitation had an R2 range of 0.97-0.99, while the raw precipitation had an R2 range of 0.24-0.9. Additionally, the bias-corrected Tmax and Tmin had a performance range of 0.98-1 compared to the raw Tmax and Tmin, which had a performance range of 0.39-0.98 and 0.2-0.95 (Figure S5 in Supplementary Material). The statistical evaluation of bias-corrected precipitation, Tmax, and Tmin using NSE, RMSE, Pbias, and R2 metrics demonstrated good outcomes, despite an overestimation in the raw simulations (refer to supplementary material, Figures S2–S5). This underscores the effectiveness of the distribution mapping bias correction in reducing model discrepancies. However, the performance of the ensemble (representing the multi-model ensemble) mean is better than that of individual models; refer to Figures S2–S5 in the Supplementary Material. This evidence is also reflected by the close alignment in the graphical comparison of and (see Appendix), and Figure S1 (in the Supplementary Material). Consequently, the ensemble mean of bias-corrected results was employed in the subsequent part of this study to assess future climate changes in the Zanzan region.
3.2. Projection of mean precipitation under SSP2-4.5 and SSP5-8.5 scenarios until 2100
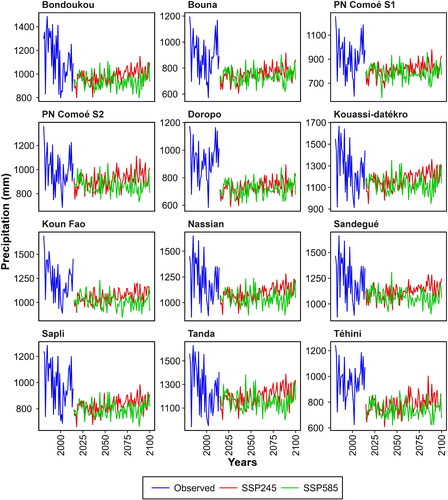
displays the mean annual precipitation projection for the Zanzan region under the SSP2-4.5 and SSP5-8.5 scenarios. The findings indicate that there will be a general decline in future precipitation until 2100 under both SSP2-4.5 and SSP5-8.5 scenarios when compared to the baseline period (1981-2010). Overall, in the Zanzan region, the mean annual precipitation is projected to decrease between 733 to 1199 mm/year under the SSP2 scenario and between 717 to 1155 mm/year under the SSP5 scenario, compared to a variation between 891 to 1272 mm/year for the reference period. The overall average of annual precipitation is projected to be 953 mm/year and 916 mm/year under SSP2 and SSP5 scenarios, respectively, compared to 1086 mm/year for the reference period. This indicates an average decrease in annual precipitation of 133 mm and 170 mm under SSP2 and SSP5 scenarios, respectively, in the Zanzan region by 2100. Specifically, these declines in mean annual precipitation are projected to be more severe at the Doropo and Téhini stations under SSP2, with annual precipitation declines of 188 and 180 mm/year, respectively (). Under the SSP5 scenario, these severe declines are expected to occur at the Téhini and Koun Fao stations, with annual precipitation declines of 221 and 219 mm/year, respectively, in contrast to the reference period (). Under both the SSP2 and SSP5 scenarios, the Tanda station is expected to experience the smallest average decrease in annual precipitation, with a precipitation decline estimated at 71 and 114 mm/year, respectively (). Overall, in the Zanzan region, the decrease in mean annual precipitation is anticipated to be more significant under the worst-case scenario SSP5 than under the moderate scenario SSP2. Areas such as Bouna, Doropo, and Téhini in the Zanzan region, where mean annual precipitation was below the regional average, are likely to experience extremely dry conditions in the future.
Figure 2. Temporal variability in annual mean precipitation between 1981 and 2100 for the SSP2-4.5 and SSP5-8.5 scenarios.
3.3. Projection of mean Tmax and Tmin under SSP2-4.5 and SSP5-8.5 scenarios until 2100
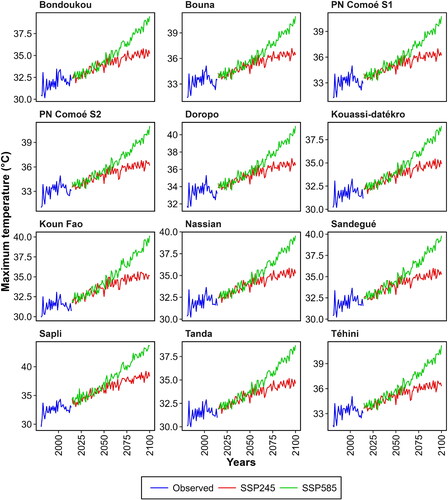
and (see Appendix) present the projection of annual mean temperatures (Tmax and Tmin) for the Zanzan region according to the SSP2-4.5 and SSP5-8.5 scenarios. The results indicate that there will be a general increase in both Tmax and Tmin in the future until 2100 under the two scenarios SSP2-4.5 and SSP5-8.5 compared to the reference period (1981-2010). For Tmax, the mean annual temperatures are expected to generally increase in the Zanzan region between 33.5 and 36.4 °C and between 34.6 and 38.2 °C under the SSP2 and SSP5 scenarios, respectively, compared to the reference period where Tmax was between 31.4 and 33.4 °C. This would mean an increase in Tmax of +3 °C and +4.8 °C under SSP2 and SSP5, respectively, compared to the reference period, over the entire Zanzan region by 2100. As for Tmin, the mean annual temperatures are expected to generally increase by 23.4-24.9 °C under SSP2 and 24.2-24.9 °C under SSP5 compared to the reference period where the variation of Tmin was between 21.5 and 21.6 °C. This implies that there will be an increase in Tmin of +3.3 °C under SSP2 and SSP5 compared to the reference period across the Zanzan region by 2100. Specifically, for Tmax, the most severe annual mean temperatures are expected to be recorded at the Sapli and Doropo stations, with values of 36.4 and 35.4 °C respectively under SSP2, and values of 38.2 and 36.6 °C under the SSP5 scenario, compared to their reference period values around 32.5 and 33.4 °C (). As for Tmin, the most severe annual mean temperatures are expected to be recorded at the Bouna and PN Comoé S2 stations, with values of 23.9 and 23.8 °C respectively under SSP2, and values of 24.9 and 24.8 °C under the SSP5 scenario, compared to their reference period values around 21.8 and 21.4 °C respectively ( in Appendix). Under both SSP2 and SSP5 scenarios, the station of Tanda is expected to experience the lowest increase in annual average Tmax and Tmin in the Zanzan region ( and ). Overall, in the Zanzan region, the rise in annual average Tmax and Tmin should be more significant under the worse-case SSP5 scenario than under the moderate SSP2 scenario. These increases in annual average Tmax and Tmin under both SSP2 and SSP5 scenarios will be especially pronounced from the 2080s onwards throughout the Zanzan region ( and ).
Figure 3. Temporal variability in annual mean Tmax between 1981 and 2100 for the SSP2-4.5 and SSP5-8.5 scenarios.
3.4. Changes in mean monthly precipitation under SSP2-4.5 and SSP5-8.5 scenarios
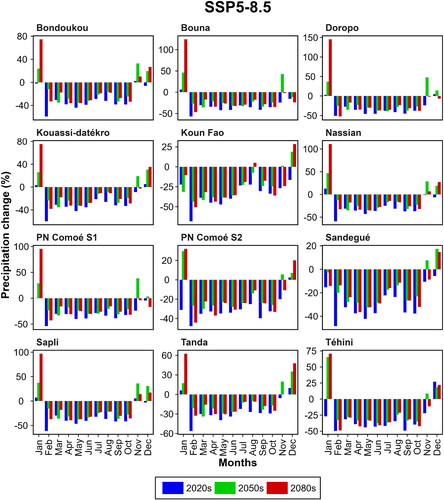
(see Appendix) and depict the mean monthly precipitation projection changes under the SSP2 and SSP5 scenarios in the Zanzan region. The projection indicates a general decline in precipitation for most months under both scenarios. Under SSP2, all studied stations are expected to experience a decrease in mean monthly precipitation, except for some months such as November, December, January, and February, especially during the 2050s and 2080s. The largest decreases in mean monthly precipitation under SSP2 are expected to occur at all studied stations during the 2020s, and could reach, for example, a decrease of -73% compared to the reference period in Bouna ( in Appendix). However, the greatest increase in mean monthly precipitation of around 82% compared to the reference period is projected to occur in January and during the 2050s period under the SSP2-4.5 scenario in Sapli ( in Appendix). Based on the SSP5 scenario, it is projected that the studied stations in the Zanzan region will generally experience a decrease in mean monthly precipitation. However, there may be exceptions for certain months, such as January, November, and December, where an increase in the percentage of precipitation is anticipated. The largest increase in mean monthly precipitation of about 145% compared to the reference period is projected to occur in January during the 2080s period under the SSP5-8.5 scenario in Sapli (). On average, in the Zanzan region, precipitation is projected to decrease by 31.9-46.9% and 29.1-39.1% during the 2020s, by 17-35.1% and 21.7-32.6% during the 2050s, and by 13.2-25.9% and 20.1-33.7% during the 2080s under SSP2 and SSP5 scenarios, respectively ( in Appendix). In summary, based on this analysis, it is noted that besides a general decrease in precipitation in the future, future precipitation events could occur between November and February under both SSP2 and SSP5 scenarios. In the climatic context of the Zanzan region, the period from November to February constitutes a dry season. According to the results, the months from November to February are projected to experience an increase in precipitation, indicating a potential shift of the future rainy season towards what is currently known as the dry season.
Figure 4. Mean monthly change of precipitation (%) for the periods 2020s (2011-2040), 2050s (2041-2070), and 2080s (2071-2100) relative to 1981-2010 for the ground stations under SSP2-4.5.
3.5. Changes in mean monthly maximum and minimum temperatures under SSP2-4.5 and SSP5-8.5 scenarios
and (see Supplementary Material) display the mean monthly changes in Tmax under the SSP2 and SSP5 scenarios, respectively. Across the studied stations, an increase in Tmax is projected for all months. The mean monthly Tmax is projected to rise in the near future (2020s) and further intensify throughout the century, with the highest values anticipated in the 2080s. In general, based on the studied stations under SSP2, Tmax is projected to increase from October to December (the hottest month) before decreasing, while under SSP5, there is no clear trend, but March in some stations and December in others are expected to be the hottest months ( and ). Under both SSP2 and SSP5 scenarios, in terms of Tmax across all studied stations, Sapli is projected to be the hottest station. On average in the Zanzan region, Tmax is projected to increase by 0.95-1.84 °C and 1.08-2.18 °C during the 2020s, 2.08-3.82 °C and 2.78-5 °C during the 2050s, and 3.01-5.35 °C and 5.51-9.05 °C during the 2080s under the SSP2 and SSP5 scenarios, respectively ( in Appendix).
Figure 5. Mean monthly change of Tmax (oC) for the periods 2020s (2011-2040), 2050s (2041- 2070), and 2080s (2071-2100) relative to 1981-2010 for the ground stations under SSP2-4.5.
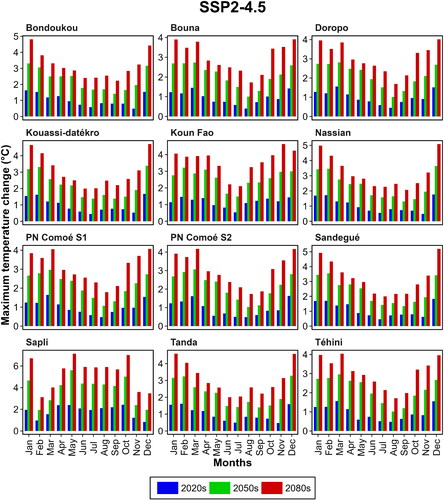
Figure 6. Mean monthly change of Tmin (oC) for the periods 2020s (2011-2040), 2050s (2041- 2070), and 2080s (2071-2100) relative to 1981-2010 for the ground stations under SSP5-8.5.
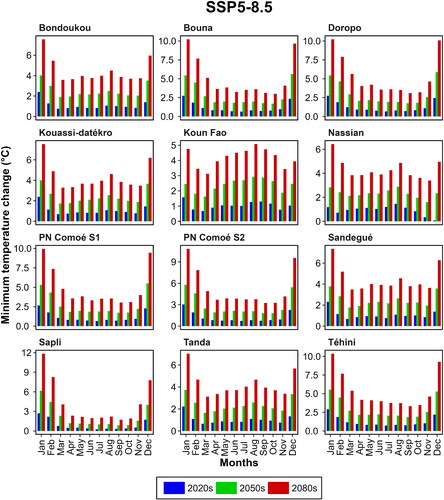
The mean monthly minimum temperature (Tmin) is also projected to increase in all months under both SSP2 (Figure S7 in Supplementary Material) and SSP5 () scenarios. In general, in the studied stations under SSP2, Tmin is projected to increase from November to January (the warmest month) before decreasing, while under SSP5, this temperature trend is expected to be observed at times from June to August ( and ). Tmin is projected to experience an increase throughout all months, with the highest values expected in the 2080s across all stations examined, regardless of the scenario considered. Under both SSP2 and SSP5 scenarios, in terms of Tmin, the station of Doropo is projected to be the warmest among all the studied stations. On average in the Zanzan region, Tmin is expected to increase by 0.82-1.11 °C and 0.89-1.25 °C during the 2020s period, by 1.76-2.27 °C and 2.15-2.92 °C during the 2050s period, and by 2.45-3.18 °C and 4.19-5.32 °C during the 2080s period under SSP2 and SSP5 scenarios, respectively ( in Appendix). For both Tmax and Tmin, the projected temperatures under the worst-case scenario SSP5 are higher and more significant than those projected under the moderate scenario SSP2.
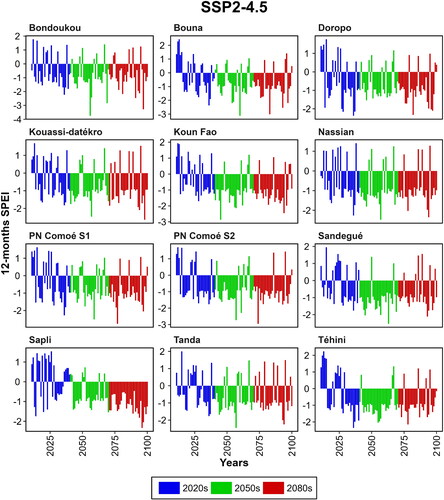
Figure 7. Mean of 12-months SPEI for the periods 2020s (2011-2040), 2050s (2041-2070), and 2080s (2071-2100) under SSP2 scenario.
3.6. Evaluation of future meteorological droughts using the Standardized Precipitation Evapotranspiration Index (SPEI)
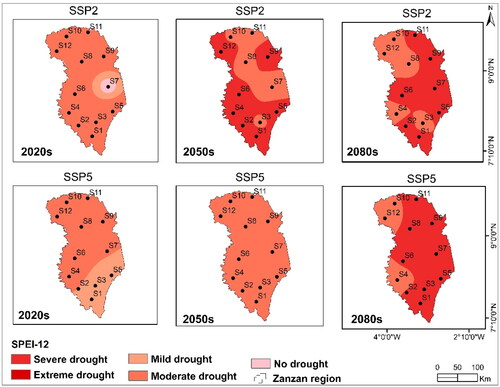
The temporal variation of the mean 12-months SPEI under SSP2 and SSP5 Scenarios is represented in and , respectively. For the periods the 2020s, 2050s, and 2080s under the SSP2 scenario, the Zanzan region is expected to experience both wet and prolonged dry periods based on the variation of the 12-months SPEI (). The frequency of dry years, as indicated by the 12-months SPEI, is expected to generally vary from 44-72% for the period 2020s, 72-93% for the period 2050s, and 75-100% for the period 2080s under the SSP2 scenario. Under SSP2, during the 2020s period, the region is projected to experience moderate droughts, while for the 2050s and 2080s periods, based on the variation of the 12-months SPEI, severe droughts are expected to affect almost the entire area of the region, with small areas experiencing moderate droughts (). Under the SSP5 scenario, the periods 2020s and 2050s are also expected to experience a coexistence of wet and dry periods, as indicated by the 12-months SPEI (). The frequency of occurrence of dry years is projected to generally range from 44% to 65% during the 2020s, and from 62% to 72% during the 2050s, based on the 12-months SPEI under the SSP5 scenario. However, for the period 2080s under SSP5, the frequency of occurrence of dry years is projected to be 100% for all studied stations in the Zanzan region, according to the variation in the 12-months SPEI (). For the 2020s and 2050s periods under SSP5, it is projected that the entire surface of the Zanzan region will be affected by moderate drought, based on the variation in the 12-months SPEI (). However, for the 2080s period, almost the entire region is expected to be dominated by severe drought ().
Figure 8. Mean of 12-months SPEI for the periods 2020s (2011-2040), 2050s (2041-2070), and 2080s (2071-2100) under SSP5 scenario.
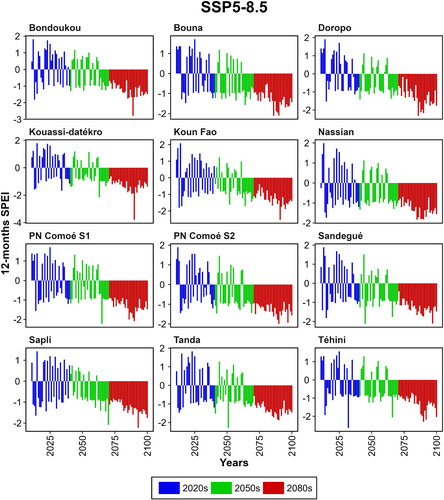
Figure 9. Spatial distribution of the mean 12-months SPEI for the periods 2020s (2011-2040), 2050s (2041-2070), and 2080s (2071-2100) under SSP2 and SSP5 scenarios in the Zanzan region. Stations (S1 = Koun Fao, S2 = Kouassi-datékro, S3 = Tanda, S4 = Sandegué, S5 = Bondoukou, S6 = Nassian, S7 = Sapli, S8 = PN Comoé S1, S9 = Bouna, S10 = Téhini, S11 = Doropo, S12 = PN Comoé S2).
3.7. Assessment of the future consecutive dry days (CDD) index
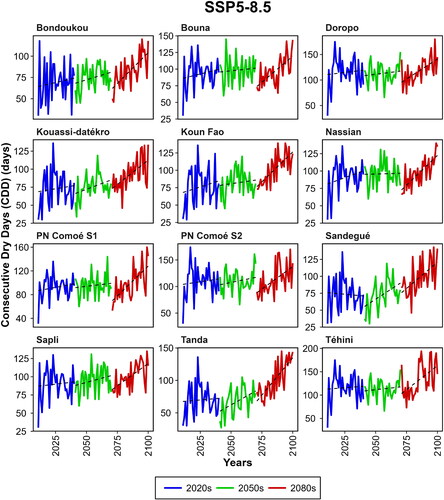
and show the projected variation of the mean consecutive dry days (CDD) under the SSP2 and SSP5 scenarios in the Zanzan region, respectively. Overall, CDD is projected to increase in the future under both SSP2 and SSP5 scenarios in the Zanzan region. Under the SSP2 scenario, the projected overall annual mean variation in consecutive dry days (CDD) is expected to range between 62-105 days for the 2020s period, 64-115 days for the 2050s period, and 75-121 days for the 2080s period. Peaks above the mean CDD are expected to be observed in Téhini and Doropo, reaching up to 141 days during the 2020s period, 175 days during the 2050s period, and 149 days during the 2080s period under SSP2 (). Generally, in the Zanzan region under the SSP5 scenario, CDD is projected to vary from 69 to 115 days during the 2020s period, from 68 to 113 days during the 2050s period, and from 83 to 133 days during the 2080s period. Peaks above the mean CDD, which are expected to be observed in Téhini, could reach up to 175 days during the 2020s period, 161 days during the 2050s period, and 194 days during the 2080s period under SSP5 (). The worst-case scenario SSP5 shows a more significant increase in projected CDD than the moderate scenario SSP2. Stations such as Téhini and Doropo in the Zanzan region are projected to experience the longest dry periods without precipitation in the future.
Figure 10. Mean of Consecutive Dry Days (CDD) (day) for the periods 2020s (2011-2040), 2050s (2041-2070), and 2080s (2071-2100) under SSP2 scenario.
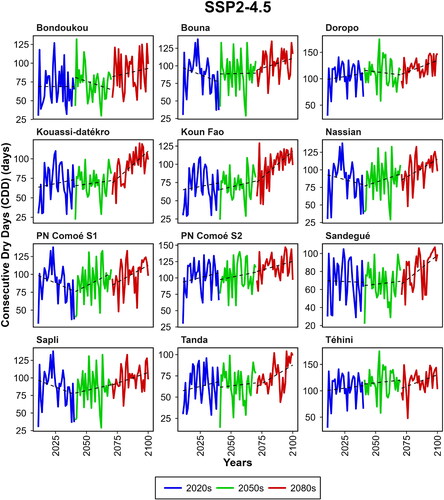
Figure 11. Mean of Consecutive Dry Days (CDD) (day) for the periods 2020s (2011-2040), 2050s (2041-2070), and 2080s (2071-2100) under SSP5 scenario.
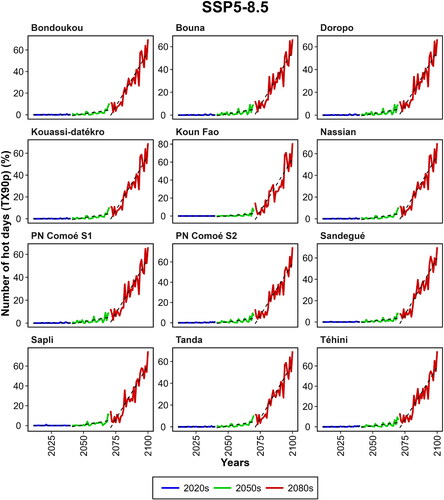
3.8. Future assessment of the number of hot days (TX90p) index
The variation of future extreme temperatures using the number of hot days (TX90p) index under SSP2 and SSP5 scenarios is represented in and . Generally, in the Zanzan region under SSP2, the percentage of the number of hot days is projected to increase steadily over the years. On average, in the study area under SSP2, the annual percentage change of the number of hot days is projected to be low during the 2020s, but an increase of 2-9% of days during the 2050s, and 20-23% of days during the 2080s are expected to be hot days (). The Koun Fao station is projected to experience peaks above the average in TX90p, reaching 24% of days during the 2050s and 38% of days during the 2080s under SSP2. Under the SSP5 scenario, the 2020s and 2050s periods are expected to show a relatively negligible and constant change in TX90p, while during the 2080s period, a clear and strong increase in TX90p is projected, averaging between 23 and 29% of days (). The Koun Fao station is expected to experience the highest peak in TX90p, reaching 81% of days under SSP5. Under both SSP2 and SSP5 scenarios, the end of the century (2080s) is projected to exhibit significant warming in TX90p. However, this warming is expected to be even more severe under the SSP5 scenario compared to the SSP2 scenario.
Figure 12. Mean of Number of hot days (TX90p) (%) for the periods 2020s (2011-2040), 2050s (2041-2070), and 2080s (2071-2100) under SSP2 scenario.
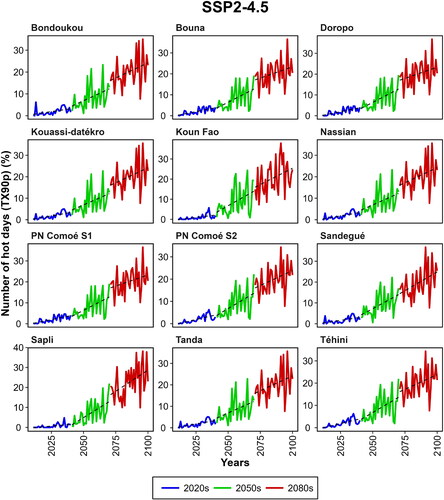
Figure 13. Mean of Number of hot days (TX90p) (%) for the periods 2020s (2011-2040), 2050s (2041-2070), and 2080s (2071-2100) under SSP5 scenario.
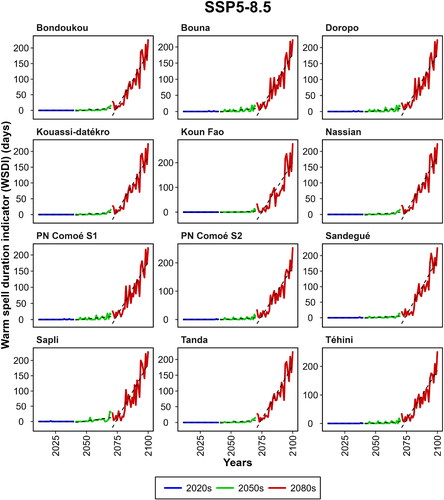
3.9. Future assessment of the Warm Spell Duration Indicator (WSDI)
and depict the projected variation of WSDI under SSP2 and SSP5 scenarios, respectively. The Zanzan region is anticipated to experience a widespread increase in WSDI under the SSP2 scenario. On average, the annual increase in WSDI is projected to be low during the 2020s period; however, a gradual increase of 15 to 20 days during the 2050s period and 50 to 59 days during the 2080s period is projected to be observed in the Zanzan region. The highest peaks in WSDI are projected to occur at PN Comoé S2 during the 2050s period, reaching up to 66 days, and at Sapli during the 2080s period, reaching up to 120 days under SSP2 (). Under the SSP5 scenario, the 2020s and 2050s periods are expected to show a generally constant and relatively negligible evolution in WSDI. However, during the 2080s period, a clear and strong increase in WSDI is projected, averaging between 83 and 85 days per year (). The station of Koun Fao is projected to reach the highest peak in WSDI, reaching 279 days under SSP5. The end of the century (2080s) is expected to exhibit a significant warm spell duration under both SSP2 and SSP5 scenarios. However, this warm spell duration is projected to be even more severe under the SSP5 scenario than under the SSP2 scenario.
Figure 14. Mean of Warm spell duration indicator (WSDI) (day) for the periods 2020s (2011-2040), 2050s (2041-2070), and 2080s (2071-2100) under SSP5 scenario.
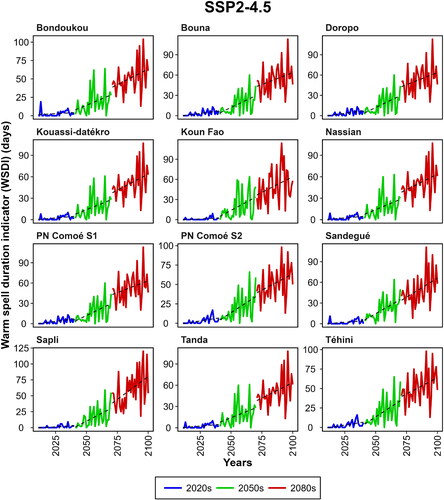
Figure 15. Mean of Warm spell duration indicator (WSDI) (day) for the periods 2020s (2011-2040), 2050s (2041-2070), and 2080s (2071-2100) under SSP5 scenario.
4. Discussion
4.1. Assessment of the bias correction performance
The observed precipitation, Tmax, and Tmin data from various stations in the Zanzan region were used as input data for bias correction of the raw data from different GCMs of the CMIP6. The graphical comparisons after the bias corrections of the ensemble have nearly demonstrated a clear juxtaposition between the observed data and the ensemble bias-corrected precipitation, Tmax, and Tmin. The statistics using evaluation metrics such as NSE, RMSE, PBIAS, and R2 generally showed good performance of the models after the various bias corrections. Compared to other studies, the GCMs models used in this study performed well and were satisfactory. As an example, Yeboah et al. (Citation2022) found that the ensemble bias-corrected Tmax, Tmin, and precipitation showed superior performance compared to the ensemble raw data, as indicated by higher R2, NSE, PBIAS, and lower RMSE values. It is worth mentioning here that this study used the GCMs data from CMIP6, compared to Yeboah et al. (Citation2022) who used CMIP5 data. This better performance difference may be explained by the fact that the resolution of CMIP6 models is higher than that of CMIP5 models, which allows CMIP6 models to better capture the smaller-scale features of the climate system (O'Neill et al., Citation2016). Other studies in the same context as this one, using CMIP6 GCMs like the study by Song et al. (Citation2021), also showed good performance of the GCMs models used. The good performance of the GCMs models after bias corrections can also be credited to the reliability of the input data, specifically the observed data (Siabi et al., Citation2021). In this regard, the observed data used in this study exhibit good quality and have very few missing data. The raw GCMs tended to overestimate both Tmax and Tmin, though they were able to capture some of the monthly variations observed in the data. However, the raw data failed to accurately simulate the observed Tmax and Tmin. This observation is consistent with the results reported by Yeboah et al. (Citation2022). Monthly, the raw GCMs were able to capture the observed precipitation data to a large extent, but the observed precipitation peaks were underestimated. Using the distribution mapping bias correction technique effectively reduced the discrepancies in the raw GCMs, resulting in an improvement in the bias-corrected data. Although some marginal discrepancies still existed, the overall performance of the bias-corrected data was enhanced. The study highlights the importance of robust bias correction techniques in improving the reliability of GCMs outputs for future climate projections. Policymakers and stakeholders are recommended to consider the uncertainties associated with climate projections when developing adaptation and mitigation strategies.
4.2. Changes in future climate projections
In general, a decline in precipitation is projected in the northeast Zanzan region of Côte d‘Ivoire until 2100 under both the SSP2 and SSP5 scenarios. For instance, the overall mean annual precipitation is projected to be 953 mm and 916 mm under the SSP2 and SSP5 scenarios, respectively, in comparison to 1086 mm during the reference period. In terms of percentage change, future monthly precipitation is expected to experience significant declines, except for November to February, especially for the mid-near future period (2050s) and far future period (2080s) under both SSP2 and SSP5 scenarios. It is worth mentioning that the northeastern part of Côte d‘Ivoire, specifically the Zanzan region, experiences a distinct climatic pattern with two distinct rainy seasons occurring from March to June and September to October. These wet periods are separated by dry seasons, and historically, June has been identified as the month with the highest precipitation. Therefore, this study discovers a potential shift in future rainy seasons and also a low potential for rainfall intensity that should be expected during the two rainy seasons in the Zanzan region. In the general context of Côte d‘Ivoire, previous studies by UNDRR and CIMA (Citation2019) and GIZ (Citation2021) had rather highlighted uncertainties in near and far future precipitation projections. These projection uncertainties in these previous studies, unlike in this study, can be explained by the use of projections under the more improved SSPs scenarios (O'Neill et al., Citation2016) in this study, as opposed to the RCPs scenarios used in these previous studies. Additionally, this study was conducted on a smaller scale that only considers the northeastern part of Côte d‘Ivoire. Indeed, the study by Balliet et al. (Citation2016) in the central-west region of Côte d‘Ivoire mentioned a decline in precipitation for the near and far future. For the future monthly variations in precipitation, the study by Soro et al. (Citation2017) on the Bandama basin in Côte d‘Ivoire found a decline in precipitation during the near and far future for December to April. In this previous study, the months of December to April normally coincide with the dry season period, unlike in this study where future precipitation could occur during the currently dry season. However, this study is consistent with that of MINEDD (Citation2020), which had previously mentioned the possibility of an 8% decrease in future precipitation from April to July during the rainy season in Côte d’Ivoire, even though this study reveals that this decrease will be even more significant in the northeastern part of Côte d’Ivoire’s Zanzan region. In the West African context, some studies on the Volta basin also revealed a potential shift in the rainy season period in the future (Dembélé et al., Citation2022; Yeboah et al., Citation2022). The occurrence of extreme weather events is expected to be frequent in the future, especially with the projected decrease in precipitation in the Zanzan region. Indeed, this study has revealed an increase in the number of consecutive dry days (CDD) in the future. For example, under the SSP5 scenario, the variation in CDD could range from 69 to 133 days by 2100. During the historical period from 1981 to 2020, Kouman et al. (Citation2022) estimated that this variation in CDD ranged from 50 to 102 days in the Zanzan region. Previous studies by Yapo et al. (Citation2020) and Bamba et al. (Citation2023) also indicated an increase in CDD in Côte d‘Ivoire in the near future. The CDD index, which is an indicator of drought occurrence in a region, therefore signals a future intensification of drought in the Zanzan region. While the study provides valuable insights, certain limitations must be acknowledged, including its regional focus and the inherent uncertainties in future precipitation projections. Despite these limitations, the discussion enriches the understanding of future climate projections by comparing with previous studies and regional contexts, contributing to the broader discourse on climate change impacts in West Africa. Future research endeavors could focus on refining regional climate models and integrating socio-economic factors to better understand the complex interactions between climate change and human systems.
The general trend for annual mean Tmax and Tmin indicates an increase until 2100 in the Zanzan region under the SSP2 and SSP5 scenarios. For example, in this region, Tmax is projected to increase by +3 °C and +4.8 °C by 2100 under SSP2 and SSP5, respectively, and Tmin by +3.3 °C under both scenarios compared to the reference period. In terms of monthly average variation, all months are expected to experience a progressive increase in Tmin and Tmax under SSP2 and SSP5, generally in the Zanzan region by 2100, where months like November and December are expected to be very hot. In the general context of Côte d‘Ivoire under the previous RCPs scenarios, studies by GIZ (Citation2021) and UNDRR and CIMA (Citation2019) indicated that the country could expect a rise in temperature in the future under both medium and high emission scenarios. Specifically, in the Bandama Basin in Côte d‘Ivoire, the study by MINSEDD (Citation2017) showed an increase of +1.2 °C in Tmin and +1.7 °C in Tmax by 2025 under the RCP8.5 scenario. Balliet et al. (Citation2016) in the central-west region of Côte d‘Ivoire and Bigot et al. (Citation2022) in the southeastern region of Côte d‘Ivoire also highlighted these trends of future temperature increase. The projected change estimated by the GCMs under the two scenarios is in line with the results of the Intergovernmental Panel on Climate Change (IPCC). According to the IPCC (Citation2001), a doubling of atmospheric CO2 concentration could lead to a notable increase in global temperatures, ranging from 1.4 °C to 5.8 °C by the end of the 21st century. This temperature rise is anticipated to have substantial implications for the environment. The increase in temperature in the Zanzan region will also lead to extreme weather conditions. The extreme temperature indices Number of Hot Days (TX90p) and Warm Spell Duration Indicator (WSDI) will progressively increase in the Zanzan region. The meteorological drought index incorporating precipitation and temperature parameters, the SPEI, has shown that the Zanzan region is projected to be predominantly affected by severe droughts under SSP2 during the 2050s and 2080s periods, evolving from moderate to severe under SSP5 by 2100. Under these extreme conditions, future agricultural production, which constitutes the primary economic livelihood for the local population, could experience a substantial decline in the region. In Côte d‘Ivoire, studies by Yapo et al. (Citation2019) and GIZ (Citation2021) have suggested a possibility of increasing hot spells such as TX90p in the future. This study aligns with these previous studies and specifies that the specific case of northeastern Côte d‘Ivoire could be even more concerning because the variation in TX90p, which was between 4.84% and 14.56% of days during the historical period of 1981-2020 in the region according to Kouman et al. (Citation2022), could reach an average of 29% of days by 2100 under the SSP5 scenario. In the West African sub-region, studies by IPCC (Citation2012), Niang et al. (Citation2014), Todzo et al. (Citation2020), and Diba et al. (Citation2022) have demonstrated the increase in future warm spells and the probability of intensifying droughts that are expected to continue until the end of the 21st century. Several explanatory factors such as global climate change, land use changes, and natural variability are likely to be responsible for the future decrease in precipitation and increase in temperatures in the Zanzan region, which is part of the global context of Côte d’Ivoire and West Africa. The IPCC has indicated that the rise in concentrations of greenhouse gases (GHGs) in the atmosphere is the main cause of climate change, which is resulting in global warming and shifts in precipitation patterns on a global scale. According to the IPCC (Citation2021) report, West Africa, including Côte d‘Ivoire, is anticipated to undergo a temperature increase and a decrease in precipitation in the future due to climate change. Changes in land use, such as urbanization and deforestation, can impact local and regional climates by modifying surface albedo, water availability, and atmospheric aerosol concentrations. Deforestation, for instance, can affect rainfall and temperature by altering land surface energy balance and evapotranspiration rates. In Côte d‘Ivoire, land use changes due to the expansion of cocoa and coffee plantations have been associated with alterations in precipitation patterns and higher temperatures, as stated by N’guessan et al. (Citation2019). MINEDD (Citation2020) reported that the forest cover in Côte d‘Ivoire has drastically reduced from 13 million hectares during the colonial era to less than two million hectares at present. Variations in climate patterns in West Africa, including Côte d‘Ivoire, can also be influenced by natural variability such as El Niño Southern Oscillation (ENSO) and the Atlantic Multi-decadal Oscillation (AMO). ENSO has been associated with decreased rainfall in West Africa, while the AMO has been associated with changes in the frequency and strength of the West African monsoon rains (Funk et al., Citation2008). The projected increase in temperature and decrease in precipitation underscore the urgent need for adaptation and mitigation measures in the Zanzan region. Recommendations include the development of climate-resilient agriculture practices, investment in water management infrastructure, and the implementation of early warning systems to mitigate the impacts of extreme weather events. Future research should focus, in addition to integrating socio-economic factors into projections, on evaluating the effectiveness of adaptation strategies in the region.
5. Potential implication of the study in the Zanzan region
The projections of the Sixth Assessment Report (AR6) of the IPCC indicated that global temperatures are expected to increase by 2.1 °C to 3.5 °C under the SSP2 scenario and by 3.3 °C to 5.7 °C under the SSP5 scenario by the end of the 21st century, with significant environmental impacts (IPCC, Citation2021). The study by GIZ (Citation2021) also estimated a temperature increase of 1.7 °C to 3.7 °C in Côte d‘Ivoire by 2080 under the RCPs scenarios. The results of this study are in line with the trends of previous studies, followed by a significant decrease in precipitation that is expected in the region under study. The findings of this study may have potential implications for the natural environment, as well as related sectors such as socio-economics, water resources, agriculture, energy, and human health. For instance, changes in climate in Africa are expected to impact water quantity and quality, which, in turn, affects lakes, river storage, reservoirs, and aquifers (IPCC, Citation2007; Obahoundje et al., Citation2017). Furthermore, the energy sector, particularly hydroelectric power, which is sensitive to climate change, will be affected by changes in water resources and climate variability (Akpoti et al., Citation2016; Obahoundje et al., Citation2017; Siabi et al., Citation2023). The vulnerability of the agricultural sector will be even more pronounced with climate change, thus posing a threat to food security (Akpoti et al., Citation2019), especially in West Africa. The Zanzan region in the northeast of Côte d‘Ivoire is one of the least industrialized regions of the country and relies solely on income from agriculture. Its main cash crop is cashew nuts and crops such as yam and maize are major food crops that directly serve to feed the population. Cashew nuts require a dry and warm climate to grow and mature, but prolonged droughts and high temperatures can negatively impact their growth and yield. A study by Rupa et al. (Citation2013) found that cashew nut yields are significantly affected by drought, particularly during the flowering and fruiting stages of growth. High temperatures during the flowering stage can pose a significant challenge for cashew farming. To avoid compromising the cashew tree’s flowering and fruiting, it is essential to maintain temperatures below 32 °C. Temperatures beyond this threshold value can lead to scalding and flower abortion, which may drastically decrease cashew fruiting (Vaz Milheiro & Neves, Citation1994). Therefore, the expected decrease in rainfall and increase in temperatures in the Zanzan region could have a significant negative impact on the growth and production of cashew nuts. Yam and maize are both rainfed crops, which means they rely heavily on rainfall for their growth and development. Studies have shown that a decrease in rainfall, coupled with increased temperatures, can significantly reduce the yield of these crops (Jones & Thornton, Citation2003; Srivastava et al., Citation2015). In particular, yam is a very sensitive crop to changes in temperature and rainfall, and any significant variation in these climatic factors can lead to a reduction in yield and quality. The decline in precipitation will have an adverse effect on water resources in the area, with implications for domestic, irrigation, and industrial water supply. This will increase the water scarcity already experienced by the region, and people may be compelled to rely on potentially contaminated water sources for consumption. This will raise the likelihood of water-related illnesses. The expected changes in climate will have an impact on Côte d‘Ivoire’s hydropower sector. Currently, the sector contributes to approximately 60% of the country’s electricity production (IEA, Citation2021). However, the decline in rainfall and water availability will lead to decreased capacity of hydroelectric power plants, and the production of electricity will become more expensive. The rising temperature and declining rainfall patterns will harm the health of the people in the area. The increase in the occurrence of heatwaves and droughts can cause health problems such as dehydration, heat stress, and other related issues. Similarly, the changes in rainfall patterns can lead to a higher risk of waterborne and vector-borne diseases.
6. Conclusion
In the investigation of future climate conditions in the Zanzan region, CMIP6 GCMs data underwent rigorous evaluation, demonstrating alignment with observed precipitation, Tmax, and Tmin after statistical bias correction. The ensuing analysis revealed an overall decline in precipitation in the Zanzan region by 2100 under SSP2-4.5 and SSP5-8.5 scenarios. Notably, future precipitation patterns indicated a potential shift toward the current dry season (November to February) and significant decreases during the current rainy season (March to June). Additionally, both SSP2-4.5 and SSP5-8.5 scenarios indicate a future increase in Tmin and Tmax, with a more pronounced rise under SSP5-8.5 by 2100. These anticipated trends, marked by reduced precipitation and increased temperatures, are indicative of impending extreme climate conditions and heightened drought in the Zanzan region.
Meteorological droughts, identified through the SPEI index, are forecasted to intensify significantly in the Zanzan region, particularly in the 2050s and 2080s under both SSP2-4.5 and SSP5-8.5 scenarios. The observed rise in consecutive dry days (CDD) by the end of the 21st century further substantiates this impending intensification of meteorological drought. Additionally, extreme temperatures, such as TX90p and WSDI, are projected to increase, particularly during the 2080s, exacerbating the aridity.
These future climatic projections pose considerable threats to the Zanzan region’s economy, heavily reliant on rainfed agriculture. The study foresees a substantial risk to water resources, compounding the existing vulnerabilities of the region. The implications extend to heightened health risks for the population. Urgent planning measures are imperative for the Zanzan region, necessitating prompt consideration by decision-makers. The insights garnered from this study contribute to heightened awareness, emphasizing the pressing need for well-defined adaptation and mitigation strategies. These strategies should encompass the adoption of climate-resilient farming techniques, advancements in water conservation technologies, and the implementation of measures to alleviate the impact of climate change on human health in the Zanzan region of Côte d‘Ivoire.
Supplementary materials clean.docx
Download MS Word (11.6 MB)Acknowledgment
The authors would like to express their gratitude to the Regional Centre for Energy and Environmental Sustainability (RCEES) for their support and contribution to this research.
Disclosure statement
No potential conflict of interest was reported by the author(s).
References
- Abubakar, I. U., & Yamusa, M. A. (2013). Recurrence of drought in Nigeria: Causes, effects and mitigation. International Journal of Agriculture and Food Science Technology, 4(3), 169–180. [Mismatch
- Akpoti, K., Antwi, E. O., & Kabo-Bah, A. T. (2016). Impacts of rainfall variability, land use and land cover change on stream flow of the Black Volta basin, West Africa. Hydrology, 3(3), 26. https://doi.org/10.3390/hydrology3030026
- Akpoti, K., Groen, T., Dossou-Yovo, E., Kabo-Bah, A. T., & Zwart, S. J. (2022). Climate change-induced reduction in agricultural land suitability of West-Africa’s inland valley landscapes. Agricultural Systems, 200, 103429. https://doi.org/10.1016/j.agsy.2022.103429
- Akpoti, K., Kabo-Bah, A. T., & Zwart, S. J. (2019). Agricultural land suitability analysis: State-of-the-art and outlooks for integration of climate change analysis. Agricultural Systems, 173, 172–208. https://doi.org/10.1016/j.agsy.2019.02.013
- Alexander, L., & Herold, N. (2016). Climpact2 indices and software, the University of South Wales, Sidney, Australia. https:github.com/ARCCSSextremes/climpact2.
- Andrade, C. W. L., Montenegro, S. M. G. L., Montenegro, A. A. A., Lima, J. R. d. S., Srinivasan, R., & Jones, C. A. (2021). Climate change impact assessment on water resources under RCP scenarios: A case study in Mundaú River Basin, Northeastern Brazil. International Journal of Climatology, 41(S1), 1045–1061. https://doi.org/10.1002/joc.6751
- Ankrah, J., Monteiro, A., & Madureira, H. (2023). Spatiotemporal characteristics of meteorological drought and wetness events across the coastal Savannah agroecological zone of Ghana. Water, 15(1), 211. https://doi.org/10.3390/w15010211
- Balliet, R., Saley, B. M., Eba, A. E. L., Aké, G. E., Sorokoby, V. M., Kouakou, Y. E., & N’Dri, A. A. (2016). Comportement du climat futur en Côte d’Ivoire: cas de la région du Gôh centre-ouest de la Côte d’Ivoire. International Journal of Innovation and Scientific Research, 25(1), 220–234.
- Bamba, A., Toure, N. E., Kouadio, K., Ahoua, S. A. A., Kouakou, D. V. M., Yoroba, F., M’Bo, K., Cherif, M., Kone, D., & Diedhiou, A. (2023). Contribution of climate scenarios RCP4.5 and RCP8.5 to the study of climate change impacts on cocoa farming in Côte d’Ivoire. Atmospheric and Climate Sciences, 13(01), 84–101. https://doi.org/10.4236/acs.2023.131007
- Bi, D., Dix, M., Marsland, S., O’Farrell, S., Sullivan, A., Bodman, R., Law, R., Harman, I., Srbinovsky, J., Rashid, H. A., Dobrohotoff, P., Mackallah, C., Yan, H., Hirst, A., Savita, A., Dias, F. B., Woodhouse, M., Fiedler, R., & Heerdegen, A. (2020). Configuration and spin-up of ACCESS-CM2, the new generation Australian Community Climate and Earth System Simulator Coupled Model. Journal of Southern Hemisphere Earth Systems Science, 70(1), 225–251. https://doi.org/10.1071/ES19040
- Bigot, S., Dumas, D., Brou, T. Y., Noufe, D. D., Dibi, P., N’da, K. C., Houphlet, S. D. K., Munoz, F., Diedhiou, A., & Cilas, C. (2022 Projections climatiques CMIP6 à l’échelle du sud-est de la Côte d’Ivoire: évolution des contraintes thermo-pluviométriques pour les principaux agrosystèmes associant cacao, hévéa, palmier à huile et manioc [Paper presentation]. 35ème Colloque Annuel de L’Association Internationale de Climatologie – AIC 2022.
- Bisht, D. S., Mohite, A. R., Jena, P. P., Khatun, A., Chatterjee, C., Raghuwanshi, N. S., Singh, R., & Sahoo, B. (2020). Impact of climate change on streamflow regime of a large Indian river basin using a novel monthly hybrid bias correction technique and a conceptual modeling framework. Journal of Hydrology, 590(June), 125448. https://doi.org/10.1016/j.jhydrol.2020.125448
- Brou, Y. T., Akindès, F., & Bigot, S. (2005). La variabilité climatique en Côte d’Ivoire : entre perceptions sociales et réponses agricoles. Cahiers Agricultures, 14(6), 533–540.
- Cook, B. I., Mankin, J. S., Marvel, K., Williams, A. P., Smerdon, J. E., & Anchukaitis, K. J. (2020). Twenty-first century drought projections in the CMIP6 forcing scenarios. Earth’s Future, 8(6), 1–20. https://doi.org/10.1029/2019EF001461
- de Carvalho, J. W. L. T., Iensen, I. R. R., & dos Santos, I. (2021). Resilience of hydrologic similarity areas to extreme climate change scenarios in an urban watershed. Urban Water Journal, 18(10), 817–828. https://doi.org/10.1080/1573062X.2021.1941136
- Dembélé, M., Vrac, M., Ceperley, N., Zwart, S. J., Larsen, J., Dadson, S. J., Mariéthoz, G., & Schaefli, B. (2022). Contrasting changes in hydrological processes of the Volta River basin under global warming. Hydrology and Earth System Sciences, 26(5), 1481–1506. https://doi.org/10.5194/hess-26-1481-2022
- Diba, I., Diedhiou, A., Famien, A. M., Camara, M., & Fotso-Nguemo, T. C. (2022). Changes in compound extremes of rainfall and temperature over West Africa using CMIP5 simulations. Environmental Research Communications, 4(10), 105003. https://doi.org/10.1088/2515-7620/ac9aa7
- Diomandé, M., Akpa, L., Ouattara, A. L.-Y., Kpan, G. O., Koffi, A., Yao, B. K., Yapi, A. F., Soro, D., Agbri, L., & Biémi, J. (2023). Climate and agriculture in Côte D’ivoire: Perception and quantification of the impact of climate change on cocoa production by 2050. International Journal of Environment and Climate Change, 13(6), 328–344. https://doi.org/10.9734/ijecc/2023/v13i61832
- Dje, K. B., Ochou, A. D., Kouadio, Z. A., & Coulibaly, A. K. (2018). Impacts of El Nino on Rainfall and Its Agrocltmatic Incidences in the Zanzan Region: North-East of Cote d’ Ivoire. Geosciences Research, 3(2), 9–20. https://doi.org/10.22606/gr.2018.32001
- Dje, K. B. (2014). Document de stratégie du Programme National Changement Climatique (2015-2020) [Paper presentation]. Annexes; Ministère de L’Environnement, de la Salubrité Urbaine et du Développement Durable (MESUDD), Abidjan, Côte d’Ivoire. 84.
- Dje, K. B., Nguessan, K. R., & Kouadio, K. J. (2014). Conditions de la sécheresse et stratégies de leur gestion en Côte d’Ivoire. 1–6. https://www.droughtmanagement.info/wp-content/uploads/2016/10/WS6-Cote-DIvoire_FR.pdf
- Eyring, V., Bony, S., Meehl, G. A., Senior, C. A., Stevens, B., Stouffer, R. J., & Taylor, K. E. (2016). Overview of the Coupled Model Intercomparison Project Phase 6 (CMIP6) experimental design and organization. Geoscientific Model Development, 9(5), 1937–1958. https://doi.org/10.5194/gmd-9-1937-2016
- Ezéchiel, O., Eric, A. A., Josué, Z. E., Eliézer, B. I., & Amédée, C. (2016). Comparative study of seven bias correction methods applied to three Regional Climate Models in Mekrou catchment (Benin, West Africa). International Journal of Current Engineering and Technology, 6(5), 1831–1840.
- FAO, ICRISAT, & CIAT. (2018). Climate-smart agriculture in Côte d’Ivoire (p. 23). CSA Country Profiles for Africa Series. International Center for Tropical Agriculture (CIAT); International Crops Research Institute for the Semi-Arid Tropics (ICRISAT); Food and Agriculture Organization of the United Nations (FAO).
- Faye, C. (2022). Comparative analysis of meteorological drought based on the SPI and SPEI indices. HighTech and Innovation Journal, 3, 15–27. https://doi.org/10.28991/HIJ-SP2022-03-02
- Faye, C., Ndiaye, A., & Mbaye, I. (2017). Une évaluation comparative des séquences de sécheresse météorologique par indices, par échelles de temps et par domaines climatiques au Sénégal. Journal of Water and Environmental Sciences, 1(1), 11–28.
- Funk, C., Dettinger, M. D., Michaelsen, J. C., Verdin, J. P., Brown, M. E., Barlow, M., & Hoell, A. (2008). Warming of the Indian Ocean threatens eastern and southern African food security but could be mitigated by agricultural development. Proceedings of the National Academy of Sciences of the United States of America, 105(32), 11081–11086. https://doi.org/10.1073/pnas.0708196105
- GIZ. (2021). Profil de risque climatique : Côte d’Ivoire. https://www.adaptationcommunity.net/wp-content/uploads/2021/02/GIZ_Climate-Risk-Profile-Cote-dIvoire_FR_08.pdf
- IEA. (2021). Côte d’Ivoire energy outlook. https://www.iea.org/reports/cote-d-ivoire-energy-outlook.
- IPCC. (2001). The scientific basis. Contribution of working group I to the third assessment report of the intergovernmental panel on climate change (p. 881) [J. T. Houghton, Y. Ding, D. J. Griggs, M. Noquer, P. J. van der Linden, X. Dai, K. Maskell, & C. A. Johnson (eds)]. Cambridge University Press.
- IPCC. (2007). Climate change 2007: Synthesis report. Contribution of working groups I, II and III to the fourth assessment report of the intergovernmental panel on climate change [Core Writing Team, R. K. Pachauri, & A. Reisinger (Eds.)]. IPCC.
- IPCC. (2012). Managing the risks of extreme events and disasters to advance climate change adaptation. A special report of working groups I and II of the intergovernmental panel on climate change. [C. B. Field, V. Barros, T. F. Stocker, D. Qin, D. J. Dokken, K. L. Ebi, M. D. Mastrandrea, K. J. Mach, G.-K. Plattner, S. K. Allen, M. Tignor, & P. M. Midgley (Eds)]. Cambridge University Press. 582p. https://doi.org/10.1017/CBO9781139177245.009
- IPCC. (2021). Climate change 2021: The physical science basis. Contribution of working group I to the sixth assessment report of the intergovernmental panel on climate change [V. Masson-Delmotte, P. Zhai, A. Pirani, S. L. Connors, C. Péan, S. Berger, N. Caud, Y. Chen (Eds)]. IPCC.
- Jenkins, K., & Warren, R. (2014). Quantifying the impact of climate change on drought regimes using the Standardised Precipitation Index. Theoretical and Applied Climatology, 120(1–2), 41–54. https://doi.org/10.1007/s00704-014-1143-x
- Jones, P. G., & Thornton, P. K. (2003). The potential impacts of climate change on maize production in Africa and Latin America in 2055. Global Environmental Change, 13(1), 51–59. https://doi.org/10.1016/S0959-3780(02)00090-0
- Kouman, K. D., Kabo-Bah, A. T., Kouadio, B. H., & Akpoti, K. (2022). Spatio-temporal trends of precipitation and temperature extremes across the north-east region of Côte d’Ivoire over the period 1981-2020. Climate, 10(5), 74. https://doi.org/10.3390/cli10050074
- Kumar, P., Geneletti, D., & Nagendra, H. (2016). Spatial assessment of climate change vulnerability at city scale: A study in Bangalore, India. Land Use Policy, 58, 514–532. https://doi.org/10.1016/j.landusepol.2016.08.018
- Masih, I., Maskey, S., Mussá, F. E. F., & Trambauer, P. (2014). A review of droughts in the African continent: a geospatial and long-term perspective. Hydrology and Earth System Sciences Discussions, 11, 2679–2718. https://doi.org/10.5194/hessd-11-2679-2014
- Mauritsen, T., Bader, J., Becker, T., Behrens, J., Bittner, M., Brokopf, R., Brovkin, V., Claussen, M., Crueger, T., Esch, M., Fast, I., Fiedler, S., Fläschner, D., Gayler, V., Giorgetta, M., Goll, D. S., Haak, H., Hagemann, S., Hedemann, C., … Roeckner, E. (2019). Developments in the MPI-M Earth System Model version 1.2 (MPI-ESM1.2) and its response to increasing CO2. Journal of Advances in Modeling Earth Systems, 11(4), 998–1038. https://doi.org/10.1029/2018MS001400
- McMichael, A. J. (2001). Impact of climatic and other environmental changes on food production and population health in the coming decades. The Proceedings of the Nutrition Society, 60(2), 195–201. https://doi.org/10.1079/PNS200090
- MINEDD. (2020). Plan national sécheresse de Côte d’Ivoire 2021–2025 (p. 143). Ministère de l’Environnement et du Developpement durable.
- MINSEDD. (2017). Rapport de la troisième communication nationale (TCN) de la Côte d’Ivoire dans le cadre de la convention cadre des nations unies sur les changements climatiques (CCNUCC) (p. 132). Ministère de la Salubrité de l’Environnement et du Développement Durable.
- Müller, W. A., Jungclaus, J. H., Mauritsen, T., Baehr, J., Bittner, M., Budich, R., Bunzel, F., Esch, M., Ghosh, R., Haak, H., Ilyina, T., Kleine, T., Kornblueh, L., Li, H., Modali, K., Notz, D., Pohlmann, H., Roeckner, E., Stemmler, I., Tian, F., & Marotzke, J. (2018). A higher-resolution version of the Max Planck Institute Earth System Model (MPI-ESM1.2-HR). Journal of Advances in Modeling Earth Systems, 10(7), 1383–1413. https://doi.org/10.1029/2017MS001217
- N’guessan, K. A., Kouassi, K. A., Kouassi, A. M., & Yao, S. S. (2019). Impact of land use changes on temperature and precipitation in the South-East of Côte d’Ivoire. African Journal of Environmental Science and Technology, 13(4), 119–127.
- Nash, J. E., & Sutcliffe, J. V. (1970). River flow forecasting through conceptual models part I - A discussion of principles. Journal of Hydrology, 10(3), 282–290. https://doi.org/10.1016/0022-1694(70)90255-6
- Niang, I., Ruppel, O. C., Abdrabo, M. A., Essel, A., Lennard, C., Padgham, J., & Urquhart, P. (2014). Africa. In V. R. Barros, C. B. Field, D. J. Dokken, M. D. Mastrandrea, K. J. Mach, T. E. Bilir, M. Chatterjee, K. L. Ebi, Y. O. Estrada, R. C. Genova, B. Girma, E. S. Kissel, A. N. Levy, S. MacCracken, P. R. Mastrandrea, & L. L. White (Eds.). Climate change 2014: Impacts, adaptation, and vulnerability. Part B: Regional aspects. Contribution of working group II to the fifth assessment report of the intergovernmental panel on climate change (pp. 1199–1265). Cambridge University Press, Cambridge, United Kingdom and New York, NY, USA.
- Noufé, D., Kouadio, Z. A., Soro, G. E., Wayou, T. P., Goula, B. T. A., & Savané, I. (2015). Impact de la variabilité climatique sur la production du maïs et de l’igname en Zones Centre et Nord de la Côte d’Ivoire. Agronomie Africaine, 27(3), 241–255.
- Obahoundje, S., Ofosu, E. A., Akpoti, K., & Kabo-Bah, A. T. (2017). Land use and land cover changes under climate uncertainty: Modelling the impacts on hydropower production in Western Africa. Hydrology, 4(1), 2. https://doi.org/10.3390/hydrology4010002
- O'Neill, B. C., Tebaldi, C., van Vuuren, D. P., Eyring, V., Friedlingstein, P., Hurtt, G., Knutti, R., Kriegler, E., Lamarque, J.-F., Lowe, J., Meehl, G. A., Moss, R., Riahi, K., & Sanderson, B. M. (2016). The scenario model intercomparison project (ScenarioMIP) for CMIP6. Geoscientific Model Development, 9(9), 3461–3482. https://doi.org/10.5194/gmd-9-3461-2016
- Rathjens, H., Bieger, K., Srinivasan, R., Chaubey, I., & Arnold, J. G. (2016). CMhyd user manual documentation for preparing simulated climate change data for hydrologic impact studies. Texas. 16p.
- Riahi, K., van Vuuren, D. P., Kriegler, E., Edmonds, J., O’Neill, B. C., Fujimori, S., Bauer, N., Calvin, K., Dellink, R., Fricko, O., Lutz, W., Popp, A., Cuaresma, J. C., Kc, S., Leimbach, M., Jiang, L., Kram, T., Rao, S., Emmerling, J., … Tavoni, M. (2016). The Shared Socioeconomic Pathways and their energy, land use, and greenhouse gas emissions implications : An overview. Global Environmental Change, 42, 153–168. https://doi.org/10.1016/j.gloenvcha.2016.05.009
- Rupa, T. R., Rejani, R., & Bhat, M. G. (2013). Impact of climate change on cashew and adaptation strategies. In Climate-resilient horticulture: Adaptation and mitigation strategies (pp. 189–198). https://doi.org/10.1007/978-81-322-0974-4
- Santé, N., N’Go, Y. A., Soro, G. E., Meledje, N. H., & Bi, T. A. G. (2019). Characterization of meteorological droughts occurrences in Côte d’Ivoire: Case of the Sassandra Watershed. Climate, 7, 60. https://doi.org/10.3390/cli7040060
- Savané, I., Coulibaly, K. M., & Gioan, P. (2001). Variabilité climatique et ressources en eaux souterraines dans la région semi- montagneuse de Man. Sécheresse, 4(12), 231–237.
- Siabi, E. K., Awafo, E. A., Kabo-Bah, A. T., Derkyi, N. S. A., Akpoti, K., Mortey, E. M., & Yazdanie, M. (2023). Assessment of Shared Socioeconomic Pathway (SSP) climate scenarios and its impacts on the Greater Accra region. Urban Climate, 49, 101432. https://doi.org/10.1016/j.uclim.2023.101432
- Siabi, E. K., Kabobah, A. T., Akpoti, K., Anornu, G. K., Amo-Boateng, M., & Nyantakyi, E. K. (2021). Statistical downscaling of global circulation models to assess future climate changes in the Black Volta basin of Ghana. Environmental Challenges, 5, 100299. https://doi.org/10.1016/j.envc.2021.100299
- Sobie, S. R., Zwiers, F. W., & Curry, C. L. (2021). Climate model projections for Canada: A comparison of CMIP5 and CMIP6. Atmosphere-Ocean, 59(4–5), 269–284. https://doi.org/10.1080/07055900.2021.2011103
- Song, Z., Xia, J., She, D., Li, L., Hu, C., & Hong, S. (2021). Assessment of meteorological drought change in the 21st century based on CMIP6 multi-model ensemble projections over mainland China. Journal of Hydrology, 601, 126643. https://doi.org/10.1016/j.jhydrol.2021.126643
- Soro, G. E., Anouman, G. L. D., Goula Bi, T. A., Srohorou, B., & Savane, I. (2014). Caractérisation des séquences de Sécheresse météorologique à diverses échelles de temps en climat de type soudanais: cas de l’extrême nord-ouest de la Côte d’Ivoire. Larhyss Journal, 18, 107–124.
- Soro, G., Yao, A., Kouame, Y., & Bi, T. (2017). Climate change and its impacts on water resources in the Bandama basin, Côte D’ivoire. Hydrology, 4(1), 18. https://doi.org/10.3390/hydrology4010018
- Srivastava, A. K., Gaiser, T., & Ewert, F. (2015). Climate change impact and potential adaptation strategies under alternate climate scenarios for yam production in the sub-humid savannah zone of West Africa. Mitigation and Adaptation Strategies for Global Change, 21(6), 955–968. https://doi.org/10.1007/s11027-015-9639-y
- Swart, N. C., Cole, J. N. S., Kharin, V. V., Lazare, M., Scinocca, J. F., Gillett, N. P., Anstey, J., Arora, V., Christian, J. R., Hanna, S., Jiao, Y., Lee, W. G., Majaess, F., Saenko, O. A., Seiler, C., Seinen, C., Shao, A., Sigmond, M., Solheim, L., … Winter, B. (2019). The Canadian Earth System Model version 5 (CanESM5.0.3). Geoscientific Model Development, 12(11), 4823–4873. https://doi.org/10.5194/gmd-12-4823-2019
- Sylla, M. B., Nikiema, P. M., Gibba, P., & Kebe, I. (2016). Climate change over West Africa: Recent trends and future projections. Springer Nature. https://doi.org/10.1007/978-3-319-31499-0
- Tebaldi, C., Debeire, K., Eyring, V., Fischer, E., Fyfe, J., Friedlingstein, P., Knutti, R., Lowe, J., O'Neill, B., Sanderson, B., van Vuuren, D., Riahi, K., Meinshausen, M., Nicholls, Z., Tokarska, K. B., Hurtt, G., Kriegler, E., Lamarque, J.-F., Meehl, G., … Ziehn, T. (2021). Climate model projections from the Scenario Model Intercomparison Project (ScenarioMIP) of CMIP6. Earth System Dynamics, 12(1), 253–293. https://doi.org/10.5194/esd-12-253-2021
- Teutschbein, C., & Seibert, J. (2012). Bias correction of regional climate model simulations for hydrological climate-change impact studies : Review and evaluation of different methods. Journal of Hydrology, 456-457, 12–29. https://doi.org/10.1016/j.jhydrol.2012.05.052
- Todzo, S., Bichet, A., & Diedhiou, A. (2020). Intensification of the hydrological cycle expected in West Africa over the 21st century. Earth System Dynamics, 11(1), 319–328. https://doi.org/10.5194/esd-11-319-2020
- Traore, S. B., Ali, A., Tinni, S. H., Samake, M., Garba, I., Maigari, I., Alhassane, A., Samba, A., Diao, M. B., Atta, S., Dieye, P. O., Nacro, H. B., & Bouafou, K. G. M. (2014). AGRHYMET : A drought monitoring and capacity building center in the West Africa Region. Weather and Climate Extremes, 3, 22–30. https://doi.org/10.1016/j.wace.2014.03.008
- UNDRR & CIMA. (2019). Côte d’Ivoire disaster risk profil. UNDRR & CIMA.
- Vaz Milheiro, A., & Neves, E. (1994). Manual Do Cajueiro. Cultivar-Associação de Técnicos de Culturas Tropicais; Cultivar-Associação de Técnicos de Culturas Tropicais.
- Volodin, E., & Gritsun, A. (2018). Simulation of observed climate changes in 1850–2014 with climate model INM-CM5. Earth System Dynamics, 9(4), 1235–1242. https://doi.org/10.5194/esd-9-1235-2018
- Xin, X., Wu, T., Zhang, J., Yao, J., & Fang, Y. (2020). Comparison of CMIP6 and CMIP5 simulations of precipitation in China and the East Asian summer monsoon. International Journal of Climatology, 40(15), 6423–6440. https://doi.org/10.1002/joc.6590
- Yapo, A. L. M., Diawara, A., Kouassi, B. K., Yoroba, F., Sylla, M. B., Kouadio, K., Tiémoko, D. T., Koné, D. I., Akobé, E. Y., & Yao, K. P. A. T. (2020). Projected changes in extreme precipitation intensity and dry spell length in Côte d’Ivoire under future climates. Theoretical and Applied Climatology, 140(3–4), 871–889. https://doi.org/10.1007/s00704-020-03124-4
- Yapo, A. L. M., Diawara, A., Yoroba, F., Kouassi, B. K., Sylla, M. B., Kouadio, K., Odoulami, R. C., & Tiémoko, D. T. (2019). Twenty-first century projected changes in extreme temperature over Côte d’Ivoire (West Africa). International Journal of Geophysics, 2019, 1–19. https://doi.org/10.1155/2019/5610328
- Yeboah, K. A., Akpoti, K., Kabo-Bah, A. T., Ofosu, E. A., Siabi, E. K., Mortey, E. M., & Okyereh, S. A. (2022). Assessing climate change projections in the Volta Basin using the CORDEX-Africa climate simulations and statistical bias-correction. Environmental Challenges, 6, 100439. https://doi.org/10.1016/j.envc.2021.100439
- Zhang, B., Shrestha, N. K., Daggupati, P., Rudra, R., Shukla, R., Kaur, B., & Hou, J. (2018). Quantifying the impacts of climate change on streamflow dynamics of two major rivers of the Northern Lake Erie Basin in Canada. Sustainability, 10(8), 2897. https://doi.org/10.3390/su10082897
- Zhiña, D., Montenegro, M., Montalván, L., Mendoza, D., Contreras, J., Campozano, L., & Avilés, A. (2019). Climate change influences of temporal and spatial drought variation in the Andean high mountain basin. Atmosphere, 10(9), 558. https://doi.org/10.3390/atmos10090558
- Zhu, H., Jiang, Z., Li, J., Li, W., Sun, C., & Li, L. (2020). Does CMIP6 inspire more confidence in simulating climate extremes over China? Advances in Atmospheric Sciences, 37(10), 1119–1132. https://doi.org/10.1007/s00376-020-9289-1
- Ziehn, T., Chamberlain, M. A., Law, R. M., Lenton, A., Bodman, R. W., Dix, M., Stevens, L., Wang, Y., & Srbinovsky, J. (2020). The Australian Earth System Model: ACCESS-ESM1. 5. Journal of Southern Hemisphere Earth Systems Science, 70(1), 193–214. https://doi.org/10.1071/ES19035
Appendix
Figure A1. Bias correction approach applied in the CMhyd software.
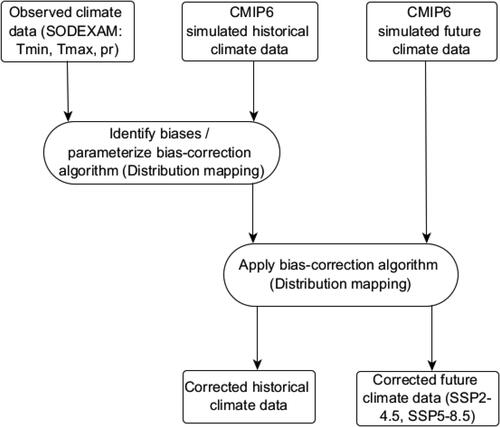
Figure A2. Comparison of raw and bias-corrected precipitation ensemble with respect to observed data.
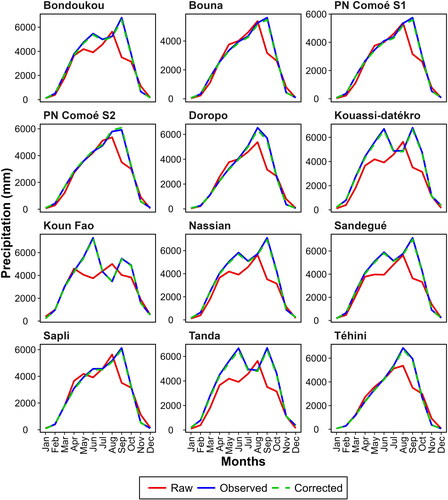
Figure A3. Comparison of raw and bias-corrected Tmax ensemble with respect to observed data.
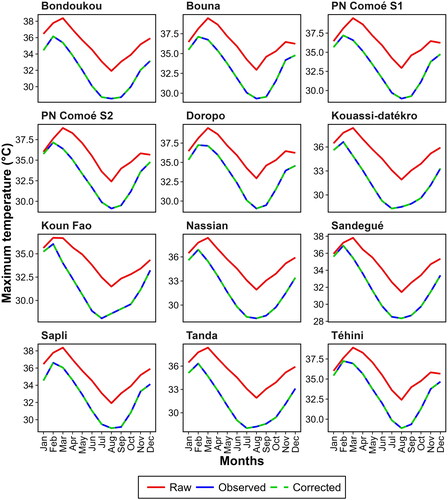
Figure A4. Temporal variability in annual mean Tmin between 1981 and 2100 for the SSP2-4.5 and SSP5-8.5 scenarios.
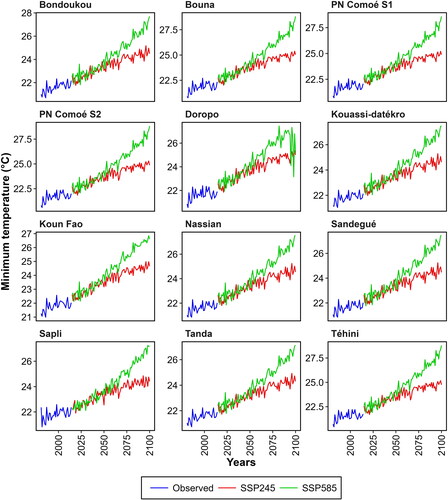
Figure A5. Mean monthly change of precipitation (%) for the periods 2020s (2011-2040), 2050s (2041-2070), and 2080s (2071-2100) relative to 1981-2010 for the ground stations under SSP2-4.5.
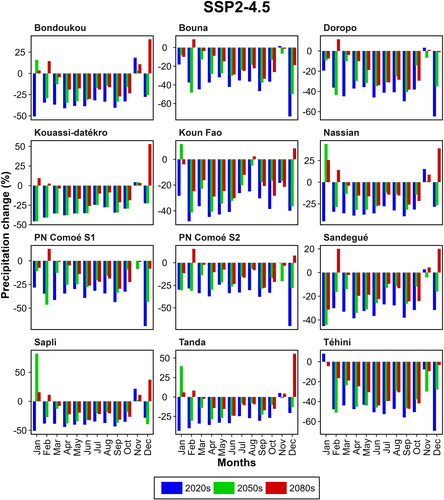
Table A1. Geolocation of ground-based stations.
Table A2. Standardized precipitation evapotranspiration index (SPEI) categories.
Table A3. Mean precipitation changes for the periods 2020s (2011-2040), 2050s (2041-2070), and 2080s (2071-2100) compared to the reference period (1981–2010) under SSP2-4.5 and SSP5-8.5.
Table A4. Mean Tmin and Tmax changes for the periods 2020s (2011-2040), 2050s (2041-2070), and 2080s (2071-2100) compared to the reference period (1981–2010) under SSP2-4.5 and SSP5-8.5.