
 ?Mathematical formulae have been encoded as MathML and are displayed in this HTML version using MathJax in order to improve their display. Uncheck the box to turn MathJax off. This feature requires Javascript. Click on a formula to zoom.
Abstract
Using renewable energy sources, such as palm oil-based biodiesel, in diesel engines has demonstrated considerable potential. However, assessing their effectiveness requires comprehensive performance tests to facilitate economic evaluations, particularly in measuring fuel consumption. This study focuses on the gravimetric method for quantifying fuel consumption using a 40 kg scale. This research aims to develop a cost-effective and user-friendly method of the field and laboratory measurement technique. A load cell was integrated with an HX711 signal amplifier and a data processor to achieve this objective, complemented by an Arduino Uno data acquisition program. The study collected data during idle operating conditions at 700 rpm and New European Driving Cycle (NEDC) simulations in passenger cars fueled by biodiesel blend fuel with a volume ratio of 30% (B30). The recorded data was meticulously analyzed and presented using spreadsheet software. The results of the scale compared to the flow meter revealed fuel consumption rates in idle tests of 3.475 and 3.464 g/s, respectively. The result demonstrated a mere 0.32% difference between this developed method and conventional approaches in the idle test and a 5.8% difference in the NEDC cycle test. These findings reveal the viability and accuracy of the gravimetric technique, offering a cost-effective solution of real-world fuel consumption measurement in the pursuit of sustainable energy solutions.
1. Introduction
Diesel engines are commonly used in a range of applications, including transportation, power generation, and industrial equipment, due to their efficiency and durability (Rao et al., Citation2023), the widespread use of diesel engines also leads to an increase in the demand for diesel engine fuel (Tapia Carpio, Citation2023). According to IEA (Citation2021), the global demand for crude oil will increase from 101.2 million barrels per day in 2023 to 104.1 million in 2026. This rise in demand is mainly attributed to the widespread use of diesel engines, which further exacerbates the demand for fuel. However, this increasing demand need to be met with a corresponding increase in supply, which is actually decreasing. As a result, there is an urgent need to develop renewable energy sources (Schwarz et al., Citation2021). This condition in line with the Sustainable Development Goals (SDGs) to help reduce impact from climate change (United Nations, Citation2023). Renewable energy sources needs to achieve SDG goal 12. In recent years, various energy sources have been discovered (Gandhar et al., Citation2022; Hossain et al., Citation2017; Mallick et al., Citation2023), but biofuel has gained significant attention as a promising alternative energy option due to its sustainability, environmental friendliness, and availability (Afolalu et al., Citation2021; Islam et al., Citation2012; Sherwani et al., Citation2013). Several studies have been conducted on biodiesel, with many investigating the effects of biodiesel blend fuel (Baydir & Aras, Citation2022; Kannan et al., Citation2009; Mokhtar et al., Citation2023; Nabi & Hustad, Citation2010; Setiapraja et al., Citation2019). Accurately measuring biodiesel fuel consumption is crucial as it directly impacts diesel engine performance and operational costs (Balachandran et al., Citation2012). It also aids in understanding engine performance, optimizing fuel injection systems, and reducing emissions (Azad et al., Citation2023; Nabi et al., Citation2012). This means obtaining precise fuel consumption measurements of biodiesel blend fuel is essential to achieve reliable and accurate results (Delfino et al., Citation2018). Generally, three methods are used to measure biodiesel fuel consumption: carbon balance, volumetric, and gravimetric (Russo et al., Citation2023). The carbon balance method is currently the most commonly used method for measuring vehicle fuel consumption due to its high accuracy (Hedayat et al., Citation2016). The carbon balance method also requires specific equipment with certain gas calibrations (Baur et al., Citation2020). The characteristics of biodiesel, such as high viscosity and material compatibility (Fikria & Rustana, Citation2022), present further challenges in developing precise fuel consumption devices.
This study developed and verified the scale to attain an expanded uncertainty level of 0.3% for fuel consumption measurement of high-ratio biodiesel blends. This scale is suitable for utilization in both laboratory and on-site applications. This scale is one-fifth of the proposed requirement of 1.5% Maximum Permissible Error (MPE) for flow meters (de Huu et al., Citation2020). Fortunately, technological advancements have also led to increased accuracy in measurement, thereby aiding the use of electronic transducers, data acquisition systems, and high-speed integration techniques that allow computers to analyze electronic signals (Botia et al., Citation2021; Duarte et al., Citation2018; Sinaga et al., Citation2019). This study compares the accuracy and reliability of developed gravimetric measuring devices. The results will provide valuable insights into selecting the most appropriate method for measuring fuel consumption in diesel engines fueled with a high ratio of biodiesel blend fuels.
2. Method and material
The primary flow criterion of a fluid can be determined according to two principles: weight and volume measurement (Gournay & Homklintian, Citation2018). This is a comparative study between the improved scale versus flow meter.
2.1. Volumetric method
The volumetric method utilizes the positive displacement measurement principle, which involves briefly holding a specific volume of fuel in the discharge section to measure the flow rate of continuous fuel flow. The device can accurately determine fuel flow rate by calculating the volume units per unit of time (Husain & Wass, Citation2018). In this study, the volumetric method was conducted using the AVL KMA Mobile, suitable for measuring high-ratio biodiesel blends. shows the specifications of the AVL KMA measuring instrument.
Table 1. Flow meter specification.
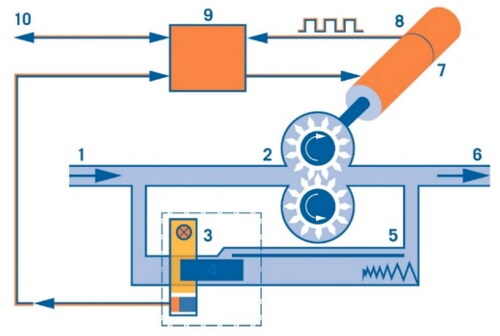
The PLU meter functions by utilizing a dynamic piston sensor in combination with a gear counter 2, which is controlled by a servo motor 7 as shown in . The gear counter is connected to a servo motor equipped with an encoder, creating a connection between the volume of fluid flowing through and the frequency of pulses generated as the gear rotates. A bypass is included to maintain zero pressure difference (Δp = 0) between the inlet and outlet to prevent leakage flow through the gear counter. In the event of flow changes, a frictionless piston moves in either direction, and a sensor and controller collaborate to adjust the gear speed quickly, keeping the piston at the center.
Figure 1. Flowmeter measurement diagram (GMBH, Citation2009).
2.2. Gravimetric method
Gravimetric is a method used to measure fluid flow rate from a fuel tank over a specific timeframe. This method involves weighing the fluid flowing out of the tank to obtain its mass value, which is then used to determine the flow rate. To facilitate this process, a sensor capable of measuring weight is required, and load cells are commonly used for this purpose. These load cells can accurately measure the weight of the container and the fluid contained within it, thereby making them important components (Johnson, Citation2016; Vásquez et al., Citation2017).
The integration of the Arduino Uno microcontroller into the gravimetric fuel consumption meter provides a simple way to record data on both mass and measurement time (Vikas Boga et al., Citation2022). The load cell used in this setup is capable of measuring weights of up to 40 kilograms and generates a rated output of 2 mv/v. It has a non-linear characteristic of 0.02% F.S. and a creep characteristic of 30 minutes at 0.0016% F.S. To enhance the signal from the load cell, an HX711 amplifier is utilized. This amplifier converts the resistance output from the load cell into a voltage output which is then fed into the Arduino Uno. The HX711 is an ADC module for the Arduino with a data accuracy of 24 bits and a differential input voltage of 40 mV. The Arduino Uno comprises 14 input/output pins that use optical technology. Out of these 14 pins, 6 function as Pulse Width Modulation (PWM) outputs and 6 analog inputs, with a 16 MHz crystal oscillator. The C++ programming language is used to process the output voltage data from the load cell, and the Arduino Integrated Development Environment (IDE) is employed to execute the program (Mariani et al., Citation2021).
Precisely calibrating the measurement system using a reference weight is essential to uphold the precision of gravimetric measurement tools (Schilling et al., Citation2020). Following calibration, the subsequent step involves the computation of the uncertainty associated with the measuring device. The process of ascertaining this uncertainty commences with the identification of factors that contribute to its overall value (Orford, Citation1995).
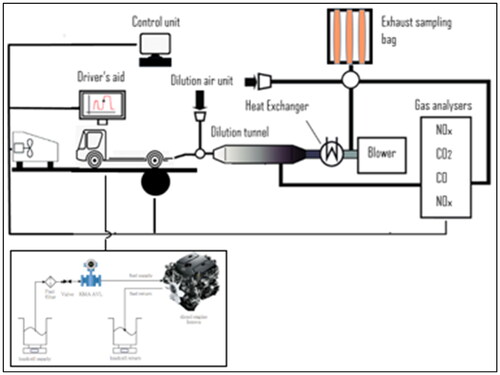
To validate the accuracy of a gravimetric measuring apparatus, a comparative examination is carried out. This evaluation entails the utilization of two instruments—a calibrated scale and the gravimetric instrument under scrutiny—within a mechanized arrangement. Subsequently, the measurement outcomes from both instruments are juxtaposed to quantify the error margin of the developing gravimetric instrument. The configuration of this comparative test utilizing both measuring tools is depicted in .
Figure 2. Gravimetric configuration.

2.3. Comparison test method
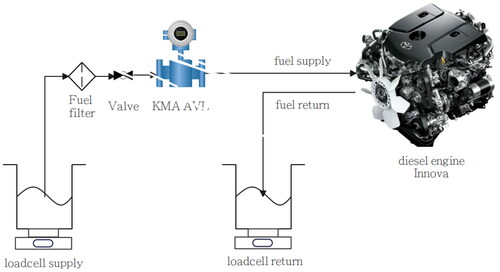
The gravimetric measuring instrument holds the fuel tank in place while fuel flows through the filter, and then goes to the engine for operation. Any excess fuel flow is collected in a separate return tank. shows the experimental layout for comparing scale measurement and flowmeter. In this test, fuel flow entering the engine or combustion chamber is compared, while the return flow from the engine is not measured.
Figure 3. Installation layout.
The first engine utilized in the experiment was a 2.5 L diesel engine shown in . The engine was operated at 700 RPM without load. The fuel used to power the diesel engines was Biodiesel B30, which was found to have a lower water content than diesel fuel after undergoing 200 hours of combustion testing (Iswantoro et al., Citation2021). The specifications of B30 are shown in and .
Table 2. Engine specification.
Table 3. Biodiesel B30 & B100 specification (Iswantoro et al., Citation2021).
The second engine used in the experiment was a 2.5 L diesel engine with 4 cylinders, capable of delivering a maximum power output of 80 Ps/3800 RPM and a maximum torque of 19.5/1800–2400 Nm/RPM. This engine underwent testing based on the United Nations Economic Commission for Europe (UN ECE). The vehicle was subjected to the New European Driving Cycle, which consists of two parts. Part I simulated a vehicle operating in an urban area, referred to as the Urban Driving Cycle (UDC). The UDC was repeated four times during Part I. Part II, called the Extra Urban Driving Cycle, simulated a vehicle driving on intercity roads such as highways or toll roads (Sukra et al., Citation2023).
During the test duration, flowmeter measurement provided the mass fuel consumption in g/s, whereas scale results showed the mass value in kg units. To obtain the same value as flowmeter results, divide the scale value by the test duration.
The mass fuel consumption rate using the gravimetric method is calculated as follows:
(1)
(1)
Formula 1 is made up of several variables. Where and
denote fuel consumption rate in g/s, fuel supply tank in g, fuel return tank in g, and the duration of the testing in seconds, respectively (Taubert & Majerczyk, Citation2015).
The mass fuel consumption results obtained from the two measuring devices are compared to determine the relative error value (Taubert & Majerczyk, Citation2015). The relative error value is determined by comparing the flow measurement method and mass measurement to the reference value, which is based on the mass fuel consumption of the flowmeter as shown in Formula 2.
(2)
(2)
Formula 2 is used to calculate the Relative error value of scale to flow mass fuel consumption, denoted as This is based on the values of gravimetric mass fuel consumption
and flow mass fuel consumption
JCGM are used to assess the measurement uncertainty value of both volumetric and gravimetric measurements. The type A and B uncertainty methods are utilized for this purpose (Abbas & Kumar, Citation2019). Type A uncertainty arises from statistical measurement data and involves calculating several parameters, including the arithmetic mean, standard deviation, and degree of freedom. The arithmetic mean is the average value of a set of numbers, obtained by dividing the sum of the values by the total number of values. The following formula is used to calculate the arithmetic mean:
(3)
(3)
The formula includes three variables, namely
and
denoting the arithmetic mean, the number of measurements taken, and the value of the statistical data, respectively.
The next step is to calculate the standard deviation (). The formula is as follows:
(4)
(4)
To calculate the standard uncertainty (), the standard deviation is divided by the square root of the number of data points (Krummenauer et al., Citation2021), as shown in Formula 5.
(5)
(5)
Type B uncertainty originates from parameters unrelated to the statistical analysis of a set of measurements. Increasing the number of measurements does not reduce this type of uncertainty, assuming measurement equipment and conditions remain unchanged. Type B uncertainty is determined by taking into account various factors, such as calibration certificates, test reports, data sheets for measuring instruments, and supporting literature. The uncertainty for the combination Type B gravimetric meter, is calculated using Formula 6.
(6)
(6)
where u(
),
and
denote the Type A uncertainty of scale measurement, the Type B uncertainty of scale calibration certificate, the uncertainty of the buoyancy weight measurement, the sensitivity coefficient of the repeatability measurement, the sensitivity coefficient of a scale certificate, and the sensitivity coefficient of the buoyancy measurement, respectively.
The Type B uncertainty of scale calibration certificate ( is determined by dividing the expanded uncertainty of scale calibration certificate (
) by the coverage factor (
):
(7)
(7)
The uncertainty of the buoyancy weight measurement () is calculated using the following formula:
(8)
(8)
The Type B uncertainty of flowmeter mass flow consumption can be determined using Formula 9.
(9)
(9)
The formula presented above comprises several elements, including u(),
and
denoting type A uncertainty measurement from flowmeter, type B uncertainty measurement from flowmeter calibration certificate and
uncertainty measurement of flowmeter readout resolution, respectively. It also consists of three sensitivity coefficients, namely
and
which denote repeatability measurement, flowmeter certificate, and readout resolution.
2.3. Idle test
This test is carried out by operating the vehicle at stationary conditions (700 RPM), referring to the Decree of the Minister of Environment number 06 concerning the emission threshold of category M vehicles in stationary conditions (Mitchell et al., Citation2017). shows that the mean fuel consumption rate obtained by the gravimetric method is slightly higher than those determined using the volumetric method of flowmeter, with a relatively small difference within the measurement uncertainty of the two methods. It is important to note that the volumetric method requires knowledge of fuel density to convert volume to mass, capable of affecting its accuracy. However, the standard deviation for the flom meter is much smaller than that of the scale. This indicates that the flow meter has better precision in its measurement than the scale ( and ).
Figure 4. Idle cycle.
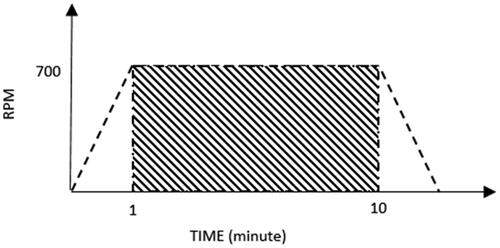
Figure 5. Idle test configuration.

Table 4. Uncertainty of volumetric measurement.
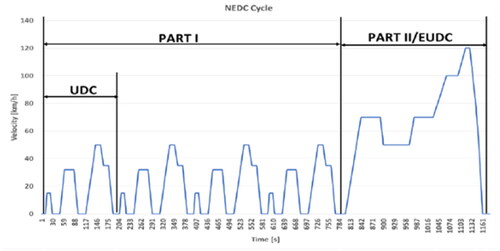
2.4. New European Driving Cycle test (NEDC)
The NEDC (New European Driving Cycle) is a standardized testing procedure used in Europe to evaluate the emissions and fuel consumption of motor vehicles (Regulation No 83 of the Economic Commission for Europe of the United Nations (UN/ECE) – Uniform Provisions Concerning the Approval of Vehicles with Regard to the Emission of Pollutants According to Engine Fuel Requirements, 2006). It is designed to simulate typical driving conditions encountered by vehicles in everyday European use. The NEDC test involves a series of driving scenarios, including acceleration, deceleration, and constant-speed driving. Its primary objective is to provide a more accurate estimation of a vehicle’s fuel consumption and exhaust emissions under real-world conditions. Please note that the NEDC has been succeeded by more modern testing standards, which offer improved accuracy in reflecting real-world driving scenarios and are now commonly used for assessing the environmental performance of new vehicles ().
Figure 6. New European driving cycle.
shows a schematic diagram of a vehicle measuring facility used to measure fuel economy with both gravimetric and volumetric methods. In general, the facility comprises a chassis dynamometer to simulate road load conditions, and driver aids to assist the drivers in adhering to the NEDC test cycle, a sampling system, and emission analyzers.
Figure 7. NEDC test configuration.
3. Results and discussions
3.1. Calibration and verification
A load plate is utilized to adjust the configuration of a gravimetric measuring instrument that employs a load cell. The loadcell then calibrates and yields the actual force value in volts on the output signal from the loadcell. The calibration results, which are shown in , illustrate the relationship between the mass of the applied load plate (in grams) and the measured output voltage of the mass ().
Figure 8. Voltage to mass calibration.
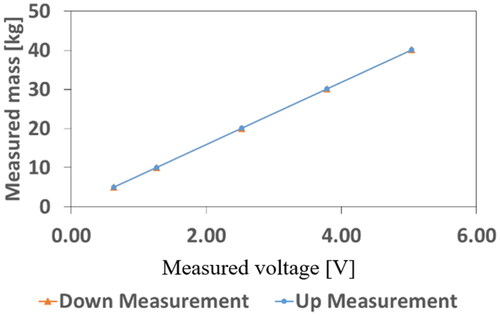
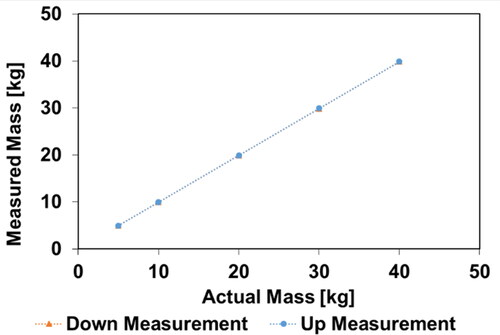
The load cell output signal is recorded twice, once before and once after calibration. By comparing these two signals, we can determine the sensitivity and accuracy of the load cell. shows the hysteresis of the balance calibration, with consistent load cell readings for both upward and downward measurements ().
Figure 9. Loadcell calibration hysteresis.
There are three sources of uncertainty in measurement: repeatability, calibration, and buoyancy. Formulas 5, 7, and 8 are used to calculate the uncertainty values for each source, while Formula 6 is used to determine the combined uncertainty value. shows the uncertainty values for the scale measurement instrument.
Table 5. Uncertainty of scale measurement.
When using the volumetric method, there are three sources of uncertainty to consider: repeatability measurement, calibration, and resolution. To calculate the uncertainty values for repeatability measurement and calibration, use Formulas 5 and 7 respectively. The uncertainty value for resolution can be obtained from the flowmeter specification. (Purata-Sifuentes et al., Citation2021). The combined uncertainty value is determined using formula 9. shows the uncertainty values for the flowmeter instrument.
shows that the scale has a relatively high uncertainty, with an expanded uncertainty of 0.482 grams, mainly due to the high uncertainty from calibration and the small uncertainty from buoyancy. The uncertainty from repeatability measurement is also significant but relatively small compared to others. In contrast, the volumetric method has a much lower uncertainty of 0.294 grams, as shown in .
3.2. Idle test results
shows the reproducibility of scale and flow meter in idle cycles (). Measurement results indicated that reproducibility for both ways was comparable. Subsequently, there is a difference of 0.011 g/s in the measured values; we can assume that the results of the two measurement techniques are identical. Measurement of fuel consumption tends to obtain stability. Therefore, data recording for measurement is sufficient to achieve a certain precision level.
Figure 10. Fuel mass flow during idle test.
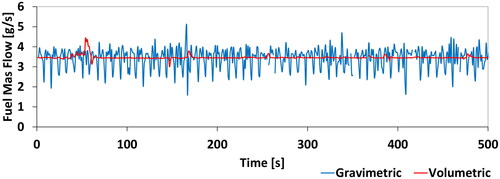
Table 6. Comparison of fuel flow rate on an idle test.
Table 7. Comparison of fuel flow rate on NEDC test.
3.3. NEDC test results
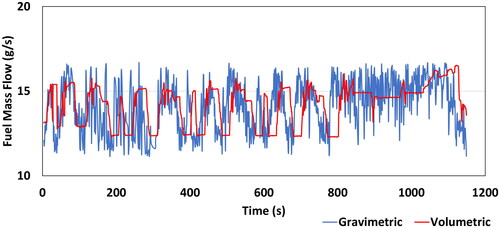
The result of fuel consumption measurement with scale and flow meter by using the NEDC cycle is shown in . Overall, the trend obtained from the scale and flow meter was found to be similar in that both methods could follow transient measurements during the test cycle. However, there was a noticeable difference in the results obtained from these two methods, with the scale measurement showing a smaller peak at cruise speed compared to the flow meter. also showed that the flow meter delayed rapid measurement changes during acceleration and deceleration modes. It could be considered due to time response. This factor causes the standard deviation in NEDC testing to be larger than the standard deviation at the idle test. This study found a 5.8% correction and a 0.16 g/s difference compared to the flow meter. summarizes the reproducibility of the scale and flow meter in the NEDC cycle test.
Figure 11. Fuel mass flow during the NEDC test.
4. Conclusion
This study explains the characteristics of scales when measuring mass flow and compares the results with reference flow meters. Develop a weighing device consisting of a load cell and HX711 signal amplifier, then connect it to an Arduino microcontroller. The processed data is then presented via spreadsheet software. The data generated by the load cell can be well understood through IDE (Integrated Development Environment) programming, resulting in 0.482 uncertainty values, hysteresis data during calibration, and precise timing. The weighing scale has a better response compared to the flowmeter readings, so it is read more accurately in every gear change and speed change. It can be seen that, compared with the flowmeter, the correction value in the idle cycle test is relatively small, 0.318%, and the correction value in the NEDC cycle test is 5.8%. By considering the comparison results with a flowmeter, weighing devices using the scale can be used for field testing of vehicle fuel consumption on an idle cycle or for laboratory-type approval testing using the NEDC cycle. The development of such a scale can provide a cost-effective and user-friendly fuel consumption measurement device. When considering the consistency of the measurement, it is crucial to consider the uncertainty levels provided by the narrative. The aim is to make it easy to assess the reliability of the measurement. That way, for the next time, we can take measurements in the field with portable tools. Plans involve conducting a comprehensive study on how measurements at this scale compare to carbon balance methods by measuring the return on fuel lines.
Ethical approval
All authors consent to the publication of this manuscript.
Author contribution
All authors listed have significantly contributed to the development and the writing of this article.
Acknowledgements
The authors gratefully thank the author’s respective institution for their strong support in this study. This research received no external funding.
Disclosure statement
No potential conflict of interest was reported by the author(s).
Data availability statement
The necessary data used in the manuscript are already present in the manuscript.
References
- Abbas, A., & Kumar, A. (2019). Evaluation of uncertainty in flow and performance parameters in Francis turbine test rig. Flow Measurement and Instrumentation, 65(December 2018), 297–308. https://doi.org/10.1016/j.flowmeasinst.2019.01.009
- Afolalu, S. A., Yusuf, O. O., Abioye, A. A., Emetere, M. E., Ongbali, S. O., & Samuel, O. D. (2021). Biofuel; a sustainable renewable source of energy-a review. IOP Conference Series: Earth and Environmental Science, 665(1), 012040. https://doi.org/10.1088/1755-1315/665/1/012040
- Azad, A. K., Doppalapudi, A. T., Khan, M. M. K., Hassan, N. M. S., & Gudimetla, P. (2023). A landscape review on biodiesel combustion strategies to reduce emission. Energy Reports, 9, 4413–4436. https://doi.org/10.1016/j.egyr.2023.03.104
- Balachandran, S., Pachon, J. E., Hu, Y., Lee, D., Mulholland, J. A., & Russell, A. G. (2012). Ensemble-trained source apportionment of fine particulate matter and method uncertainty analysis. Atmospheric Environment, 61, 387–394. https://doi.org/10.1016/j.atmosenv.2012.07.031
- Baur, T., Bastuck, M., Schultealbert, C., Sauerwald, T., & Schütze, A. (2020). Random gas mixtures for efficient gas sensor calibration. Journal of Sensors and Sensor Systems, 9(2), 411–424. https://doi.org/10.5194/jsss-9-411-2020
- Baydir, E., & Aras, O. (2022). Increasing biodiesel production yield in narrow channel tubular reactors. Chemical Engineering and Processing – Process Intensification, 170(November 2021), 108719. https://doi.org/10.1016/j.cep.2021.108719
- Botia, G. C. P., Suárez, J. P. R., & Abril, M. S. O. (2021). Development of a gravimetric fuel measurement system for the evaluation of engine performance physical parameters. Journal of Physics: Conference Series, 2073(1), 012015. https://doi.org/10.1088/1742-6596/2073/1/012015
- de Huu, M., Tschannen, M., Bissig, H., Stadelmann, P., Büker, O., MacDonald, M., Maury, R., Neuvonen, P. T., Petter, H. T., & Rasmussen, K. (2020). Design of gravimetric primary standards for field-testing of hydrogen refuelling stations. Flow Measurement and Instrumentation, 73(March), 101747. https://doi.org/10.1016/j.flowmeasinst.2020.101747
- Delfino, J. R., Pereira, T. C., Costa Viegas, H. D., Marques, E. P., Pupim Ferreira, A. A., Zhang, L., Zhang, J., & Brandes Marques, A. L. (2018). A simple and fast method to determine water content in biodiesel by electrochemical impedance spectroscopy. Talanta, 179, 753–759. https://doi.org/10.1016/j.talanta.2017.11.053
- Duarte, J., Valencia, G. E., Gutierrez, J. C., Guzman, J., & Porto, A. (2018). Implementation of a fuel measurement system based on the gravimetric principle for applications in engine test bench. Contemporary Engineering Sciences, 11(76), 3781–3788. https://doi.org/10.12988/ces.2018.87347
- EUR-Lex. (2006). Regulation No 83 of the Economic Commission for Europe of the United Nations (UN/ECE) – uniform provisions concerning the approval of vehicles with regard to the emission of pollutants according to engine fuel requirements (pp. 223–495).https://eur-lex.europa.eu/LexUriServ/LexUriServ.do?uri=OJ:L:2012:042:0001:0207:EN:PDF
- Fikria, G., & Rustana, C. (2022). Analysis of the physical characteristics of biodiesel products made from used cooking oil. Jurnal Neutrino, 14(2), 63–69. https://doi.org/10.18860/neu.v14i2.14131
- Gandhar, A., Vijay, S., Mohapatra, A., Datta, J., & Shukla, S. (2022). An informative review on recent development of renewable energy system. Journal of Information and Optimization Sciences, 43(3), 419–427. https://doi.org/10.1080/02522667.2022.2048516
- GMBH, A. L. (2009). AVL KMA mobile: Fuel consumption measurement. https://www.avl.com/documents/10138/885965/AVL_product_description_KMA+Mobile_+EN.pdf
- Gournay, P., & Homklintian, M. (2018). The case study of water flow measurement comparison in the range of 12–120 L/min. Journal of Physics: Conference Series, 1144, 012077. https://doi.org/10.1088/1742-6596/1144/1/012077
- Hedayat, F., Stevanovic, S., Milic, A., Miljevic, B., Nabi, M. N., Zare, A., Bottle, S. E., Brown, R. J., & Ristovski, Z. D. (2016). Influence of oxygen content of the certain types of biodiesels on particulate oxidative potential. The Science of the Total Environment, 545-546, 381–388. https://doi.org/10.1016/j.scitotenv.2015.12.036
- Hossain, F. M., Nabi, M. N., Rainey, T. J., Bodisco, T., Rahman, M. M., Suara, K., Rahman, S. M. A., Van, T. C., Ristovski, Z., & Brown, R. J. (2017). Investigation of microalgae HTL fuel effects on diesel engine performance and exhaust emissions using surrogate fuels. Energy Conversion and Management, 152(September), 186–200. https://doi.org/10.1016/j.enconman.2017.09.016
- Husain, Z. D., & Wass, D. J. (2018). Positive displacement flowmeters. In J. G. Webster & H. Eren (Eds.), Measrurement, instrumentation, and sensor handbook: Spatial, mechanical, thermal, and radiant measurement (2nd ed., pp. 1–10).CRC Press.
- IEA. (2021). Oil 2021 (pp. 167). International Energy Agency.
- Islam, M. R., Nabi, M. N., & Islam, M. N. (2012). The fuel properties of pyrolytic oils derived from carbonaceous solid wastes in Bangladesh. Jurnal Teknologi, 38(1), 012077. https://doi.org/10.11113/jt.v38.484
- Iswantoro, A, Cahyono, B, Zaman, M B, Busse, W, Semin, (2021). The effect of use of biodiesel B30 from palm oil to degradation of oil lubrication in 1-cylinder diesel engine 4-stroke.IOP Conference Series: Earth and Environmental Science, 649(1, 012063). https://doi.org/10.1088/1755-1315/649/1/012063
- Johnson, R. W. (2016). Handbook of fluid dynamics (Second Edition). Routledge.
- Kannan, D., Nabi, M. N., & Hustad, J. E. (2009). Influence of ethanol blend addition on compression ignition engine performance and emissions operated with diesel and Jatropha methyl ester. SAE Technical Papers, 4970. https://doi.org/10.4271/2009-01-1808.
- Krummenauer, A., Dias, P. R., & Veit, H. M. (2021). Estimation of measurement uncertainty in the EDXRF spectrometry of stainless steel. Journal of Physics: Conference Series, 1826(1), 012011. https://doi.org/10.1088/1742-6596/1826/1/012011
- Mallick, D., Sharma, P., Bora, B. J., Baruah, D., Bhowmik, R., Barbhuiya, S. A., & Balakrishnan, D. (2023). Mechanistic investigation of pyrolysis kinetics of water hyacinth for biofuel employing isoconversional method. Sustainable Energy Technologies and Assessments, 57(January), 103175. https://doi.org/10.1016/j.seta.2023.103175
- Mariani, M. J. P., Wacas, R. U., Padre, R. J., Soriano, G. T., Elveña, V. B., & Sarne, J. C, Kalinga State University. (2021). Design modification of a cost-efficient microcontroller-based egg incubator. Indian Journal of Science and Technology, 14(14), 1160–1167. https://doi.org/10.17485/IJST/v14i14.2289
- Mitchell, B. J., Zare, A., Bodisco, T. A., Nabi, M. N., Hossain, F. M., Ristovski, Z. D., & Brown, R. J. (2017). Engine blow-by with oxygenated fuels: A comparative study into cold and hot start operation. Energy, 140, 612–624. https://doi.org/10.1016/j.energy.2017.08.115
- Mokhtar, M., Sukmono, A., Setiapraja, H., Ma’ruf, M., Yubaidah, S., Haryono, I., Rochmanto, B., Soewono, R. T., Adhi Sukra, K. F., Thahar, A., Manurung, E., Wibowo, C. S., Widodo, S., Supriyadi, F., Abriyant, R. Y., Abriyant, R. Y., Suntoro, D., Faridha, F., & Reksowardojo, I. K. (2023). Towards nationwide implementation of 40% biodiesel blend fuel in Indonesia: A comprehensive road test and laboratory evaluation. Biofuel Research Journal, 10(03), 1876–1889. https://doi.org/10.18331/BRJ2023.10.3.2
- Nabi, M. N., Brown, R. J., Ristovski, Z., & Hustad, J. E. (2012). A comparative study of the number and mass of fine particles emitted with diesel fuel and marine gas oil (MGO). Atmospheric Environment, 57, 22–28. https://doi.org/10.1016/j.atmosenv.2012.04.039
- Nabi, M. N., & Hustad, J. E. (2010). Experimental investigation of engine emissions with marine gas oil-oxygenate blends. The Science of the Total Environment, 408(16), 3231–3239. https://doi.org/10.1016/j.scitotenv.2010.03.043
- Orford, G. R. (1995). Measurement uncertainties. In Michael Grabe (Ed.), IEE Colloquium (Digest) (Issue 82). IOP Publishing. https://doi.org/10.1088/978-1-64327-096-8ch3
- Purata-Sifuentes, O.-J., Gonzalez-Gomez, H.-L., Echavarri-Rodriguez, J.-A., & Funes-Rodriguez, E. (2021). Uncertainty due to meniscus reading on conical graduated volumetric instruments. IEEE Access. 9, 147801–147808. https://doi.org/10.1109/ACCESS.2021.3123961
- Rao, P. M., Dhoria, S. H., Patro, S. G. K., Gopidesi, R. K., Alkahtani, M. Q., Islam, S., Vijaya, M., Jayanthi, J. L., Khan, M. A., Razak, A., Kumar, R., Rizal, A., & Ammarullah, M. I. (2023). Artificial intelligence based modelling and hybrid optimization of linseed oil biodiesel with graphene nanoparticles to stringent biomedical safety and environmental standards. Case Studies in Thermal Engineering, 51, 103554. https://doi.org/10.1016/j.csite.2023.103554
- Russo, M. D., Stutenberg, K., & Hall, C. M. (2023). Analysis of uncertainty impacts on emissions and fuel economy evaluation for chassis dynamometer testing. IEEE Transactions on Vehicular Technology, 72(4), 4236–4251. https://doi.org/10.1109/TVT.2022.3222650
- Schilling, M., Wodey, É., Timmen, L., Tell, D., Zipfel, K. H., Schlippert, D., Schubert, C., Rasel, E. M., & Müller, J. (2020). Gravity field modelling for the Hannover 10 m atom interferometer. Journal of Geodesy, 94(12), 122. https://doi.org/10.1007/s00190-020-01451-y
- Schwarz, H., Badenes, B., Wagner, J., Cuevas, J. M., Urchueguía, J., & Bertermann, D. (2021). A case study of thermal evolution in the vicinity of geothermal probes following a distributed TRT method. Energies, 14(9), 2632. https://doi.org/10.3390/en14092632
- Setiapraja, H., Yubaidah, S., Ekasari, M., Haspriyanti, N., & Rustyawan, W. (2019). An effect of utilization B30 from various blends of B0: FAME and HVO on emissions, fuel consumption and power of Euro4 vehicle technology. https://doi.org/10.4271/2019-01-2189.
- Sherwani, A. F., Yadav, A. K., & Karimi, M. N. (2013). Experimental study on the performance and emission characteristics of a four stroke diesel engine running with Mahua oil ethyl ester. International Journal of Sustainable Development and Green Economics, 2(1), 80–84.
- Sinaga, N, Yunianto, B, Purba, D, Nugroho, A, Syaiful, (2019). Design and manufacture of a low-cost data acquisition based measurement system for dual fuel engine researches. IOP Conference Series: Materials Science and Engineering, 598(1), 012031. https://doi.org/10.1088/1757-899X/598/1/012031
- Sukra, K. F. A., Priyanto, H., Indriatmono, D., Wijayanto, M. A., Ikhsanudin, I. Y., & Ermansyah, Y. A. (2023). Impact of road load parameters on vehicle CO2 emissions and fuel economy : A case study in Indonesia. Journal of Mechatronics, Electrical Power, and Vehicular Technology, 14(1), 87–93. https://doi.org/10.14203/j.mev.2023.v14.87-93
- Tapia Carpio, L. G. (2023). Transmission of variations in the biodiesel mandate for Brazilian biodiesel market. Biofuels, 14(4), 373–386. https://doi.org/10.1080/17597269.2022.2140884
- Taubert, S., & Majerczyk, A. (2015). Some aspects of validation of the fuel consumption measurement method. Journal of KONES. Powertrain and Transport, 20(4), 457–464. https://doi.org/10.5604/12314005.1137860
- United Nations. (2023). The sustainable development goals report 2023 special edition. The sustainable development goals report (pp. 37–39).https://unstats.un.org/sdgs/report/2023/
- Vásquez, J. D. H., de Faro Orlando, A., Frota, M. N., & de Oliveira, E. C. (2017). An alternative gravimetric measurement standard for calibration of liquid flow meters. Flow Measurement and Instrumentation, 58, 87–96. https://doi.org/10.1016/j.flowmeasinst.2017.09.016
- Vikas Boga, P., Vivek Patil, L., Shreya, L., & Priyanka, B. (2022). Vehicle over speeding detection. International Journal of Advanced Research in Science, Communication and Technology, 2(9), 209–215. https://doi.org/10.48175/IJARSCT-5325