
 ?Mathematical formulae have been encoded as MathML and are displayed in this HTML version using MathJax in order to improve their display. Uncheck the box to turn MathJax off. This feature requires Javascript. Click on a formula to zoom.
Abstract
Experimental analysis is carried out on the mechanical characteristics of fiber-reinforced that can be produced by adding basalt fibers to strengthened jute fiber-reinforced epoxy composites in both the warp and weft orientations. A three-parameter/three-level Design of Experiment technique called the Box–Behnken design (BBD) is used to ascertain the relationship between the input parameters and the response. Mechanical testing was done on the composite plates after fabrication to estimate the tensile strength of the composites in both the warp and weft directions. The basalt fiber content of the composite was around 0.5 wt.%, 1 wt.% and 1.5 wt.%; the sonication period was 20, 30 and 40 min; and the temperature was approximately 60 °C, 70 °C and 80 °C. In the warp and weft directions, the maximum ultimate tensile stresses are measured to be 34.03 MPa and 36.32 MPa, respectively. Analysis of Variance is used to determine the regression equation and the influence of the input parameters. The optimum ‘ultimate tensile stress’ is 40.162 MPa for warp direction and 35.445 MPa for weft direction with 1.5 wt.% filler weight, 40 min of sonication and 60 °C temperature.
1. Introduction
Nowadays, structural industries are focusing on developing eco-friendly materials for their components. Natural fibers dominate synthetic fibers in many applications due to their tremendous advantages in protecting the environment. All tests were carried out on the natural fiber-reinforced composites to compete with synthetic fiber-reinforced composites. The weed plants were mainly unused due to their toxic nature, and cattle also will not eat them. These weed plants were effectively used as fillers in polymer composites to improve the strength of the composites (John & Thomas, Citation2008).
Most researchers studied the performance of epoxy composite reinforced with natural fibers like jute fiber (John & Thomas, Citation2008), aramid (Gopalan et al., Citation2020), basalt fiber (Goodarz et al., Citation2019), flax (Doddi et al., Citation2020), glass and carbon fiber (Wu et al., Citation2019) that attained enhanced mechanical characteristics. Along with the different filler (natural fiber) materials mentioned above, basalt fiber has excellent chemical and thermal stability with superior tensile strength (Ghabezi & Harrison, Citation2020). Additionally, it is eco-friendly during preparation and easy to recycle (Dhand et al., Citation2015) (Wei et al., Citation2011).
Venkatesh et al. (Citation2022) studied the tensile properties and self-sensing capability of woven basalt reinforced in carbon epoxy composites. The percentage of CNT was varied from 0.2 wt.% to 3.0 wt.% and the volume of basalt fibers was constant. Under tensile load conditions, the electricity was passed to find the crack initiation in the composites. Wang et al. (Citation2020) investigated the effect of basalt hybrid fiber reinforced using a mould pressing technique. Results revealed that thermoplastic-reinforced composites show better flexibility compared with thermosetting epoxy composites. Wang et al. (Citation2018) examined the mechanical properties of woven basalt fiber reinforced in graphene oxide nanoplates (GONP). The mechanical characteristics of the specimens were also shown to be significantly impacted by the silane alteration of GONPs. Jamali et al. (Citation2018) investigated the fiber hybridization of BF/PEF composites by varying combinations. The outcome demonstrated that 60 wt.% basalt fiber and 40 wt.% polyethylene fiber combination give better results compared with other combinations. Yang et al. (Citation2019) analyzed the tensile aspects of basalt fiber-fortified composites at various elevated strain rates. The results showed that the composites, fortified with basalt fiber, are much more sensitive to change in strain rate and at high strain rate, the impact behavior was exemplary. Ou et al. (Citation2016) examined basalt fiber-reinforced epoxy composites’ physical and mechanical characteristics with fly ash. The authors discovered that the void contents of the composites increased with the percentage of fly ash and that a basalt-epoxy composite with 10% fly ash has better mechanical properties than others. Vinay et al. (Citation2022) investigated the effect of the orientation of bidirectional basalt fiber under mechanical testing. The tensile fracture study was investigated for 45°, 60° and 90° orientation of bidirectional mat basalt fiber-reinforced composite. The result showed that 90° orientation basalt fiber gives the maximum mechanical properties compared with other orientations. Kumar and Singh (Citation2021) examined nano-zirconia/graphene oxide reinforced woven basalt fiber composites’ tribological and flexural properties. Different nano-zirconia and graphene oxide reinforcing percentages were used to make the specimens. The 0.1 wt.% graphene oxide and 1.0 wt.% nano-zirconia combination showed improved flexural and wear resistance capabilities when compared to plain basalt fiber composites. Toorchi et al. (Citation2022) investigated the basalt fiber-reinforced composites with epoxy as matrix prepared by a hand layup compression moulding technique. Tensile and three-point bending tests were also carried out at different temperature conditions. TGA results showed that the basalt fiber exhibits better thermal resistance at 30–900 °C. Karvanis et al. (Citation2020) studied the effects of TiC nanoparticles and coir on basalt fiber-fortified composites. The investigation’s findings indicated that the addition of coir fiber and TiC nanoparticles significantly improved the materials’ mechanical and thermal properties, with the fillers and matrix components bearing the maximum loads. Click or tap here to enter text.Arshad et al. (2021) discovered that after soaking the basalt fiber in a strong alkali solution for 90 d, its tensile strength decreased to only 7% of the initial strength. Additionally, they observed that the weight loss rate was lower when soaked in a weak alkali solution compared to a strong one. The tensile strength of basalt fibers was significantly reduced under both weak and strong alkali solutions. Lee et al. (Citation2014) found that immersing basalt fibers in a 1 mol/L NaOH solution at 40◦C for either 7 or 28 d resulted in approximately 50% and 80% reduction in strength, respectively.
Sim et al. (Citation2005) investigated the Calotropis gigantea stems that were powdered and used as filler in epoxy composites. The fiber-filled epoxy was coated on the jute-woven fibers to prepare the composites, and mechanical properties were studied for different weight percentages. Of 10 wt.% filler-used composites showed better mechanical and thermal properties than other compositions. Vinod et al. (Citation2018) and Dilfi et al. (Citation2018) examined jute fiber’s surface modification effect on epoxy polymer composite. The jute fiber was treated with alkali and saline, and composites were formed utilizing a vacuum-assisted resin infusion technique for mechanical testing. The results demonstrated that the combination of alkaline and saline treatment was superior to the results of either treatment alone. Basak et al. (Citation2018) examined the mechanical characteristics of alkali-treated jute fiber at different NaOH concentrations. The results indicated that the tensile and flexural characteristics first increase to 5 wt.% and subsequently decline. The impact strength increased up to 7 wt.% and after that decreased. Singh et al. (Citation2020) fabricated the nano clay reinforced surface modified jute fiber epoxy composites. NaOH was used in varied concentrations to treat the jute’s surface, and nano clay was employed to reinforce the composite from 1 wt.% to 7 wt.%. Compared to other combinations, the results showed that NaOH at 5% and nano clay at 5% produce good results.
Ramakrishnan et al. (Citation2021) created hybrid composite behavior reinforced with AISI 304 wire mesh (500 μm) and jute fiber-reinforced composites. In comparison to other degree orientations, 45°-oriented wire mesh demonstrated superior performance. Krishnasamy et al. (Citation2021) and Aranno et al. (Citation2019) used glass fiber and aluminum foil as reinforcement to study the mechanical properties of woven jute fiber. The results observed that the mechanical properties of the composites were improved by experimenting with various orientations and reinforcing techniques. Glass fibers woven with jute fibers proved more effective. Khalid et al. (Citation2021) investigated the moisture absorption of jute fiber composites strengthened with waste plastic fillers. The authors observed that the Taguchi technique was used to determine the process parameters, including the weight percentage of plastic particles, jute reinforcement, and the type of chemical treatment for jute fibers. The variables that affected moisture absorption qualities were optimized. The optimal ratio at which the composite exhibits the highest level of water resistance was determined by analyzing the data. Balan and Ravichandran (Citation2020) investigated wood dust as a filler in jute fiber-reinforced composites. The outcome demonstrates that the distribution of the wood dust was homogeneous, improving the mechanical properties of jute fiber-reinforced composites.
Response surface methodology (RSM) is a mathematical and statistical method for analyzing complex experimentation problems with responses being affected by various variables to optimize the responses. It also gives the topography of the response surface. Dinesh et al. (Citation2020) studied the optimization of alkaline treatment conditions for flax fiber. They reported that BBD is an accurate tool for optimizing treatment conditions to obtain optimal fiber tensile strength and flexural modulus. This statement is in accordance with other researchers who used BBD for the same purpose. Aly et al. (Citation2012) employed BBD to increase the lignin decomposition removal of banana fiber and found treatment conditions of 11 g/L NaOH concentration, 2.5 h treatment time and a temperature of 90 °C improved the rate at which lignin was removed from the banana fiber. Vishnu Vardhini et al. (Citation2018) used BBD to determine optimal conditions for cellulose extraction and suggested that 1.2 NaOH/NaClO ratios at 45 °C and 2 h were the best possible extraction conditions for jute fiber pulp using the RSM.
The literature is sparse because basalt fibers in filler form are reinforced with woven jute fiber, and epoxy is utilized as a matrix. The novelty of the current work is to investigate the effect of the wt.% of basalt fiber reinforced with woven jute fiber in warp and weft directions on their tensile properties. Our understanding of this investigation allows us to assess the potential of fabricated composite in structural applications for the structural, automotive and aerospace industries. Thus, experiment design is an effective tool for optimizing the final composite response.
In this study, simultaneous parameter optimization is employed to characterize the tensile behavior of composites. The test run is based on the Box–Behnken design (BBD) with three parameters, including filler concentration, sonication duration and testing temperature. The statistical approach and the accuracy of the parametric optimization are obtained using Minitab version 19 (State College, Pennsylvania). Furthermore, a series of optimum parametric mechanical behavior of composites are also evaluated. Combining basalt fibers with jute in an epoxy matrix creates a unique hybrid composite that leverages the high tensile strength and thermal stability of basalt fibers along with the environmental friendliness and cost-effectiveness of jute. This innovative blend could offer a new class of materials that balance performance with sustainability. Analyzing tensile properties in both warp and weft directions addresses the anisotropic nature of composite materials. This approach provides a deeper understanding of the material’s behavior under tensile loads from different directions, which is critical for applications where the material may be subjected to multi-directional stresses. The reinforcement of jute fibers with basalt in an epoxy matrix could significantly improve the mechanical properties of the composite, such as tensile strength, stiffness and durability while maintaining a lower environmental footprint. This enhancement makes it a compelling option for industries like automotive, construction and aerospace, seeking sustainable yet high-performance materials. By integrating natural fibers like jute with basalt fibers, this research contributes to the development of more sustainable composite materials. It potentially reduces reliance on synthetic fibers, which are derived from petrochemicals and promotes the use of renewable and less environmentally damaging resources.
2. Materials and methods
2.1. Materials
The jute fibers in woven type and basalt filler in powder form with a fiber diameter of 9–18 µm, 2.8 g/cm3 density and maximum breaking strength of 3000 MPa are purchased from Go Green Products, Chennai, Tamil Nadu, India. Epoxy LY5561, Hardener HY951 and NaOH are purchased from Herenba Instruments and Engineering, Chennai, Tamil Nadu, India. NaOH of 96.45% chemically pure is also purchased. The properties of composite materials are listed in and . These qualities have raised their demand for structural applications in aircraft, civil engineering, military, racing and sports equipment manufacture.
Table 1. Basalt filler properties.
Table 2. Jute fiber properties.
Samples are tested under tensile strain using ASTM D3039/D3039-17. Tensile testing requires a length of 250 mm, a width of 25 mm and a thickness of 3 mm. To measure tensile strength, cured jute/basalt epoxy composites are cut in warp and weft directions. Using computerized INSTRON 8801 equipment (INSTRON, Norwood, MA), the specimens are examined by holding both ends of the samples with grippers and progressively applying axial stress. At various cabin temperatures of 60, 70, and 80 °C, the strain rate of 1 millimeter per minute is upheld. The system will automatically record any pertinent information whenever it is being tested (Manzato et al., Citation2018).
2.2. Experimental design
This study uses the BBD with three levels/factors and 17 trials (). Achieve the best possible outcome, it is necessary to optimize a system or process that has several independent variables. With the help of BBD, one can discover the ideal circumstances with a reduced number of experimental runs, so saving both time and money. A better understanding of the relationship between the response of interest and the independent factors is provided by this model. By fitting a quadratic or higher-order model, one can find optimum circumstances by using BBD. This is accomplished by examining the problem’s curvature and the interactions between the components. When developing a response surface model, BBD helps save both time and money by lowering the number of required experimental runs. In the context of carrying out physical examinations, this can be of special significance. The investigation of the experimental environment ought to be carried out methodically and efficiently. When determining the best operating parameters, it is necessary to use a BBD regression model to maximize or reduce a desired result. It contributes to the optimization of processes, the elimination of errors and the development of system performance. Using the response surface models that are generated from BBD, it is possible to make predictions about the outcomes of factor combinations that were not included in the initial experiments. The model can be validated and extrapolated (Karthik et al., Citation2023; Venkatachalam et al., Citation2023).
Figure 1. Experimental design outline.
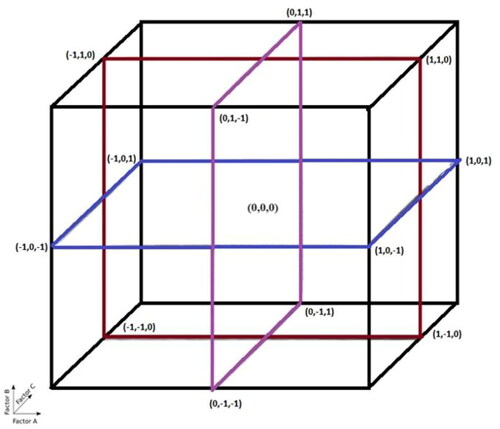
A three-level/three-parameter BBD, i.e. BBD is employed to design the experiment and to carry out the testing. Seventeen run combinations are required to complete the procedure. shows the list of parameters and levels taken for this study. This study’s variables and levels are as follows: Filler weight (0.5, 1.0, 1.5 in % wt./wt.), sonication time (20, 30 and 40 min) and testing temperature (60, 70 and 80 °C).
Table 3. Levels and codes of Box–Behnken design (BBD).
As indicated in EquationEquation (1)(1)
(1) , the acquired data are fitted into a second-order polynomial (Dilfi et al., Citation2018).
(1)
(1)
where Y is response (Flexural Stress and Flexural Modulus); Xi and Xj are the coded independent variables, and β0, βi (i = 1, 2, 3, 4) and βij (i = 1, 2, 3, 4; j = 1, 2, 3, 4) are the model coefficients. BBD is applied to the experimental data using statistical software, Design Expert version 11 (Minneapolis).
2.3. Fabrication of composites
The jute fiber layers are cleaned with de-mineralized water to wash away the sludge and other contaminants. Then the washed jute fibers are soaked in 5 wt.% NaOH solution for 2 h to remove unwanted cells from the fiber’s surface and enhance the fiber’s adhesion property with the resin matrix. The soaked fibers are taken out and washed well with the help of de-mineralized water many times to remove the effect of NaOH altogether. The chemically treated jute fibers are air-dried in a hot air oven for 48 h to obliterate the fiber laminate’s moisture. As per the experimental design combination, basalt fiber filler is added to epoxy resin in 0.5, 1 and 1.5 wt.% and sonicated well under ultrasonication for 20, 30 and 40 min. Throughout the procedure, the resin mixture is kept at a constant 55 °C.
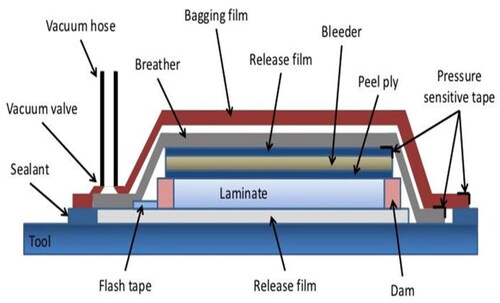
The basalt fiber-filled epoxy mixture is contained in a vacuum chamber to remove air bubbles. The setup for the vacuum infusion mold is created in the manner depicted in . The surface of the bottom is treated with wax that acts as a releasing agent. It is used to make use of neat fibers that include filler SiC nanoparticles in four different stacking sequences. Making adjustments to the weight percentage of the fiber volume fraction allows for the fabrication of four different laminates. A bonding agent that is employed is jute fiber which has been strengthened with basalt fiber-reinforced epoxy (Hassan et al., Citation2019). Basalt microparticles with filler added at a weight percentage of 0.5–1.5 are prepared. In , you can see a variety of laminates that were manufactured. After that, a plastic sheet is used to cover them, and then sealant tape is used to secure it. There is a vacuum pump attached to one end of the corner, which is used to remove any excess resin that is present in the mold. A pressure of two bars is maintained for 8–10 min. A hot-air oven is used to dry the composite laminate after the excess resin has been removed. The laminate is then opened up using the oven. Following a cure period of 24 h, it is necessary to keep the weight at 25 kg. illustrates the process of fabricating composite materials as well as various hybrid composite laminate compositions (Wei et al., Citation2024).
Figure 2. Preparation of composite materials using the vacuum bag infusion technique.
2.4. Data analysis
The experimental data gathered during testing is examined with the Design Expert analytical program version 11. The methodologies employed are obtaining tensile values, analyzing variance (ANOVA), creating the regression equation using regression analysis and drawing interaction plots between dependent and independent variables for better comprehension.
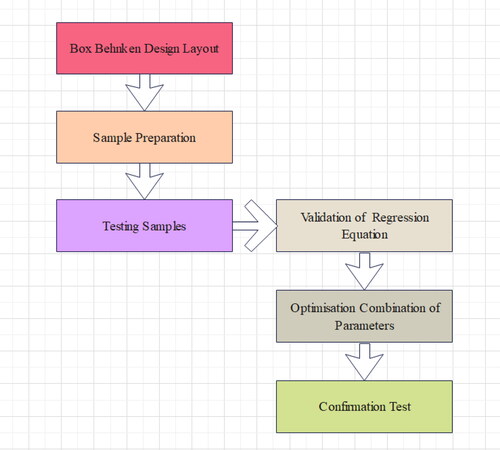
shows a methodical experimental optimization process using the BBD, a statistical multivariate experimentation method. In the first place, using the Box–Behnken configuration, the experimental parameters and the ranges of those values are defined in . In the subsequent step, samples are meticulously crafted following this design to evaluate the impact of parameters on the outcomes. The results of the exhaustive testing of these samples are used to develop a regression equation that makes predictions about the relationships that exist between the variables and the answers. The next step is to conduct a thorough analysis of the accuracy and predictive power of this model; this analysis is referred to as the validation procedure. To determine the optimal combination of factors that will result in the desired outcome, a validated model is utilized. During the final phase, which is known as the confirmation test, it is ensured that the anticipated advantages are attained through the execution of further tests that are designed to practically validate these theoretically ideal conditions. This guarantees that the model will continue to be reliable for use in the future. Through the utilization of statistically sound optimization approaches, this approach not only enhances the efficiency of the process or the characteristics of the product, but it also advances our comprehension of the correlations between parameters and responses.
Figure 3. Flow chart diagram explaining fabrication.
3. Results and discussion
3.1. Tensile testing
The tensile samples are cut according to ASTM D3039/D3039-17 dimensions, as shown in . These samples are typically tested to evaluate the material properties, such as the ultimate tensile stress, modulus of elasticity and elongation at break. The labels, which include combinations of numbers and descriptors like ‘warp,’ ‘weft’ and ‘SP,’ could indicate the orientation of fibers, the type of weave or specific sample preparation methods. Such tests are crucial in materials science to understand the performance of composite materials under tension and the results would contribute to the understanding the enhancement of the mechanical properties when basalt fibers and jute are embedded in an epoxy matrix. This data is valuable for improving composite material designs for applications requiring specific strength-to-weight ratios and other mechanical characteristics (Abdurohman et al., Citation2018). The samples are firmly loaded in the INSTRON machine at both ends with a strain rate of 1 mm/min, ensuring no slip occurs in the grip. The stress-strain curve is plotted automatically. Yield stress, tensile stress and ultimate stress values are noted for all samples. shows the tensile values for the warp and weft directions.
Figure 4. Tensile samples.
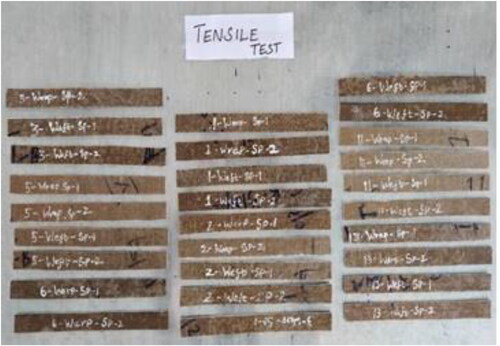
Table 4. Tensile test results in the warp and weft direction.
shows the combination of input parameters for various levels. The samples are prepared based on 17 combinations and tested in the INSTRON machine. The result values show that the ultimate tensile and breaking stress is nearer since the samples are brittle materials. In warp directions, 1.5 wt.% filler, 30 min of sonication and 60 °C increased temperature produce the highest ultimate tensile stress of 34 MPa. In the weft direction, 0.5 wt.% filler, 30 min of sonication and 60 °C increased temperature produce the highest ultimate tensile stress of 36 MPa. The ultimate tensile stress in the warp direction ranges from 16 MPa to 34 MPa as the input parameters change correspondingly. The maximum tensile stress varies from 15.5 MPa to 36 MPa in the weft direction as mentioned in . The experiments are conducted for triplicate samples. The average values are mentioned in .
3.2. Model fitting and ANOVA
3.2.1. Warp direction
shows the ANOVA analysis for the ultimate tensile strength (UTS) quadratic model in the warp direction. The p value of the model is less than 0.05, and the F value is 14.69; the model is significant. The model as a whole is significant, which means that the factors considered together significantly affect the response variable. Factor A (filler weight) and Factor C (temperature) are significant individually, as indicated by their low p values. The 9 df in the model represents only a 0.09% chance for noise to occur in the F value. Except for parameter B, all other model combinations are significant in model terms. The quadratic terms A2 and C2 are significant. This implies that the relationship between the response variable and these factors is not purely linear but likely has a curvature. Parameter B (sonication time) has the most negligible effect on response compared to the other two independent and combined effect parameters (Khan et al., Citation2016). The R2 value of 0.95 shows the model is good to fit and the relation between the dependent variable and the independent variable is much stronger. The Adjusted R2 is 0.8851, and the predicted R2 is 0.7417, which shows the difference is lesser than 0.2. Hence the model is fit to analyze. Certain factors and their interactions have a significant effect on the response variable. The model explains a high proportion of variability in the response, indicating a good fit. However, not all factors are significant and the lack of significance in the lack of fit test suggests the model predictions should closely match the actual data.
(2)
(2)
Table 5. ANOVA results – quadratic regression model for ultimate tensile stress in the warp direction.
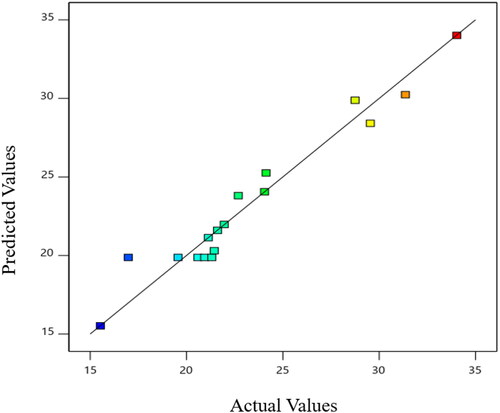
Equation (2) represents the quadratic polynomial regression equation for UTS for warp direction samples. From the equation, the response value increases when independent parameters A and B increase. In that, parameter A (filler weight) plays a predominant role in response results, whereas for the C parameter, the response value drops by increasing the C value. The same condition follows in the combination of parameters. , the scatter plot, illustrates the relationship between the predicted and actual values of the ultimate tensile stress in the warp direction of a material. Each data point represents a specific measurement, with the position along the x-axis indicating the actual measured value and the position along the y-axis representing the predicted value based on a model or algorithm. The diagonal line serves as a reference, indicating the line of perfect prediction where the predicted values would exactly match the actual values. The variety of colors and shapes of the data points may suggest different categories or groups within the dataset, such as various materials or experimental conditions. The clustering of data points along the reference line indicates a strong correlation between the predictions and actual measurements, while the spread of points away from this line points to discrepancies between predicted and actual values. The data point with a diamond shape at the far right end of the plot, also marked with a red color, represents an outlier or a specific point of interest that deviates from the prediction line, suggesting a case where the prediction is significantly different from the actual measurement. Overall, the graph is used to assess the accuracy of the predictive model for ultimate tensile stress in the warp direction (Raja & Kumar, Citation2020). The points, very close to the line, illustrate that the predicted result by ANOVA is much closer to the actual result obtained through the experiment. This shows that the ANOVA result is very stable and the model is fit to analyze.
Figure 5. Predicted vs. actual graph for ultimate tensile stress in the warp direction.
3.3. Weft direction
explains the ANOVA result for the ultimate tensile stress values in the weft direction. The ANOVA results for a quadratic regression model evaluating the impact of filler weight, sonication time and temperature on ultimate tensile stress in the weft direction reveal a significant model effect with a p value of 0.0012, indicating a substantial improvement over the baseline prediction. The model has an F value of 13.70, and a p value of 0.0012 implies that the model is significant and fit for analysis. The p values for the variables A, B and C are less than 0.05, implying that the whole model is significant. For instance, the filler weight squared term alone accounts for a significant proportion of the variance (150.72 sum of squares) with a high F value (28.54) and a low p value (0.0011), underscoring its critical role. All other terms are significant in the combinations term except for the AB combination. The term AB alone does not have an effective role in response prediction. The lack of fit of 5.59 implies only a 0.05% chance of occurring error in the model and is not significant. The R2 value of 0.9463 shows the model is highly significant and fit for analysis. The difference between adjusted R2 (0.877) and the predicted R2 (0.771) is less the 0.2, which implies the error is much less and the model is fit for analysis. The lack of fit test, with an F value of 0.533 and a p value of 0.296, confirms the model’s adequacy in capturing the data trend. Overall, the results underscore the complex interplay between the factors and their squared terms on tensile stress, with the model demonstrating both high explanatory and predictive power (Azim et al., Citation2022).
(3)
(3)
Table 6. ANOVA results – quadratic regression model for ultimate tensile stress in the weft direction.
EquationEquation (3)(3)
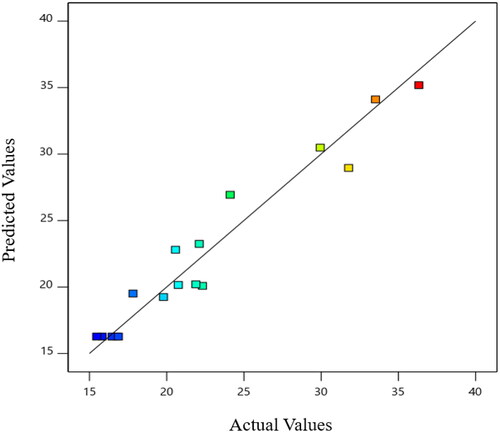
(3) represents the second-order polynomial regression equation for ultimate tensile stress in the weft direction. The equation shows that as the filler weight (A) and the temperature (C) increase, the response decreases two to three times. If the sonication time (B) increases, the response also increases by three times. The same trend follows in combination parameters also. shows the graph comparing predicted values against actual measured values for the ultimate tensile stress in the weft direction of a material. Such a graph is typically used to evaluate the performance of a predictive model: the closer the data points are to the diagonal line, the better the model’s predictions match the actual measurements. In this case, the points, which appear as various shapes and colors – possibly representing different experimental conditions or batches display a good alignment along the diagonal, indicating that the model’s predictions are generally accurate. There seems to be a slight deviation as values increase. But overall, the trend suggests that the predictive model is effective and reliable for estimating the tensile stress in the weft direction within the range of values tested. The points are much closer to the line indicating that the predicted and actual values are closer to each other. This shows that the ANOVA model is stable and fit for analysis.
Figure 6. Predicted vs. actual graph for ultimate tensile stress in the weft direction.
3.4. Effect of parameters
In this model, three parameters are studied: filler weight, sonication time and temperature. 3D response curves are analyzed to investigate the effect of parameters on the response value.
3.4.1. Warp and weft direction
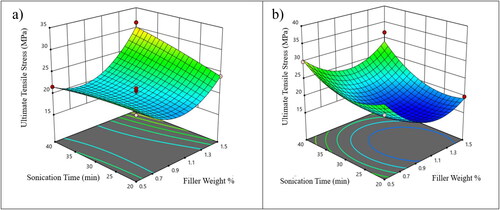
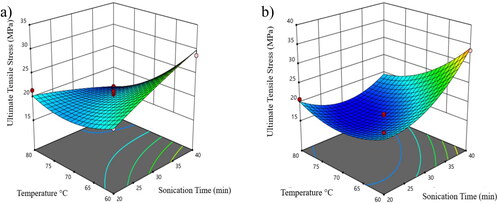
shows the 3D response curve for the effects of filler weight and sonication time on the ultimate tensile stress at a temperature of 70 °C. As the sonication time increases, almost the response is constant, whereas when the filler weight increases, the stress shows a parabolic trend. When the sonication time is 20 min, and the filler weight is 1 wt.%, the ultimate tensile stress is minimum; when the filler weight is 1.5% and the filler weight is 40 min, the response is much higher. shows the effects of filler weight and sonication time on the ultimate tensile stress in the weft direction by keeping the temperature constant at 70 °C. The ultimate tensile stress increases when the sonication time increases and the filler weight decreases (Sudha & Thilagavathi, Citation2016). The maximum ultimate tensile stress is observed at a filler weight of 0.5 wt.% and sonication time of 40 min.
Figure 7. 3D response surface plot showing the effects of filler weight and sonication time a) ultimate tensile stress in warp direction at temperature 70 °C. b) Ultimate tensile stress in the weft direction at temperature 70 °C.
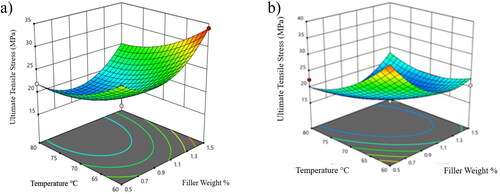
shows the effects of filler weight and temperature on ultimate tensile stress by keeping sonication time constant at 30 min. The figure shows that when the temperature decreases and filler weight increases, the ultimate tensile stress increases (Sudha & Thilagavathi, Citation2016). The maximum tensile stress is observed at a filler weight of 1.5 wt.% and temperature of 60 °C. shows the effects of filler weight and temperature on ultimate tensile stress in the weft direction by keeping sonication time at 30 min. Here, the curve is observed reversely when the temperature and filler weight decrease and the ultimate tensile stress increases. The peak stress is observed when the filler weight is 0.5 wt.% and the temperature is 60 °C. The improvement in ultimate tensile stress with increased sonication time and decreased basalt filler weight in composites can be related to enhanced fiber-matrix interaction. NaOH treatment of basalt fibers, for example effectively removes impurities and increases surface roughness, leading to better fiber-resin compatibility and improved mechanical properties. A well-prepared fiber-matrix interface facilitates better stress transfer and mechanical strength in composites. Specifically, composites with a certain percentage of basalt fiber showed optimized mechanical properties, demonstrating the importance of the filler weight and treatment process.
Figure 8. 3D response surface plot showing the effects of filler weight and temperature a) ultimate tensile stress in warp direction at sonication time 30 min and b) ultimate tensile stress in the weft direction at sonication time 30 min.
shows sonication time and temperature effects on ultimate tensile stress by keeping filler weight at 1 wt.%. The ultimate tensile stress increases when the temperature decreases and the sonication time increases (Chen et al., Citation2019). The maximum tensile stress is observed at the temperature of 60 °C and the sonication time of 40 min. shows sonication time and temperature effects on ultimate tensile stress by keeping filler weight at 1 wt.%. The ultimate tensile stress increases as the temperature and sonication time increase individually. Maximum ultimate tensile stress in the weft direction is observed at the temperature of 60 °C and the sonication time of 40 min. The interface between the basalt fibers and the polymer matrix is critical in composite materials. An increase in basalt fiber content, coupled with a decrease in temperature, may enhance the interfacial adhesion between the fibers and the matrix. This improved adhesion is vital for effective stress transfer from the matrix to the fibers, which is necessary for increasing the composite’s tensile strength. Chemical treatments or surface modifications of basalt fibers can further enhance this interface, leading to even greater increases in tensile strength.
Figure 9. 3D response surface plot showing the effects of sonication time and temperature a) ultimate tensile stress in warp direction at filler weight of 1 wt.% and b) ultimate tensile stress in the weft direction at filler weight of 1 wt.%.
3.5. Optimization and confirmation of the model
Derringer’s desirability function is utilized to optimize the input result to obtain the desired outcome for both Basak et al. (Citation2018). shows the different combinations of input parameters for maximum output. The filler weight of 1.5 wt.%, the sonication period of 40 min, and the temperature of 60 °C provide the ‘highest’ ultimate tensile stress of 40.162 MPa in the warp direction and 35.445 MPa in the weft direction with a 97.9% desire factor, according to . The optimization outcomes are 38.652 MPa in the warp direction and 34.547 MPa in the weft direction, with 4% and 2.5% inaccuracy when utilizing a triplicate model for verification. The ramp settings for the optimized outcome that matches the numbers in . shows a set of optimization plots from a statistical analysis likely involving a BBD or similar RSM. The plots represent different variables: filler weight, sonication time, temperature and UTS for both warp and weft directions of a material. Each plot displays an optimal point (red dot) for a single variable, indicating the value that contributes to the highest desirability within the tested range. The desirability function, combining all the responses into a single metric ranging from 0 to 1, is very high at 0.979, suggesting that the combination of these variable settings is close to the ideal for the process or product being analyzed. The blue dot on the UTS Weft plot indicates an actual observed value that closely matches the model’s prediction, reinforcing the model’s validity. This analysis results in a single optimal solution out of 89 possible combinations, offering a practical decision-making tool for improving the quality or performance of the material being studied (Nguyen & Nguyen, Citation2022; Venkatachalam et al., Citation2015).
Figure 10. Desirability ramp for optimization.
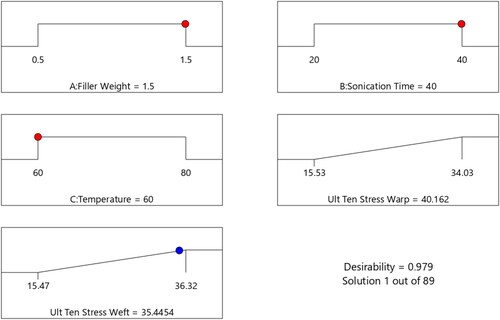
Table 7. Optimized combination derived from the software.
presents a comparison of tensile strengths for various natural fiber-reinforced polymer composites. The reinforcement fibers, derived from plants like pineapple leaf, kenaf, borassus fruit, coir, banana, sisal and a mix of jute and banana, are embedded within polymer matrices such as polyester, polypropylene and epoxy to form the composites. Present work refers to results directly derived from the research being discussed, suggesting that the tensile strength of the jute/basalt-epoxy composite (34.03 MPa) was determined.
Table 8. Comparison of mechanical properties of some natural fiber polymer composites from published work.
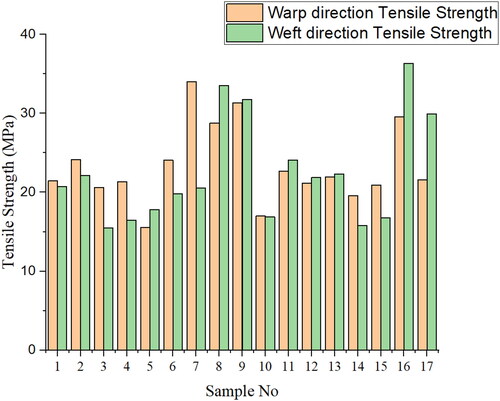
The warp direction refers to the lengthwise, longitudinal threads in a piece of woven fabric. Conversely, the weft direction refers to the widthwise, lateral threads that are woven through the warp. In textile composites, these two directions can have significantly different tensile strengths due to the orientation of fibers, the weaving pattern and the nature of the bond between the fibers. The tensile strength in the warp direction (green bars) is higher than in the weft direction (orange bars) in . This could be due to the alignment of fibers in the warp direction, which typically bears more load during weaving and thus may have a higher tensile strength. There are a few samples where the weft direction tensile strength is nearly equal to or exceeds the warp direction strength. This might occur in fabrics with a balanced weave or in cases where the material properties are isotropic. Tensile stress improvement: 59.39 % in Warp direction and 68.77 % in weft direction compared to jute epoxy-reinforced composite (Venkateshwaran et al., Citation2011).
Figure 11. Graph represents tensile strength in warp and weft direction.
The microstructure of a composite reinforced with basalt and jute fibers, which was created with a filler concentration of 1.5 wt.%, is shown in . To maximize the dispersion of fibers within the matrix, a 40-min sonication period at 60 °C was part of the preparation process. The jute and basalt fibers seem to be evenly distributed throughout the matrix, and the sonication process enhances the fiber wetting at the specified temperature. A dense network of fibers with little agglomeration has been produced by the 1.5 wt.% filler concentration, indicating an effective capacity for stress transfer and possible mechanical strengthening of the composite. The absence of large voids and flaws suggests excellent fiber-polymer matrix interfacial adhesion, which is crucial for composite mechanical performance. The observed interfacial features are suggestive of the improved mechanical interlocking and chemical bonding anticipated for the chosen filler loading and sonication settings, potentially resulting in enhancements to the material’s overall strength and durability (Hossain et al., Citation2013).
Figure 12. Microstructure of jute/basalt fiber reinforced composite.
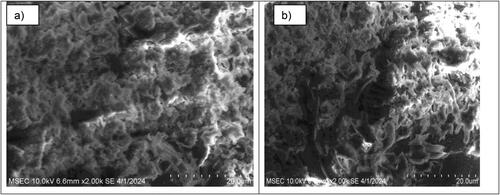
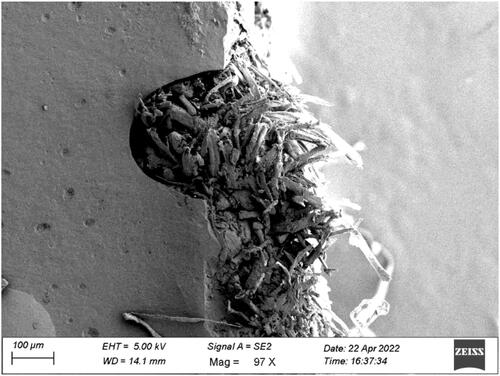
The fracture surface of a composite material reinforced with basalt and jute fibers is presented in using scanning electron microscope (SEM). When fibers are extracted from the matrix material during fracture, this is known as fiber pull-out. The degree of adhesion between the fibers and the matrix can be determined by measuring the length of the pulled-out fibers and the roughness of their surfaces. Because they break before they are drawn out, fibers with good adhesion typically have shorter pulled-out lengths. The matrix around the fibers seems distorted or plastically surrendered, suggesting plastic deformation preceding failure. This deformation can enhance the composite’s toughness by assisting in the absorption of energy during the fracture process. At the fracture surface, broken fibers are visible and their dispersion is apparent. For consistent characteristics, fibers should ideally be spreaded uniformly. The breakdown of the composite may have resulted from the breakage of the fibers, which are the main load-bearing part. Any gaps or spaces, that are evident, may be signs that the fiber bundles are not fully impregnated by the matrix, which could suggest weak spots that could break under stress (Mehdikhani et al., Citation2019).
Figure 13. Fracture surface of Jute/basalt fiber reinforced composite.
4. Conclusion
This experimental investigation reinforces basalt fiber with epoxy matrix in varying percentages and makes composite laminates with oven jute fiber. Optimal input settings for high values of responses are obtained using the BBD method. The factors examined in this experiment of three levels and three parameters were filler weight (wt.%), sonication time and temperature. Using ANOVA, we could determine R2 values of 0.949 for the warp and 0.946 for the weft. A good correlation was established between the experimental value and the value predicted by the regression equation. In the warp and weft directions, the maximum possible ultimate tensile stresses are measured to be 34.03 MPa and 36.32 MPa, respectively. By retaining the filler weight at 1.5 wt.%, the sonication time at 40 min and the temperature at 60 °C, the optimized ultimate tensile stress results are 40.162 MPa for the warp and 35.445 MPa for the weft direction. There are few samples where the weft direction tensile strength is nearly equal to or exceeds the warp direction strength. This might occur in fabrics with a balanced weave or in cases where the material properties are isotropic. For consistent characteristics, fibers should ideally be spreaded uniformly. The breakdown of the composite may have resulted from the breakage of the fibers, which are the main load-bearing part. This study may offer helpful information about using natural fiber-reinforced composites in structural applications.
Author contributions
Vimalanand Suthenthiraveerappa – Design of the work.
Ajithkumar S – Analysis.
Venkatachalam Gopalan – Final approval of the version.
Vignesh Pragasam – Drafting the work.
Aravindh Sampath – Acquisition.
Pandivelan Chinnaiyan – Interpretation of data for the work.
Vinoth Kumar Kalidas – Analysis.
Shenbaga Velu Pitchumani – Drafting the work.
Kulendran Balamurugan – Agreement to be accountable for all aspects of the work.
Rajendiran Gopal – Agreement to be accountable for all aspects of the work.
Disclosure statement
The authors declare that there is no conflict of interest.
Data availability statement
The authors agreed to share the data upon reasonable request.
Additional information
Notes on contributors
Vimalanand Suthenthiraveerappa
Vimalanand Suthenthiraveerappa, M.E., Ph.D., Department of Mechanical Engineering, Composite Materials.
Ajithkumar S
Ajithkumar S, B.E., Department of Mechanical Engineering, Composite Materials.
Venkatachalam Gopalan
Venkatachalam Gopalan, M.Tech., Ph.D., Centre for Innovation and Product Development, Natural fibre polymer composite, Applications of FEA.
Vignesh Pragasam
Vignesh Pragasam, M.E., Ph.D., Project Engineer, EinNel Technologies, Chennai, Natural fibers reinforcement, Composites, Natural composites.
Aravindh Sampath
Aravindh Sampath, M.E., School of Mechanical Engineering, Natural fibre polymer composite.
Pandivelan Chinnaiyan
Pandivelan Chinnaiyan, M.E., Ph.D., School of Mechanical Engineering, Material Forming, Sheet Metal Forming.
Vinoth Kumar Kalidas
Vinoth Kumar Kalidas, M.E., Ph.D., Department of Mechanical Engineering, Composite materials, Metal Forming, Natural Fibers, Polymers composites.
Shenbaga Velu Pitchumani
Shenbaga Velu Pitchumani, M.E., Ph.D., School of Mechanical Engineering, Natural Fiber composites, Optimisation.
Balamurugan Kulendran
Kulendran Balamurugan, ME, Ph.D., Department of Mechanical Engineering, Composite Material, Bio-lubricants, Biofuels, Machine Learning.
Rajendiran Gopal
Rajendiran Gopal, ME, Ph.D., Department of Mechanical and Industrial Engineering, Biodiesel, Automobile.
References
- Abdurohman, K., Satrio, T., Muzayadah, N. L. & Teten. (2018). A comparison process between hand lay-up, vacuum infusion and vacuum bagging method toward e-glass EW 185/lycal composites. Journal of Physics: Conference Series, 1130, 012018. https://doi.org/10.1088/1742-6596/1130/1/012018
- Aly, M., Hashmi, M. S. J., Olabi, A. G., Benyounis, K. Y., Messeiry, M., Hussain, A. I., & Abadir, E. F. (2012). Optimization of alkaline treatment conditions of flax fiber using box–behnken method. Journal of Natural Fibers, 9(4), 256–276. https://doi.org/10.1080/15440478.2012.738036
- Aranno, T. M., Mia, S., Ullah Khan, M. S., Hasan, M. A. M., Shams Supto, N., Shaid Sujon, A., Bin Rashid, A., & Ferdous, M. S. (2019). Fabrication, experimental investigation of jute fiber reinforced epoxy composites and hybrid composites. IOP Conference Series: Materials Science and Engineering, 628(1), 012011. https://doi.org/10.1088/1757-899X/628/1/012011
- Arshad, M. N., Mohit, H., Sanjay, M. R., Siengchin, S., Khan, A., Alotaibi, M. M., Asiri, A. M., & Rub, M. A. (2021). Effect of coir fiber and TiC nanoparticles on basalt fiber reinforced epoxy hybrid composites: physico–mechanical characteristics. Cellulose, 28(6), 3451–3471. https://doi.org/10.1007/s10570-021-03752-7
- Azim, A. Y. M. A., Alimuzzaman, S., & Sarker, F. (2022). Optimizing the fabric architecture and effect of γ-radiation on the mechanical properties of jute fiber reinforced polyester composites. ACS Omega, 7(12), 10127–10136. https://doi.org/10.1021/acsomega.1c06241.
- Balan, G. S., & Ravichandran, M. (2020). Study of moisture absorption characteristics of jute fiber reinforced waste plastic filled polymer composite. Materials Today: Proceedings, 27, 712–717. https://doi.org/10.1016/j.matpr.2019.11.260
- Basak, R., Choudhury, P. L., & Pandey, K. M. (2018). Effect of temperature variation on surface treatment of short jute fiber-reinforced epoxy composites. Materials Today: Proceedings, 5(1), 1271–1277. https://doi.org/10.1016/j.matpr.2017.11.211
- Chen, R. S., Mohd Ruf, M. F. H., Shahdan, D., & Ahmad, S. (2019). Enhanced mechanical and thermal properties of electrically conductive TPNR/GNP nanocomposites assisted with ultrasonication. PLoS One, 14(9), e0222662. https://doi.org/10.1371/journal.pone.0222662.
- Dhand, V., Mittal, G., Rhee, K. Y., Park, S. J., & Hui, D. (2015). A short review on basalt fiber reinforced polymer composites. Composites Part B: Engineering, 73, 166–180. https://doi.org/10.1016/j.compositesb.2014.12.011
- Dilfi, A., Balan, K. F. A., Bin, H., Xian, G., & Thomas, S. (2018). Effect of surface modification of jute fiber on the mechanical properties and durability of jute fiber‐reinforced epoxy composites. Polymer Composites, 39(S4), pp. E2519–E2528. https://doi.org/10.1002/pc.24817
- Dinesh, S., Kumaran, P., Mohanamurugan, S., Vijay, R., Singaravelu, D. L., Vinod, A., Sanjay, M. R., Siengchin, S., & Bhat, K. S. (2020). Influence of wood dust fillers on the mechanical, thermal, water absorption and biodegradation characteristics of jute fiber epoxy composites. Journal of Polymer Research, 27(1), 9. https://doi.org/10.1007/s10965-019-1975-2
- Doddi, P. R. V., Chanamala, R., & Dora, S. P. (2020). Effect of fiber orientation on dynamic mechanical properties of PALF hybridized with basalt reinforced epoxy composites. Materials Research Express, 7(1), 015329. https://doi.org/10.1088/2053-1591/ab6771
- Ghabezi, P., & Harrison, N. (2020). Mechanical behavior and long-term life prediction of carbon/epoxy and glass/epoxy composite laminates under artificial seawater environment. Materials Letters., 261, 127091. https://doi.org/10.1016/j.matlet.2019.127091
- Goodarz, M., Bahrami, S. H., Sadighi, M., & Saber-Samandari, S. (2019). Low-velocity impact performance of nanofiber-interlayered aramid/epoxy nanocomposites. Composites Part B: Engineering, 173, 106975. https://doi.org/10.1016/j.compositesb.2019.106975
- Gopalan, V., Suthenthiraveerappa, V., Tiwari, S. K., Mehta, N., & Shukla, S. (2020). Dynamic characteristics of honeycomb sandwich beam made with jute/epoxy composite skin. Emerging Materials Research, 9(1), 1–12. https://doi.org/10.1680/jemmr.19.00082
- Gopinath, P., Murugesan, P., Manjula Devi, R., Venkatesan, M., Sudha, K., Kannan, J. C., & Keerthika, P. (2021). Characterization of jute fibre-epoxy reinforced composites. Materials Today: Proceedings, 46, 8858–8863. https://doi.org/10.1016/j.matpr.2021.04.434
- Hassan, M. Z., Sapuan, S. M., Roslan, S. A., Aziz, S. A., & Sarip, S. (2019). Optimization of tensile behavior of banana pseudo-stem (Musa acuminate) fiber reinforced epoxy composites using response surface methodology. Journal of Materials Research and Technology, 8(4), 3517–3528. https://doi.org/10.1016/j.jmrt.2019.06.026
- Hossain, M. R., Islam, M. A., Van Vuurea, A., & Verpoest, I. (2013). Tensile behavior of environment friendly jute epoxy laminated composite. Procedia Engineering, 56, 782–788. https://doi.org/10.1016/j.proeng.2013.03.196
- Jamali, N., Rezvani, A., Khosravi, H., & Tohidlou, E. (2018). On the mechanical behavior of basalt fiber/epoxy composites filled with silanized graphene oxide nanoplatelets. Polymer Composites, 39(S4), E2472–E2482. https://doi.org/10.1002/pc.24766
- John, M., & Thomas, S. (2008). Biofibres and biocomposites. Carbohydrate Polymers, 71(3), 343–364. https://doi.org/10.1016/j.carbpol.2007.05.040
- Karnani, R., Krishnan, M., & Narayan, R. (1997). Biofiber‐reinforced polypropylene composites. Polymer Engineering & Science, 37(2), 476–483. https://doi.org/10.1002/pen.11691
- Karthik, K., Rajamani, D., Venkatesan, E. P., Shajahan, M. I., Rajhi, A. A., Aabid, A., Baig, M., & Saleh, B. (2023). Experimental investigation of the mechanical properties of carbon/basalt/SiC nanoparticle/polyester hybrid composite materials. Crystals (Crystals), 13(3), 415. https://doi.org/10.3390/cryst13030415
- Karvanis, K., Rusnáková, S., Krejčí, O., & Žaludek, M. (2020). Preparation, thermal analysis, and mechanical properties of basalt fiber/epoxy composites. Polymers, 12(8), 1785. https://doi.org/10.3390/polym12081785.
- Khalid, M. Y., Arif, Z. U., Sheikh, M. F., & Nasir, M. A. (2021). Mechanical characterization of glass and jute fiber-based hybrid composites fabricated through compression molding technique. International Journal of Material Forming, 14(5), 1085–1095. https://doi.org/10.1007/s12289-021-01624-w
- Khan, G. M. A., Terano, M., Gafur, M. A., & Alam, M. S. (2016). Studies on the mechanical properties of woven jute fabric reinforced poly(l-lactic acid) composites. Journal of King Saud University - Engineering Sciences, 28(1), 69–74. https://doi.org/10.1016/j.jksues.2013.12.002
- Krishnasamy, P., Rajamurugan, G., & Thirumurugan, M. (2021). Dynamic mechanical characteristics of jute fiber and 304 wire mesh reinforced epoxy composite. Journal of Industrial Textiles, 51(4), 540–558. https://doi.org/10.1177/1528083719883057
- Kumar, N., & Singh, A. (2021). Study the effect of fiber orientation on mechanical properties of bidirectional basalt fiber reinforced epoxy composites. Materials Today: Proceedings, 39, 1581–1587. https://doi.org/10.1016/j.matpr.2020.05.707
- Lee, J. J., Song, J., & Kim, H. (2014). Chemical stability of basalt fiber in alkaline solution. Fibers and Polymers, 15(11), 2329–2334. https://doi.org/10.1007/s12221-014-2329-7
- Manzato, L., Takeno, M. L., Pessoa-Junior, W. A. G., Mariuba, L. A. M., & Simonsen, J. (2018). Optimization of cellulose extraction from jute fiber by Box-Behnken design. Fibers and Polymers, 19(2), 289–296. https://doi.org/10.1007/s12221-018-1123-8
- Mehdikhani, M., Gorbatikh, L., Verpoest, I., & Lomov, S. V. (2019). Voids in fiber-reinforced polymer composites: A review on their formation, characteristics, and effects on mechanical performance. Journal of Composite Materials., 53(12), 1579–1669. https://doi.org/10.1177/0021998318772152
- Mishra, S., Mohanty, A. K., Drzal, L. T., Misra, M., & Hinrichsen, G. (2004). A review on pineapple leaf fibers, sisal fibers and their biocomposites. Macromolecular Materials and Engineering, 289(11), 955–974. https://doi.org/10.1002/mame.200400132
- Nguyen, T. A., & Nguyen, T. H. (2022). Study on mechanical properties of banana fiber-reinforced materials poly (lactic acid) composites. International Journal of Chemical Engineering, 2022, 1–7. https://doi.org/10.1155/2022/8485038
- Ou, Y., Zhu, D., & Li, H. (2016). Strain rate and temperature effects on the dynamic tensile behaviors of basalt fiber bundles and reinforced polymer composite. Journal of Materials in Civil Engineering, 28(10). https://doi.org/10.1061/(ASCE)MT.1943-5533.0001615
- Raja, N. D., & Kumar, K. V. A. (2020). Estimation of tensile and compression properties of 2D woven jute and kevlar hybrid laminate. IOP Conference Series: Materials Science and Engineering, 988(1), 012103. https://doi.org/10.1088/1757-899X/988/1/012103
- Ramakrishnan, S., Krishnamurthy, K., Rajeshkumar, G., & Asim, M. (2021). Dynamic mechanical properties and free vibration characteristics of surface modified jute fiber/nano-clay reinforced epoxy composites. Journal of Polymers and the Environment, 29(4), 1076–1088. https://doi.org/10.1007/s10924-020-01945-y
- Sim, J., Park, C., & Moon, D. Y. (2005). Characteristics of basalt fiber as a strengthening material for concrete structures. Composites Part B: Engineering, 36(6–7), 504–512. https://doi.org/10.1016/j.compositesb.2005.02.002
- Singh, J. I. P., Singh, S., & Dhawan, V. (2020). Effect of alkali treatment on mechanical properties of jute fiber-reinforced partially biodegradable green composites using epoxy resin matrix. Polymers and Polymer Composites, 28(6), 388–397. https://doi.org/10.1177/0967391119880046
- Sudha, S., & Thilagavathi, G. (2016). Effect of alkali treatment on mechanical properties of woven jute composites. The Journal of the Textile Institute, 107(6), 691–701. https://doi.org/10.1080/00405000.2015.1061736
- Sudhakara, P., Obi Reddy, K., Prasad, C. V., Jagadeesh, D., Kim, H. S., Kim, B. S., Bae, S. I., & Song, J. I. (2013). Studies on borassus fruit fiber and its composites with polypropylene. Composites Research, 26(1), 48–53. https://doi.org/10.7234/kscm.2013.26.1.48
- Toorchi, D., Tohidlou, E., & Khosravi, H. (2022). Enhanced flexural and tribological properties of basalt fiber-epoxy composite using nano-zirconia/graphene oxide hybrid system. Journal of Industrial Textiles, 51(2), 3238S–3252S. https://doi.org/10.1177/1528083720920573
- Venkatachalam, G., Aravindh, S., Mark, M. P., Shenbaga Velu, P., Bharathraj, K. B., Varghese, A. K., Subramani, V. P., Ramakrishnan, R., & Manickam, S. (2023). Investigation of mechanical characteristics of coir fibre/hexagonal boron nitride reinforced polymer composite. Materials Research Express, 10(12), 125302. https://doi.org/10.1088/2053-1591/ad176c
- Venkatachalam, G., Shankar, A. G., Vijay, K. V., Chandan, B. R., Prabaharan, G. P., & Raghav, D. (2015). Evaluation of tensile strength of hybrid fiber (jute/gongura) reinforced hybrid polymer matrix composites. IOP Conference Series: Materials Science and Engineering, 87, 012108. https://doi.org/10.1088/1757-899X/87/1/012108
- Venkatesh, R., Karthi, N., Kawin, N., Prakash, T., Kannan, C. R., Karthigairajan, M., & Bobe, K. (2022). Synthesis and adsorbent performance of modified biochar with Ag/MgO nanocomposites for heat storage application. Adsorption Science & Technology, 2022. https://doi.org/10.1155/2022/7423102
- Venkateshwaran, N., ElayaPerumal, A., Alavudeen, A., & Thiruchitrambalam, M. (2011). Mechanical and water absorption behaviour of banana/sisal reinforced hybrid composites. Materials and Design., 32 (7), 4017–4021. https://doi.org/10.1016/j.matdes.2011.03.002
- Vinay, S. S., Sanjay, M. R., Siengchin, S., & Venkatesh, C. V. (2022). Basalt fiber reinforced polymer composites filled with nano fillers: A short review. Materials Today: Proceedings, 52, 2460–2466. https://doi.org/10.1016/j.matpr.2021.10.430
- Vinod, A., Vijay, R., & Singaravelu, D. L. (2018). ThermoMechanical characterization of Calotropis gigantea stem powder-filled jute fiber-reinforced epoxy composites. Journal of Natural Fibers, 15 (5), 648–657. https://doi.org/10.1080/15440478.2017.1354740
- Vishnu Vardhini, K., Murugan, R., & Surjit, R. (2018). Effect of alkali and enzymatic treatments of banana fibre on properties of banana/polypropylene composites. Journal of Industrial Textiles, 47 (7), 1849–1864. https://doi.org/10.1177/1528083717714479
- Wang, Y., Wang, Y., Wan, B., Han, B., Cai, G., & Chang, R. (2018). Strain and damage self-sensing of basalt fiber reinforced polymer laminates fabricated with carbon nanofibers/epoxy composites under tension. Composites Part A: Applied Science and Manufacturing, 113, 40–52. https://doi.org/10.1016/j.compositesa.2018.07.017
- Wang, X., Zhao, X., Chen, S., & Wu, Z. (2020). Static and fatigue behavior of basalt fiber-reinforced thermoplastic epoxy composites. Journal of Composite Materials., 54(18), 2389–2398. https://doi.org/10.1177/0021998319896842
- Wei, B., Song, S., & Cao, H. (2011). Strengthening of basalt fibers with nano-SiO2–epoxy composite coating. Materials and Design., 32(8–9), 4180–4186. https://doi.org/10.1016/j.matdes.2011.04.041
- Wei, C., Zhou, Q., Deng, K., Lin, Y., Wang, L., Luo, Y., Zhang, Y., & Zhou, H. (2024). Alkali resistance prediction and degradation mechanism of basalt fiber: Integrated with artificial neural network machine learning model. Journal of Building Engineering, 86, 108850. https://doi.org/10.1016/j.jobe.2024.108850
- Wu, C., Yang, K., Gu, Y., Xu, J., Ritchie, R. O., & Guan, J. (2019). Mechanical properties and impact performance of silk-epoxy resin composites modulated by flax fibres. Composites Part A: Applied Science and Manufacturing, 117, 357–368. https://doi.org/10.1016/j.compositesa.2018.12.003
- Yang, Z., Liu, J., Wang, F., Li, S., & Feng, X. (2019). Effect of fiber hybridization on mechanical performances and impact behaviors of basalt fiber/UHMWPE fiber reinforced epoxy composites. Composite Structures., 229, 111434. https://doi.org/10.1016/j.compstruct.2019.111434