
Abstract
The main objective of this study is to investigate the impact of user preferences and perceived value on traditional handicraft products in terms of customer satisfaction and sales performance through empirical research. The study used a questionnaire to collect data from 299 customers in retail shops of handicraft products in Yunnan Province, China, and used PLS-SEM (Partial Least Squares Structural Equation Modelling) as well as Smart PLS software to analyse the data. The results of the study clearly show that user preferences have a significant positive impact on customer satisfaction, sales performance, and perceived value. Moreover, perceived value was also found to have a positive impact on customer satisfaction and sales performance. In addition, the findings reveal that customer satisfaction has a positive impact on sales performance. Based on these findings, this study further discusses the potential impact on managers.
1. Introduction
Since the official release of China’s Traditional Crafts Revitalisation Plan in 2017, the revitalisation of traditional crafts has received widespread attention from all sectors of society. A total of more than 300 traditional craft projects have been included in the four batches of 1372 representative national intangible cultural heritage project lists announced by the State Council. The core features of traditional crafts lie in creative manual labour and personalised production according to materials, a characteristic that cannot be replaced by industrial production (Strohmayer, Citation2021). Since the 18th Party Congress, localities have been actively implementing the Chinese Traditional Crafts Revitalisation Programme, which has effectively protected traditional craft projects. More than 1100 intangible cultural heritage workshops have been established in impoverished areas, providing local residents with opportunities to increase their income and employment (The Central People’s Government of the People’s Republic of China, Citation2017). 2022 Ten Chinese ministries, including the Ministry of Culture and Tourism, the Ministry of Education, and the Ministry of Science and Technology, jointly issued the Circular on Promoting the High-Quality Inheritance and Development of Traditional Crafts, which aims to promote the creative transformation and innovative development of traditional crafts, and to better serve the economic and social development and the people’s high quality of life. This initiative is considered an important step in promoting the development of traditional craft inheritance and injecting new vigour into traditional crafts (The Central People’s Government of the People’s Republic of China, Citation2022). The Circular suggests that by 2025, the mechanism for high-quality inheritance and development of traditional crafts will be continuously improved, and will further play a role in promoting rural revitalisation, serving high-quality economic and social development, and fostering traditional cultural industries.
Due to its significant influence on customer purchases, user preference has always been of great interest to product designers and marketing professionals (Gkartzonikas & Gkritza, Citation2019). User preferences are a major factor in choice behavior and purchasing decisions. Consumers typically hesitate to buy things whose product qualities are unknown from an economic perspective. Since businesses are more knowledgeable about their products than consumers are, this uncertainty frequently results from incomplete and asymmetric information about the product’s features. In this situation, businesses might use user preferences as a signal that successfully informs customers about their products to remove customer ambiguity. According to Yang et al. (Citation2019), user preferences can also affect how customers evaluate the relative worth of features, qualities, risk perceptions, and information prices while making purchase decisions. Depending on the company’s motivation and capacity to fulfill its commitments, user preferences are seen as a reliable indicator of the qualities of a product (Huang et al., Citation2018). Furthermore, prior studies have demonstrated that user preferences can forecast perceived value (Agmeka et al., Citation2019). Prior research has also demonstrated that user preferences are a requirement for client happiness and sales performance, which is equally significant. User preferences and their effects on client happiness, sales performance, and perceived value in traditional handmade product industries, however, have not received much attention. The customer also becomes increasingly important as company trends shift. To gain market share and boost profitability, businesses must offer items that please customers (Ahani et al., Citation2019). The influence of perceived value on consumer behavior has recently attracted to the attention of academics and craft practitioners (Berg & Lindström, Citation2021). Prior empirical investigations have demonstrated that perceived value can predict both marketability and customer satisfaction (Chae et al., Citation2020; Li et al., Citation2019). However, no research has been done so far in the traditional crafts area on the impact of perceived value on customer satisfaction and marketability performance.
Therefore, the goal of this study is to empirically investigate the effects of user preferences and perceived value on customer satisfaction and sales performance of traditional handicraft products.
2. Literature review and research hypotheses
2.1. User preference
User preference has drawn a lot of attention as a central idea in the study of consumer behavior. It has a significant impact on everyone’s purchase decisions as well as product design, marketing plans, and business competitiveness (Marchand & Marx, Citation2020). A thorough grasp of customer preferences has emerged as one of the essential components for businesses to flourish in the changing business environment in today’s world of increased market competition and diversified consumer wants (Arpah et al., Citation2023). A crucial idea in product design and market competition has been user preference. Product design and company performance depend on an understanding of how user preferences affect perceived value, satisfaction, and market competitiveness.
According to De Kervenoael et al. (Citation2020), perceived value typically includes both the perceived value and the real value that consumers place on a good or service. Prior research has discovered a strong correlation between user preferences and perceived value. User preferences can be thought of as consumers’ propensities toward aspects of a good or service that directly affect how much they value it. Customers are more likely to perceive high value in a product or service when they choose excellent quality, usability, or environmentally friendly characteristics, for instance.
A crucial indicator of how satisfied a consumer is with a product or service overall is their degree of satisfaction. Numerous studies have been done on how user preferences and satisfaction relate. When a product or service matches a consumer’s preferences, they are more likely to buy it, and this matching typically results in increased satisfaction. As a result, satisfaction and user preferences are strongly correlated. According to earlier studies (Shokouhyar et al., Citation2020), consumers are more likely to be satisfied and to repurchase a product or service if it fulfills their preferences.
One of the most important ingredients for business success in a cutthroat market is marketability. One could interpret user choices as a sign of consumer demand. Businesses are more likely to get a competitive edge in the market when they can satiate customer preferences. Previous studies have demonstrated that being aware of and meeting customer preferences can strengthen a company’s position in the market and encourage rivals to act in suit (Otto et al., Citation2020).
To better meet consumer wants and boost the competitiveness of their products or services, businesses in today’s cutthroat business environment must develop a deeper grasp of consumer requirements and preferences. To satisfy customer expectations and be successful in the market, businesses will be better able to design products and implement marketing strategies if they have an understanding of how user preferences affect perceived value, satisfaction, and marketability. To better understand and meet customer requirements, increase market competitiveness, and achieve commercial success, it is crucial for academics to study user preferences, but it is also useful for business decision-makers and marketing specialists.
Therefore, the following hypotheses are proposed in this study:
H1: User preference has a positive effect on perceived value.
H2: User preference has a positive effect on customer satisfaction.
H3: User preference has a positive effect on marketability.
2.2. Perceived value
A key idea in the study of consumer behavior and market rivalry is perceived value, which is crucial in determining the quality, satisfaction, and competitiveness of a product or service. In addition to how a product or service is seen by the customer, perceived value also considers the benefits and psychological satisfaction it actually offers (Zhang & Zhang, Citation2022). A key idea in the study of consumer behavior and market rivalry is perceived value, which is crucial in determining the quality, satisfaction, and competitiveness of a product or service. In addition to how a product or service is seen by the customer, perceived value also considers the benefits and psychological satisfaction it actually offers.
One of the main factors influencing satisfaction is frequently regarded as perceived worth. When consumers believe that a product or service has great value, they are more likely to report higher levels of satisfaction (Shi et al., Citation2021). Perceived value, according to prior study, is a critical factor in deciding whether and to what extent consumers are satisfied. This satisfaction formation not only boosts customer retention but also has a big impact on a company’s long-term success and word-of-mouth advertising (Pagalday et al., Citation2018).
One of the most important ingredients for a company’s success in a cutthroat industry is marketability. One of the essential components for businesses to get a competitive advantage is perceived value. A business is more likely to stand out in the market when a product or service offers consumers a high perceived value. A deeper comprehension of and fulfillment of consumers’ perceived values might help businesses create more competitive strategies that increase market share, according to prior study. This competition encourages rivals to take action to preserve their competitive position in addition to assisting enterprises in winning in a market that is competitive (Das et al., Citation2019). A key factor in product design and market competition is perceived value. It is crucial for product design and business performance because of its significant correlation with satisfaction and market competitiveness.
Therefore, the following hypotheses are proposed in this study:
H4: Perceived value has a positive effect on customer satisfaction.
H5: Perceived value has a positive effect on marketability.
2.3. Customer satisfaction
One of the main topics that has drawn the attention of both industry and academia for a long time is customer satisfaction. In addition to being an essential component of economic success, it is also a significant topic of consumer behavior study. According to Ahrholdt et al. (Citation2019), customer happiness is not just about a company’s financial performance but also includes a variety of important factors, such as product design, market competitiveness, loyalty, and word-of-mouth marketing.
The entire degree of consumer pleasure with a good or service is how customer satisfaction is frequently defined. A wide range of consumer evaluations of product quality, pricing, service, delivery, experience, and expectation gaps are included in this comprehensive concept (Eckert et al., Citation2022). Researchers typically employ a range of techniques, such as surveys, in-depth interviews, observation, and big data analysis, to gauge consumer happiness. These techniques seek to learn about consumers’ levels of satisfaction through their comments and ratings.
Businesses are impacted in a variety of ways by customer satisfaction. First of all, loyal customers are more likely to be satisfied. Customers are more likely to become devoted consumers who keep purchasing and recommending a good or service if they are pleased with it (Dam & Dam, Citation2021). Second, market competitiveness and consumer happiness are tightly tied. Meeting client requirements and expectations is one of the ways businesses may get a competitive edge in the market. Customers who are extremely satisfied are more likely to buy a specific brand or product, increasing the company’s market share (Chuenyindee et al., Citation2022). Last but not least, brand reputation and word-of-mouth marketing are also connected to consumer pleasure. Customers who are happy with the company are more inclined to recommend it to others, bringing in more potential clients. According to Manyanga et al. (Citation2022), this word-of-mouth advertising is intangible marketing propaganda with significant commercial potential.
Customer satisfaction is said to be significantly influenced by several factors, including product design. Customer satisfaction with a product can be impacted by the product’s design elements, functionality, look, and simplicity of use. First off, a customer’s first opinion of the shovel skin is strongly influenced by the product’s aesthetic and functional design. If a product is powerful, appealing in appearance, and satisfies the user’s needs, customers are more likely to be positively happy with it (Bajwa et al., Citation2019). A well-designed product offers a satisfying user experience, which boosts customer satisfaction. For instance, design elements like product look, screen quality, and user interface directly affect customer happiness in the smartphone market. Customer satisfaction can be increased through high-quality design, and customer dissatisfaction can be increased by poor design.
Second, customer satisfaction is significantly influenced by a product’s usability and user experience design. Higher satisfaction scores are typically given to products that are simple to use and offer an appointment scheduling experience. The user experience can be influenced by elements including the user interface’s friendliness, simplicity, and responsiveness (Frank, Citation2021). For instance, a mobile phone application with a simple interface and easy usability is typically well-liked by consumers and has higher satisfaction ratings. A product’s dependability and durability are additional important aspects of the user experience. Users are more likely to be happy with the product if the product design ensures long-term stability and durability.
Customer satisfaction can be impacted by product design in terms of pricing perception. When things are made with high-quality design and craftsmanship, customers are more prepared to tolerate higher prices. According to them, premium design and production are worthwhile investments (Hong & Guo, Citation2019). Therefore, a product’s design can alter how customers perceive its pricing, which in turn influences how satisfied they are. Innovative product design can also draw clients and boost their satisfaction with it. Innovative product design may attract consumers’ interest and draw their curiosity by satisfying their desire for novelty and uniqueness (Cooper, Citation2019). These design advancements can encourage customers to make purchases, boost satisfaction, and aid businesses in standing out in the marketplace. For instance, Apple’s iPhone has seen great success because of its cutting-edge functionality and design. Therefore, to increase customer satisfaction, a thorough understanding and analysis of these elements are necessary (Schofield et al., Citation2020). Product design is intimately tied to elements including appearance, functionality, usability, user experience, reliability, perceived pricing, and innovation, all of which can have an immediate impact on customer satisfaction. To ensure that products match consumer expectations and offer a positive user experience, businesses must give their complete attention to product design (Guo et al., Citation2020). Businesses can achieve long-term success by retaining customers and being competitive in the market by creating well-designed products. Product design has evolved into one of the essential components for business success in today’s competitive industry.
2.4. Marketability
Marketability has drawn a lot of attention as a significant term from both corporations and academia. It is directly tied to a variety of important elements, including customer behavior, product design, and satisfaction, in addition to reflecting a firm’s position and competitiveness in the market (Fan et al., Citation2020). The capacity of a business to succeed in the marketplace and draw in clients is a common definition of marketability. According to Viana et al. (Citation2021), it includes market share, market share growth rate, brand recognition, sales growth, market penetration, and customer acquisition. In addition to competition, the market environment, and external factors, internal elements including product attributes, pricing strategy, customer service, and satisfaction can have an impact on a company’s marketability (Gans & Stern, Citation2003). As a result, one of the most important metrics of a company’s success in a cutthroat market is its marketability.
One of the most crucial elements determining marketability is satisfaction, according to experts. When customers are satisfied with a product or service, they are more likely to stick around, buy more of it, and tell their friends about it, boosting the company’s market share. In general, satisfied consumers spread good word about the business, which draws in additional potential customers (Ahani et al., Citation2019).
Therefore, the following hypotheses are proposed in this study:
H6: Customer satisfaction has a positive effect on marketability.
3. Research methodology
3.1. Measures
The prior study’s construct measures were modified and tailored to the study’s requirements. All of the factors in this study were measured using a 5-point Likert scale. Four user preference factors, four perceived value variables, four customer satisfaction variables, and three marketability variables were all included in this study.
3.2. Data collection and sample
Consumers who bought traditional handcraft items in Yunnan Province, China, provided the survey data. The sample for this study was based on a convenience sample of various age and gender consumer groups in multiple regions of China’s Yunnan Province. The current survey was conducted to determine the sample’s representativeness. Two hundred and ninety-nine valid questionnaires in all were gathered. Males made up 52.5% (157) of the study sample while females made up 47.5% (142). The sample’s wide age range comprised respondents of all ages.
3.3. Analytical approach
PLS-SEM (Partial Least Squares Structural Equation Modelling) analysis will be used to validate these hypotheses to better understand the intricate connections between user preferences, perceived value, satisfaction, and marketability. The model will assist us in determining the mediating function of satisfaction in these connections as well as the effects of user preference and perceived value on satisfaction and marketability of traditional Chinese handcraft products.
The suggested study model was put to the test using PLS-SEM and Smart PLS software. Through two steps of testing—assessment of the measurement model and evaluation of the structural model (PLS-SEM)—the suggested research model and hypotheses were put to the test (Hair et al., Citation2019).
4. Results and discussion
4.1. Results
4.1.1. Evaluating the measurement model
shows the measurement model terms that constructed the results of the analyses.
In this study, the reliability of the study was evaluated using Cronbach’s alpha and composite reliability (CR). To indicate that a construct has enough internal consistency, it is acceptable for it to have a Cronbach’s alpha higher than 0.70 or a Cronbach’s alpha higher than 0.60 and a CR higher than 0.70 (Zeng et al., Citation2021). demonstrates that the independent variables’ Cronbach’s alpha is more than 0.70. As a result, the constructions have reliability and internal consistency.
In this study, extracted average variance (AVE) for all item values and component loadings were used to evaluate convergent validity. According to Ghasemy et al. (Citation2020) factor loadings and AVE should be more than 0.50. All of the items’ AVE values and factor loadings in the current study were higher than 0.50. Consequently, the construct’s convergent validity was good.
Following this, the Fornell-Larcker criterion was used to assess discriminant validity in the study (Magno et al., Citation2022). This criterion includes contrasting the correlations between latent variables with the square root of the average variance extracted (AVE). The strongest correlation between the AVE and any other construct should be exceeded by the square root of the AVE specifically (Manley et al., Citation2021). The findings shown in show that the constructs linked to user preference, perceived value, customer satisfaction, and marketability all have square roots of the AVE that are greater than their individual correlations with other latent variables. Since these constructs have great discriminant validity, we can draw this conclusion.
4.1.2. Evaluating the structural model (PLS-SEM)
4.1.2.1. Evaluating the model fit
and show the results of the structural modelling.
According to the findings shown in and , the chi-square value of 267.163 is significant at the 0.05 level (p = 0.00). The standardised root mean square residual, or SRMR, is a gauge of the suggested research model’s approximate model fit. According to tradition, the SRMR should be <0.08 for the model to have a satisfactory model fit (Zhang et al., Citation2019). According to the data shown in , the model has an SRMR index of 0.043 < 0.08. As a result, the suggested research model accounts for the study’s results. Furthermore, the test for the multicollinearity issue shows that all VIF values are under the 5 threshold. As a result, the multicollinearity issue is not present in the structural model (Hair et al., Citation2020).
4.1.2.2. Hypotheses testing
The findings of the hypothesis testing are shown in . The t-values for H1, H2, H3, H4, H5, and H6 are all >1.96 according to the bootstrap results (5000 resamples) for the inter-construct relationships, and these hypotheses are significant at the 5% level. These theories were therefore accepted.
4.1.2.3. R2 (explained variance), f2 (effect size), and Q2 (predictive relevance)
R2 (explained variance), f2 (effect size), and Q2 (predictive relevance) are the three main evaluation criteria for structural models (Cepeda-Carrión et al., Citation2022). According to Shmueli et al. (Citation2019), the overall impact size metric for structural models is R2. It can be demonstrated that R2 values of 0.19, 0.33, and 0.67 are weak, moderate, and strong, respectively (Mohammadi et al., Citation2020). According to Rodríguez et al. (Citation2020), an f2 value of 0.02 is low, 0.15 is moderate, and 0.35 is high. The Q2 value gauges how well the structural model predicts the behavior of each endogenous structure. Q2 value should be >0 (Law & Fong, Citation2020).
We detected a moderate effect of UP (0.274), followed by CS (0.313) and PV (0.218), with an R2 value of 0.464 (see and ) and <0.67, which is considered a significant effect. Additionally, UP (0.366) and PV’s influence (0.342) together explained 39.8% of the variance in CS. In addition, UP contributed a moderately significant effect (0.588) by explaining 34.5% of the variance in PV.
Also included in are the f2 effect sizes. f2 effect sizes for the UP->PV relationship were fairly large (0.527). The UP->CS (0.146), PV->CS (0.127), and CS->MA (0.110) associations all had medium f2 impact sizes. The UP->MA and PV->MA correlations showed smaller f2 impact sizes (0.080 and 0.052, respectively).
Additionally, demonstrates that all three endogenous components have Q2 values larger than zero. Specifically, the Q2 values for Marketability, Perceived Value, and Customer Satisfaction are 0.357, 0.256, and 0.293, respectively. These outcomes attest to the model’s predictive applicability for the endogenous latent variables.
4.2. Discussion
According to the research model, the current study provides an empirical analysis of how user preferences and perceived value affect customer satisfaction and the marketability of traditional handcraft products. In comparison to earlier studies, the present study’s contribution is to examine and test how user preferences and perceived value affect customer satisfaction and marketability in a different setting. The current study describes the effects of these on the market for traditional crafts, whereas most other studies concentrated on the influence of these on various industries.
The results of the current study show that the six hypotheses in the proposed model are supported.
According to this study, user preference has a favorable impact on customer satisfaction. Customer satisfaction is a predicate of user preference, which has a moderate (=0.366) impact on customer satisfaction and a moderate (f2 = 0.14) impact on the relationship between user preference and customer satisfaction. The findings of this study are confirmed by earlier empirical studies (Prentice et al., Citation2020). The results also demonstrate that marketability is strongly impacted by user preference. User preference was a predictor of marketability, although its impact on marketability was small (=0.274), and the relationship between user preference and marketability had a little (0.080) f2 effect size. The results also show that user preference influences perceived value favorably, that this effect is relatively strong (=0.588), and that the f2 effect size of the relationship between user preference and perceived value is quite significant (0.527).
According to the study’s findings, perceived value has a favorable impact on consumer satisfaction. Customer satisfaction is predicted by perceived value, perceived value has a moderate impact on customer satisfaction (=0.342), and the relationship between perceived value and customer satisfaction has a moderate f2 effect size (0.127). The findings of this investigation are supported by earlier empirical studies (Chen & Lin, Citation2019; Kusumawati & Rahayu, Citation2020). The findings of this study also suggest that perceived value influences marketability in a favorable way. Although perceived value is a requirement for marketability, its impact is minimal (=0.218), and the f2 effect size for the association between perceived value and marketability is negligibly small (0.052). The findings of this study are confirmed by earlier empirical studies (Peng et al., Citation2019).
According to the study’s findings, marketability can be predicted by customer satisfaction, and customer satisfaction has a moderate impact on marketability (=0.313); the relationship between customer satisfaction and marketability has a moderate f2 effect size (0.110). The findings of this investigation are supported by earlier empirical studies.
5. Managerial implications, limitations, and future research
5.1. Managerial implications
This study supports earlier research in that user preferences and perceived value have an impact on customer satisfaction and marketability. Therefore, managers of traditional craft stores should plan and implement strategies that improve how consumers perceive the value of traditional craft products.
According to the study’s findings, customer satisfaction, marketability, and perceived value all depend on user preference. This study will assist traditional craft practitioners in realizing the significance of customer choices on marketability, perceived value, and customer satisfaction. Managers should avoid making claims that products are unavailable because doing so will damage a product’s credibility and, in the long term, lower customer satisfaction and marketability. Although it is theoretically valid, perceived value has not been frequently used in typical craft consumer preference surveys. User preferences were found to have a significant and advantageous influence on perceived value.
Furthermore, the results show that perceived value is crucial for both marketability and customer satisfaction. Therefore, to increase customer satisfaction and marketability, managers need to have a strategy plan to deal with the variations in perceived value. Additionally, the findings demonstrate that marketability is significantly influenced by customer satisfaction. From the standpoint of the consumer, raising customer satisfaction raises marketability. Managers should therefore work harder to boost customer satisfaction, which will increase the marketability of traditional crafts.
5.2. Limitations and future research
There are some limitations to the current investigation. In the beginning, the study focused on a few traditional handcraft stores in Yunnan Province, China, which are not yet typical of other Chinese cities. Second, because the effects of various factors other than user preferences and perceived value on customer satisfaction and the marketability of traditional handicraft products were not examined in this study, future research should concentrate on those effects. Consequently, these restrictions can offer some suggestions for further research.
6. Conclusion
The purpose of this study is to explore in depth the impact of user preferences and perceived value on the satisfaction and market competitiveness of traditional Chinese handicraft products. Through quantitative research and structural equation modelling analysis, this study draws the following main conclusions:
First, user preference plays a crucial role in the traditional Chinese handicraft products industry. Consumers’ product preferences directly affect their satisfaction and the competitiveness of their products in the market. This finding emphasises the importance of product design, packaging, and promotion to satisfy consumer needs and enhance the market appeal of products.
Secondly, perceived value has an equally important impact on product satisfaction and market competitiveness. Consumers do not only focus on the actual function of the product but also on the cultural value, quality, and price that the product represents. This suggests that producers of traditional Chinese handicraft products need to pay attention to the cultural heritage and quality standards of their products to attract more consumers and increase market competitiveness.
Combined with these findings, this study highlights the importance of user preferences and perceived value in the traditional Chinese handicraft industry. These factors are not only key to meeting consumer needs but are also driving forces that promote cultural heritage and foster market competitiveness.
In terms of practical application, the results of this study are of great significance to the Chinese traditional handicraft industry. Industry practitioners can improve product design, pricing strategies, and marketing based on the findings to enhance the market appeal of their products. The findings also contribute to cultural heritage by promoting traditional Chinese culture and quality standards to support the sustainable development and marketing of traditional handicrafts.
Overall, the findings of this study emphasise the importance of user preferences and perceived value on product satisfaction and market competitiveness of traditional Chinese handicrafts, providing industry practitioners and policy makers with practical insights on how to enhance competitiveness and promote cultural heritage. This study provides a valuable reference for future research and industry practice.
Author contributions
Methodology and software, H.L.; validation, H.A.; resources, writing-original draft preparation, writing-review and editing, and visualization, H.L.; supervisor, H.A., and I.S.M.Y. All authors have read and agreed to the published version of the manuscript.
Disclosure statement
No potential conflict of interest was reported by the author(s).
Data availability statement
Not applicable.
Additional information
Funding
Notes on contributors
Haoran Liu
Haoran Liu is a PhD student in the field of culture and design studying at Universiti Putra Malaysia. She is passionate about issues of preservation of traditional knowledge, the impact of design on cultural heritage and sustainability. Dedicated to promoting interdisciplinary research in order to facilitate communication and collaboration in the field of culture and design.
Hassan Alli
Associate Professor Ts. Dr. Hassan Alli is a Senior lecturer at the Department of Industrial Design, Faculty of Design and Architecture, Universiti Putra Malaysia. His research efforts are to improve the current product design and development practices and focus on new product development.
Irwan Syah Md Yusoff
Dr. Irwan Syah Md Yusoff is a Senior Lecturer at the Department of Resource Management and Consumer Studies, Faculty of Human Ecology, Universiti Putra Malaysia. His work focus on Product Design and Sustainability Design.
References
- Agmeka, F., Wathoni, R. N., & Santoso, A. S. (2019). The influence of discount framing towards brand reputation and brand image on purchase intention and actual behaviour in e-commerce. Procedia Computer Science, 161, 1–13. https://doi.org/10.1016/j.procs.2019.11.192
- Ahani, A., Nilashi, M., Yadegaridehkordi, E., Sanzogni, L., Tarik, A. R., Knox, K., Samad, S., & Ibrahim, O. (2019). Revealing customers’ satisfaction and preferences through online review analysis: The case of Canary Islands hotels. Journal of Retailing and Consumer Services, 51, 331–343. https://doi.org/10.1016/j.jretconser.2019.06.014
- Ahrholdt, D. C., Gudergan, S. P., & Ringle, C. M. (2019). Enhancing loyalty: When improving consumer satisfaction and delight matters. Journal of Business Research, 94, 18–27. https://doi.org/10.1016/j.jbusres.2018.08.040
- Arpah, M., Nabella, S. D., & Sina, U. I. (2023). The effect of trust, perception of risk and security on consumer purchase interest in Lazada (empirical study on students of the faculty of economics and business, Ibn Sina University). International Journal of Accounting, Management, Economics and Social Sciences (IJAMESC), 1(4), 304–316.
- Bajwa, D. S., Pourhashem, G., Ullah, A. H., & Bajwa, S. G. (2019). A concise review of current lignin production, applications, products and their environmental impact. Industrial Crops and Products, 139, 111526. https://doi.org/10.1016/j.indcrop.2019.111526
- Berg, H., & Lindström, A. (2021). Online product size perceptions: Examining liquid volume size perceptions based on online product pictures. Journal of Business Research, 122, 192–203. https://doi.org/10.1016/j.jbusres.2020.09.001
- Cepeda-Carrión, G., Hair, J. F., Ringle, C. M., Roldán, J. L., & García-Fernández, J. (2022). Guest Editorial: Sports management research using partial least squares structural equation modeling (PLS-SEM). International Journal of Sports Marketing and Sponsorship, 23(2), 229–240. https://doi.org/10.1108/IJSMS-05-2022-242
- Chae, H., Kim, S., Lee, J., & Park, K. (2020). Impact of product characteristics of limited edition shoes on perceived value, brand trust, and purchase intention; Focused on the scarcity message frequency. Journal of Business Research, 120, 398–406. https://doi.org/10.1016/j.jbusres.2019.11.040
- Chen, S.-C., & Lin, C.-P. (2019). Understanding the effect of social media marketing activities: The mediation of social identification, perceived value, and satisfaction. Technological Forecasting and Social Change, 140, 22–32. https://doi.org/10.1016/j.techfore.2018.11.025
- Chuenyindee, T., Ong, A. K. S., Ramos, J. P., Tri Prasetyo, Y., Nadlifatin, R., Kurata, Y. B., & Sittiwatethanasiri, T. (2022). Public utility vehicle service quality and customer satisfaction in the Philippines during the COVID-19 pandemic. Utilities Policy, 75, 101336. https://doi.org/10.1016/j.jup.2022.101336
- Cooper, R. G. (2019). The drivers of success in new-product development. Industrial Marketing Management, 76, 36–47. https://doi.org/10.1016/j.indmarman.2018.07.005
- Dam, S. M., & Dam, T. C. (2021). Relationships between service quality, brand image, customer satisfaction, and customer loyalty. The Journal of Asian Finance, Economics and Business, 8(3), 585–593. https://doi.org/10.13106/JAFEB.2021.VOL8.NO3.0585
- Das, K., Choudhary, R., & Thompson-Witrick, K. A. (2019). Effects of new technology on the current manufacturing process of yogurt-to increase the overall marketability of yogurt. LWT, 108, 69–80. https://doi.org/10.1016/j.lwt.2019.03.058
- De Kervenoael, R., Hasan, R., Schwob, A., & Goh, E. (2020). Leveraging human-robot interaction in hospitality services: Incorporating the role of perceived value, empathy, and information sharing into visitors’ intentions to use social robots. Tourism Management, 78, 104042. https://doi.org/10.1016/j.tourman.2019.104042
- Eckert, C., Neunsinger, C., & Osterrieder, K. (2022). Managing customer satisfaction: Digital applications for insurance companies. The Geneva Papers on Risk and Insurance-Issues and Practice, 47(3), 569–602. https://doi.org/10.1057/s41288-021-00257-z
- Fan, Y., Jiang, J., & Hu, Z. (2020). Abandoning distinctiveness: The influence of nostalgia on consumer choice. Psychology & Marketing, 37(10), 1342–1351. https://doi.org/10.1002/mar.21370
- Frank, B. (2021). Artificial intelligence-enabled environmental sustainability of products: Marketing benefits and their variation by consumer, location, and product types. Journal of Cleaner Production, 285, 125242. https://doi.org/10.1016/j.jclepro.2020.125242
- Gans, J. S., & Stern, S. (2003). The product market and the market for ‘ideas’: Commercialization strategies for technology entrepreneurs. Research Policy, 32(2), 333–350. https://doi.org/10.1016/S0048-7333(02)00103-8
- Ghasemy, M., Teeroovengadum, V., Becker, J.-M., & Ringle, C. M. (2020). This fast car can move faster: A review of PLS-SEM application in higher education research. Higher Education, 80(6), 1121–1152. https://doi.org/10.1007/s10734-020-00534-1
- Gkartzonikas, C., & Gkritza, K. (2019). What have we learned? A review of stated preference and choice studies on autonomous vehicles. Transportation Research Part C: Emerging Technologies, 98, 323–337. https://doi.org/10.1016/j.trc.2018.12.003
- Guo, Y., Tong, L., & Mei, L. (2020). The effect of industrial agglomeration on green development efficiency in northeast China since the revitalization. Journal of Cleaner Production, 258, 120584. https://doi.org/10.1016/j.jclepro.2020.120584
- Hair, J. F., Howard, M. C., & Nitzl, C. (2020). Assessing measurement model quality in PLS-SEM using confirmatory composite analysis. Journal of Business Research, 109, 101–110. https://doi.org/10.1016/j.jbusres.2019.11.069
- Hair, J. F., Risher, J. J., Sarstedt, M., & Ringle, C. M. (2019). When to use and how to report the results of PLS-SEM. European Business Review, 31(1), 2–24. https://doi.org/10.1108/EBR-11-2018-0203
- Hong, Z., & Guo, X. (2019). Green product supply chain contracts considering environmental responsibilities. Omega, 83, 155–166. https://doi.org/10.1016/j.omega.2018.02.010
- Huang, Y., Li, C., Wu, J., & Lin, Z. (2018). Online customer reviews and consumer evaluation: The role of review font. Information & Management, 55(4), 430–440. https://doi.org/10.1016/j.im.2017.10.003
- Kusumawati, A., & Rahayu, K. S. (2020). The effect of experience quality on customer perceived value and customer satisfaction and its impact on customer loyalty. The TQM Journal, 32(6), 1525–1540. https://doi.org/10.1108/TQM-05-2019-0150
- Law, L., & Fong, N. (2020). Applying partial least squares structural equation modeling (PLS-SEM) in an investigation of undergraduate students’ learning transfer of academic English. Journal of English for Academic Purposes, 46, 100884. https://doi.org/10.1016/j.jeap.2020.100884
- Li, Y., Wu, R., Li, D., & Fan, H. (2019). Can scarcity of products promote or restrain consumers’ word-of-mouth in social networks? The moderating roles of products’ social visibility and consumers’ self-construal. Computers in Human Behavior, 95, 14–23. https://doi.org/10.1016/j.chb.2019.01.013
- Magno, F., Cassia, F., & Ringle, C. M. (2022). A brief review of partial least squares structural equation modeling (PLS-SEM) use in quality management studies. The TQM Journal. Ahead-of-print. https://doi.org/10.1108/TQM-06-2022-0197
- Manley, S. C., Hair, J. F., Williams, R. I., & McDowell, W. C. (2021). Essential new PLS-SEM analysis methods for your entrepreneurship analytical toolbox. International Entrepreneurship and Management Journal, 17(4), 1805–1825. https://doi.org/10.1007/s11365-020-00687-6
- Manyanga, W., Makanyeza, C., & Muranda, Z. (2022). The effect of customer experience, customer satisfaction and word of mouth intention on customer loyalty: The moderating role of consumer demographics. Cogent Business & Management, 9(1), 2082015. https://doi.org/10.1080/23311975.2022.2082015
- Marchand, A., & Marx, P. (2020). Automated product recommendations with preference-based explanations. Journal of Retailing, 96(3), 328–343. https://doi.org/10.1016/j.jretai.2020.01.001
- Mohammadi, R. R., Saeidi, M., & Ahangari, S. (2020). Self-regulated learning instruction and the relationships among self-regulation, reading comprehension and reading problem solving: PLS-SEM approach. Cogent Education, 7(1), 1746105. https://doi.org/10.1080/2331186X.2020.1746105
- Otto, A. S., Szymanski, D. M., & Varadarajan, R. (2020). Customer satisfaction and firm performance: Insights from over a quarter century of empirical research. Journal of the Academy of Marketing Science, 48(3), 543–564. https://doi.org/10.1007/s11747-019-00657-7
- Pagalday, G., Zubizarreta, P., Uribetxebarria, J., Erguido, A., & Castellano, E. (2018). Efficient development and management of after sale services. Procedia Manufacturing, 19, 18–25. https://doi.org/10.1016/j.promfg.2018.01.004
- Peng, L., Zhang, W., Wang, X., & Liang, S. (2019). Moderating effects of time pressure on the relationship between perceived value and purchase intention in social e-commerce sales promotion: Considering the impact of product involvement. Information & Management, 56(2), 317–328. https://doi.org/10.1016/j.im.2018.11.007
- Prentice, C., Weaven, S., & Wong, I. A. (2020). Linking AI quality performance and customer engagement: The moderating effect of AI preference. International Journal of Hospitality Management, 90, 102629. https://doi.org/10.1016/j.ijhm.2020.102629
- Rodríguez, P. G., Villarreal, R., Valiño, P. C., & Blozis, S. (2020). A PLS-SEM approach to understanding e-SQ, e-satisfaction and e-loyalty for fashion e-retailers in Spain. Journal of Retailing and Consumer Services, 57, 102201. https://doi.org/10.1016/j.jretconser.2020.102201
- Schofield, P., Coromina, L., Camprubi, R., & Kim, S. (2020). An analysis of first-time and repeat-visitor destination images through the prism of the three-factor theory of consumer satisfaction. Journal of Destination Marketing & Management, 17, 100463. https://doi.org/10.1016/j.jdmm.2020.100463
- Shi, A., Huo, F., & Hou, G. (2021). Effects of design aesthetics on the perceived value of a product. Frontiers in Psychology, 12, 670800. https://doi.org/10.3389/fpsyg.2021.670800
- Shmueli, G., Sarstedt, M., Hair, J. F., Cheah, J.-H., Ting, H., Vaithilingam, S., & Ringle, C. M. (2019). Predictive model assessment in PLS-SEM: Guidelines for using PLSpredict. European Journal of Marketing, 53(11), 2322–2347. https://doi.org/10.1108/EJM-02-2019-0189
- Shokouhyar, S., Shokoohyar, S., & Safari, S. (2020). Research on the influence of after-sales service quality factors on customer satisfaction. Journal of Retailing and Consumer Services, 56, 102139. https://doi.org/10.1016/j.jretconser.2020.102139
- Strohmayer, A. (2021). Digitally augmenting traditional craft practices for social justice: The partnership quilt. Springer Singapore.
- The Central People’s Government of the People’s Republic of China (2017). Notice of the General Office of the State Council on forwarding the plan for the revitalization of Chinese traditional crafts by the Ministry of Culture and other departments. Retrieved from https://www.gov.cn/zhengce/content/2017-03/24/content_5180388.htm
- The Central People’s Government of the People’s Republic of China (2022). The Ministry of Culture and Tourism and other ten departments issued the notice on promoting the high-quality inheritance and development of traditional crafts. Retrieved from https://www.gov.cn/xinwen/2022-06/28/content_5698282.htm
- Viana, M. M., Polizer Rocha, Y. J., Trindade, M. A., & Alfinito, S. (2021). Consumer preferences for burgers and milk desserts: Evaluating the importance of health claim attributes. Journal of Sensory Studies, 36(1), e12615. https://doi.org/10.1111/joss.12615
- Yang, B., Liu, Y., Liang, Y., & Tang, M. (2019). Exploiting user experience from online customer reviews for product design. International Journal of Information Management, 46, 173–186. https://doi.org/10.1016/j.ijinfomgt.2018.12.006
- Zeng, N., Liu, Y., Gong, P., Hertogh, M., & König, M. (2021). Do right PLS and do PLS right: A critical review of the application of PLS-SEM in construction management research. Frontiers of Engineering Management, 8(3), 356–369. https://doi.org/10.1007/s42524-021-0153-5
- Zhang, C., Liu, Y., Lu, W., & Xiao, G. (2019). Evaluating passenger satisfaction index based on PLS-SEM model: Evidence from Chinese Public Transport Service. Transportation Research Part A: Policy and Practice, 120, 149–164. https://doi.org/10.1016/j.tra.2018.12.013
- Zhang, Y., & Zhang, T. (2022). The effect of blind box product uncertainty on consumers’ purchase intention: The mediating role of perceived value and the moderating role of purchase intention. Frontiers in Psychology, 13, 946527. https://doi.org/10.3389/fpsyg.2022.946527
Appendix A
Figure 1. The proposed research model.
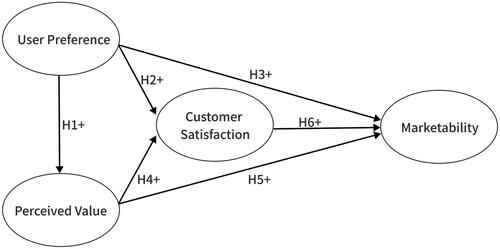
Figure 2. Structural modelling (PLS-SEM) findings.
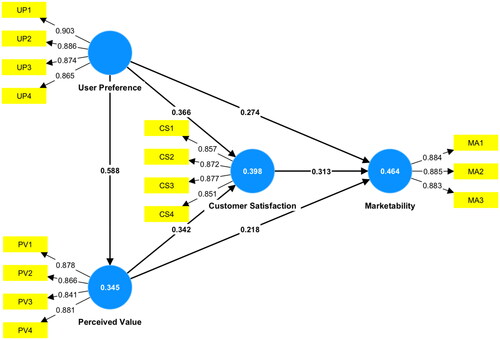
Table A1. Constructs and sources.
Table 1. Measurement model items of the construct’s analysis results.
Table 2. Discriminant validity.
Table 3. Model fit results.
Table 4. Hypotheses testing results.
Table 5. R2, f2, and Q2.