
 ?Mathematical formulae have been encoded as MathML and are displayed in this HTML version using MathJax in order to improve their display. Uncheck the box to turn MathJax off. This feature requires Javascript. Click on a formula to zoom.
Abstract
Substance abuse is an issue of considerable concern due to its devastating effects to families and communities in many countries. We formulate a mathematical model for multiple substance abuse using nonlinear ordinary differential equations. The model includes two classes of individuals in the substance using phase, namely, those using the primary substance of abuse only and those using the primary substance of abuse together with additional substance(s). An epidemic threshold value, , termed the initiation reproduction number, is proposed and defined herein in the substance-using context. It has been shown that the substance-free equilibrium is locally asymptotically stable when
and the system has a unique positive substance-persistent equilibrium if and only if
. The least-squares curve fit routine (lsqcurvefit) in Matlab with optimization has been used to fit the model to data on primary and secondary substance abusers in treatment centres of Cape Town, South Africa. The results indicate a continued decrease in the proportion of primary substance abusers in Cape Town whereas secondary substance abusers shall continue to increase but steadily. Numerical results suggest that there is need to increase treatment efforts targeting secondary substance abusers as this will have more impact in the fight against substance abuse.
PUBLIC INTEREST STATEMENT
The paper proposes a mathematical model describing the dynamics of substance abuse. The model builds upon prior work in mathematical epidemiology by Anderson and May (1991), and, Brauer and Castillo-Chavez (2001). The framework provides an extension of specific population level substance abuse models whose mathematical and numerical analysis provides additional insights into the dynamics of substance abuse with clearly identified set of assumptions. The model is innovative in three ways. First, the model explicitly captures the levels of substance abuse by classifying substance abuse as either primary substance abuse or secondary substance abuse, not considered in past substance abuse models. Second, the model is fitted to data on primary and secondary substance abusers in treatment centres of Cape Town, South Africa. Third, the model can be linked to resource-constrained communities in which rehabilitation processes are underfunded.
Competing interests
The authors declare no competing interests.
1. Introduction
Substance abuse is an issue of considerable concern due to the social and economic costs brought about by substance-related problems such as mental illness, road traffic accidents, work-related accidents, violence and crimes committed under the influence of substances (Van Heerden et al., Citation2009). Substance abuse as defined by Kaufman (Kaufman, Citation1976) refers to the use of a psychoactive substance resulting in serious interference of one’s physical health, social relationships or vocational functioning. Following (Gropper & Burke, Citation1974), “multi-substance abuse” shall herein be defined as the nonmedical abuse of more than one substance.
The major factor attributing to the use or abuse of drugs by man is to alter his mental state (Kaufman, Citation1976). The case of multiple substance abuse considered in this paper involves simultaneous intake of substances so close in time that when the second and later substances are taken, the effects of the primary substance will not have died out. We neglect the stepwise progression of substances which sometimes is the experience of substance abusers (Kaufman, Citation1976). There are many possible combinations of substances of abuse. Generally, substance users combine a preferred substance of abuse with other chosen substances in order to enhance the effects of the primary substance (American Addiction Centers, Citation2019). In this study, we shall consider only the critical pattern of two types of substance abuse, namely, the primary and secondary substance of abuse as captured by the South African Community Epidemiology Network on Drug Use (SACENDU, Citation2019).
Recently, several mathematical studies for the dynamics of drug abuse have been developed (see for instance, Kalula & Nyabadza, Citation2012; Mushanyu, Nyabadza, & Stewart, Citation2015; Mushanyu, Nyabadza, Muchatibaya et al., Citation2015; Mushanyu et al., Citation2016a, Citation2016b; Njagarah & Nyabadza, Citation2013; Nyabadza & Hove-Musekwa, Citation2010; Nyabadza et al., Citation2012; Rossi, Citation2002; White & Comiskey, Citation2007), but consequently, there has been no attempt to investigate the dynamics of multiple substance abuse. The model developed in this study is the first attempt to model the dynamics of multiple substance abuse with particular emphasis on primary and secondary substance abuse. The model developed in this paper is applied to a case study of the Western Cape Province of South Africa. Data used were obtained from SACENDU which monitors alcohol, tobacco and other drug abuse trends from specialist substance use treatment centres in all nine provinces that now comprise the South African Community Epidemiology Network on Drug Use. The provinces include the Western Cape (WC), KwaZulu-Natal (mostly Durban and Pietermaritzburg), Eastern Cape (Port Elizabeth and East London), Gauteng province, Mpumalanga and Limpopo provinces (now termed the Northern Region [NR]), and the Central Region (comprising of the Free State, Northern Cape and North-West provinces [CR]; SACENDU, Citation2019). Poly-substance use remains high in the Western Cape Province of South Africa as compared to other provinces, with majority of patients indicating the use of more than one substance of use.
The paper is arranged as follows: in Section , we formulate and establish the basic properties of the model. The model is analysed for stability in Section
. In Section
, we carry out some numerical simulations and parameter estimation. Numerical results are also presented in this section. The paper is concluded in Section
.
2. Model formulation
We propose a mathematical model that takes into account the dynamics of multiple substance abuse. To this effect, we include two separate classes of individuals in the substance using phase, that is, those who abuse only one substance of abuse and those who use more than one substance of abuse. The human population is thus divided into seven distinct classes, namely, ,
,
,
,
,
and
. The class
represents the population at risk of being initiated into substance abuse. The class
denotes those initiated into substance abuse and only using the primary substance of abuse. The class
represents primary substance abusers in treatment. In this paper, we assume that treatment is on an “inpatient” basis and individuals are released from treatment centres when they have recovered. So we allow for the class of the recovered. Thus, the class of recovered primary substance abusers is denoted by
. It is upon this stage that a relapse can only occur. Individuals in the recovered primary substance abusers’ class relapse back to the class
at a rate
. The class
denotes individuals at the secondary stage of substance abuse, that is, those abusing their primary substance of abuse together with additional substance(s). The class
represents secondary substance abusers in treatment. The class of recovered secondary substance abusers is denoted by
. Individuals in the recovered secondary substance abusers’ class relapse back to the class
at a rate
. The total population is thus given by:
Susceptible humans enter the population through birth or immigration at a rate . Susceptible individuals are initiated into substance use following interaction with individuals using substances. Substance users in treatment cannot initiate non-substance users since they are completely immersed in the program and separated from the general population. An initiation function that is analogous to the force of infection for epidemic models is assumed. Thus, the per capita contact rate
is a product of the effective number of contacts
, between substance users and the susceptible population, and the probability
, that a contact results in initiation into substance use, that is,
. A fraction
of the contacts is with the primary substance abusers and the average number of potential contacts resulting in susceptible individuals becoming substance abusers is
. Also, a fraction
of the contacts is with individuals at the secondary stage of substance abuse. The average number of potential contacts of each susceptible individual with individuals at the secondary stage of substance abuse is
. The parameter
measures the relative ability for individuals in the secondary substance abuse phase to initiate new substance users. Assuming that the rate at which individuals in
initiate new recruits is lower than that of individuals in
, it follows that
. This is due to the fact that individuals in class
have an enhanced familiarity with substance abuse as compared to individuals in class
and this gives them more potential to recruit new substance abusers. The total number of relevant contacts gives the initiation function,
Upon being initiated into substance use, a susceptible individual moves into the compartment , of primary substance abusers. We assume that there is a slow progression of individuals from the susceptible class to the substance using class. Thus, individuals in the secondary stage of substance abuse are as a result of primary substance abusers progressing to secondary substance abuse at a rate
. The model developed in this paper also allows for an ameliorative process of individuals in class
. As such, individuals in the secondary substance use phase can revert back to the primary substance abuse class
at a rate
. Upon realizing the negative effects associated with substance abuse, individuals in compartments
and
can seek help via rehabilitation programmes at rates
and
, respectively. Also, some individuals in compartments
and
can naturally recover at rates
and
, respectively. Substance users in classes
and
experience substance-related death at rates given by
and
, respectively. Once an individual is in the rehabilitation phase, he/she can successfully recover. Individuals in class
recover successfully at a rate
and individuals in class
recover successfully at a rate
. Individuals experience natural death at a rate
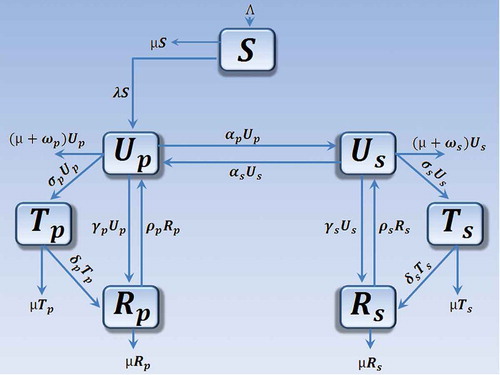
. We assume that individuals in each compartment are indistinguishable and there is homogeneous mixing so that those at risk of substance use are equally susceptible. In practice, susceptibility to substance use varies. This is due to differences in behavioural, social and environmental factors. The schematic diagram (Figure ) shows the movement of humans as their status with respect to substance use changes.
Figure 1. Model flow diagram
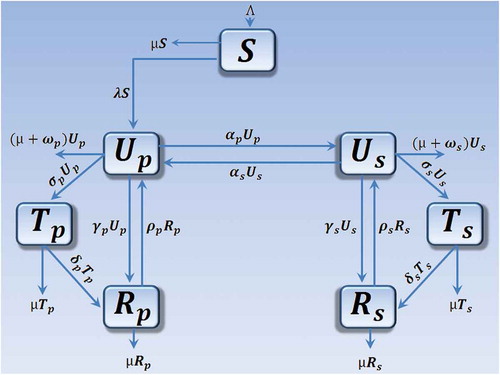
Combining the parameters, assumptions and the schematic diagram (Figure ), we obtain the following set of nonlinear ordinary differential equations:
with the initial conditions:
where we assume that all the model parameters are positive.
3. Model analysis
3.1. Positivity of solutions
We now consider the positivity of system (2.2). We prove that all the state variables remain non-negative and the solutions of system (2.2) with positive initial conditions will remain positive for all . We thus state the following theorem.
Theorem 3.2. Given that the initial conditions of system (2.2) are ,
,
,
,
,
and
. There exists
which solve system (2.2).
Proof. Assume that
Thus , and it follows from the first equation of system (2.2) that
Thus, we can solve the above equation with the help of the integrating factor technique for solving first-order linear differential equations to obtain
So,
giving
From the second equation of system (2.2), we obtain
In a similar fashion, it can also be shown that ,
,
,
and
for all
, and this completes the proof.
3.2. Invariant region
It follows from system (2.2) that
Solving leads to
Thus,
That is, where
represents the value of EquationEquation (2.2
(2.2)
(2.2) ) evaluated at the initial values of the respective variables. Then,
. Thus, the feasible region for system (2.2) is
It is easy to verify that the region is positively invariant with respect to system (2.2).
3.3. Substance-free equilibrium and the initiation reproduction number
The model has a substance-free equilibrium given by:
a scenario depicting a substance-free state in the community or society. The initiation reproduction number of the model is defined herein in the substance-using context as the average number of people that each substance user will initiate to substance use during their substance-using career in a population of completely potential substance users. Usually,
implies that substance abuse will die out, whereas
implies that substance abuse will persist within a community and
requires further investigation. The determination of
is done using the next-generation matrix approach (Van den Driessche & Watmough, Citation2002). Using this method, the reproduction number of system (2.2) is the spectral radius of the next- generation matrix
where
Thus,
with
We can clearly note that
Therefore, is non-negative. Here,
is the sum of two sub-reproduction numbers representing the contributions of individuals in compartments
and
, respectively.
We now show that substance abuse can be eliminated from the community (when ) if the initial sizes of the sub-populations of the model are in the basin of attraction of the substance-free equilibrium. We thus have the following theorem (Theorem 3.5).
Theorem 3.5. The substance-free equilibrium is locally asymptotically stable when
and is unstable when
.
Proof. The Jacobian matrix of system (2.2) at is given by
where ,
,
,
,
and
are defined as before. The local stability of the substance-free equilibrium is determined by the following submatrix of
,
Since all off-diagonal elements are positive, we now consider matrix . We claim that
is an
-matrix. Multiplying matrix
by the positive
matrix
we have
where is a positive
matrix given by
Then, it follows from -matrix theory that all eigenvalues of
have negative real parts, which implies the local asymptotic stability of the substance-free equilibrium if
. On the other hand, it can be shown that the determinant of
is given by
Thus, if , then matrix
has eigenvalues with negative real parts, which implies the stability of the substance-free equilibrium. This completes the proof.
3.4. Substance-persistent equilibrium
The substance-persistent equilibrium always satisfies
From the third, fourth, fifth, sixth and seventh equation of (3.3), we get that
Adding the first and second equations of (3.3) leads to
Using (3.4) to solve (3.5) for in terms of
leads to
Substituting (3.4) and (3.6) into the first equation of (3.3) and solving for leads to
which corresponds to the substance-free equilibrium or
Substituting (3.7) into expressions (3.4) and (3.6) gives the substance-persistent equilibrium . We thus have the following result on the existence of the substance-persistent equilibrium.
Theorem 3.7. System (2.2) has a positive substance-persistent equilibrium if and only if .
4. Numerical simulations
4.1. A case study for the Western Cape Province of South Africa
We present an application of our model to a case study of the Western Cape Province of South Africa. We focus mainly on the trends of polysubstance use. Data collected by the Medical Research Council (MRC) from specialists at substance abuse treatment centres in Cape Town (as part of the SACENDU, Citation2019) show that poly-substance use remains high over the recent years. Based on data from SACENDU, patients who seek treatment for substance abuse-related problems are categorized as either primary substance abusers or those abusing two or more substances. However, a few reports have indicated the number of substances abused by patients seeking treatment with some patients indicating that they have abused up to four substances. Since most SACENDU reports over the years have combined those abusing more than one substance into one class of individuals, the model in this paper considers such a setting for purposes of illustrating trends of poly-substance abuse. The data used are for the period covering the first half of up to the first half of
.
4.1.1. Parameter estimation
We make use of curve fitting in Matlab to estimate model parameters used in our numerical simulations. Curve fitting is a process that allows us to quantitatively estimate the trend of the outcomes where equations of approximating curves are fit to the raw field data (Mushanyu, Nyabadza, & Stewart, Citation2015). Nevertheless, for a given set of data, the fitting curves of a given type are generally not unique. Thus, a curve with a minimal deviation from all data points is desired. This best-fitting curve can be obtained by the method of least squares (Mushanyu, Nyabadza, & Stewart, Citation2015). The least-squares curve fit routine (lsqcurvefit) in Matlab with optimization is used to estimate the parameter values. Many parameters are known to lie within some intervals. During the estimation of parameter values, unknown parameter values are given a lower and upper bound from which the set of parameter values that provide the best fit are obtained. The parameters obtained from curve fitting and intervals used are given in Table where data for primary substance abusers were used. We present an application of system (2.2) through fitting the model to data from the MRC’s SACENDU project. We fit the model system (2.2) to data on poly-substance use in Cape Town of South Africa. Also, we estimate the incidence of primary substance abusers using data on poly-substance use in the Western Cape Province of South Africa. Our estimated incidence of primary substance abuse is evaluated using the initiation function given in (2.1). We use data in Table which was collected by SACENDU (Citation2019).
Table 1. Polysubstance use in the Western Cape Province of South Africa for the period a to
a
. Letter “a” represents the first 6 months of the year and “b” represents the last 6 months of the year
Table 2. Parameter values and ranges obtained from data fitting using data for primary substance abusers in Cape Town
4.1.2. Results
Figure ) shows the trend in the proportion of primary substance abusers in treatment centres of Cape Town. The model fits well with the data from Table . The results show that the proportion of primary substance abusers in Cape Town shall continue to steadily decrease over the years. However, the proportion of primary substance abusers continues to dominate that of secondary substance abusers. Parameter values estimated using data for primary substance abusers in Cape Town are shown in Table . This estimation assumes that the dynamics remain the same over the entire period. Figure ) shows the estimated incidence of primary substance abusers using data for primary substance abusers in the Western Cape Province of South Africa. We note that there is a steady increase in the incidence of primary substance abuse between the years 2001 and 2003 after which the incidence begins to decline up to the year 2010. After the year 2010, we observe some slight increase in the incidence of primary substance abusers up to the year 2018. Figure shows the trend in the proportion of primary substance abusers in treatment centres of Cape Town projected up to the year 2030. We note from the projected trend that the proportion of primary substance abusers will continue to decrease. Figure ) shows the projected incidence of primary substance abuse in Cape Town up to the year 2030. We observe that the incidence of primary substance abuse shall continue to steadily increase up to the year 2030.
Figure 2. (a) System (2.2) fitted to data for primary substance abusers in Cape Town. The blue circles indicate the actual data and the solid red line indicates the model fit to the data. (b) Estimated incidence of primary substance abusers in Cape Town
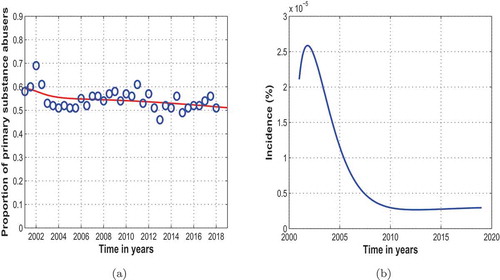
Figure 3. (a) System (2.2) fitted to data for primary substance abusers in Cape Town and projected up to the year 2030. The blue circles indicate the actual data and the solid red line indicates the model fit to the data. (b) Estimated incidence of primary substance abusers in Cape Town and projected up to the year 2030
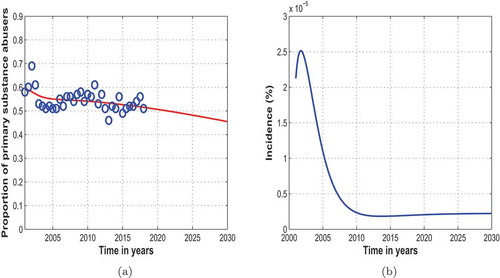
Figure 4. System (2.2) fitted to data for secondary substance abusers and projected up to the year
in Cape Town. The blue circles indicate the actual data and the solid red line indicates the model fit to the data
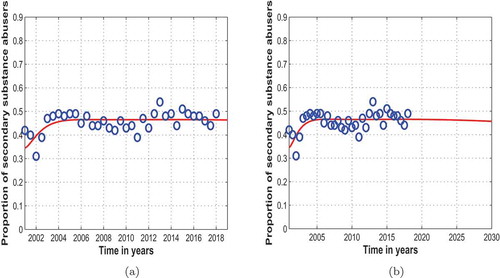
Figure shows the trend in the proportion of secondary substance abusers in treatment centres of Cape Town. Figure
shows that the model fits well with the data from Table . The results show that the proportion of secondary substance abusers in Cape Town shall steadily increase over the years. Figure
shows the projected trends in the proportion of secondary substance abusers in treatment centres of Cape Town up to the year
. The figure shows that the projected proportion of secondary substance abusers will not differ much with the current observed proportion.
4.2. Numerical results
We carry out detailed numerical simulations using Matlab to support our theoretical findings. Numerical solutions of a model depend on the values of all its parameters. The initial conditions used are: ,
,
,
,
,
,
.
Figure 5. General population trajectory of individuals in class , (a); class
, (b) and class
, (c)
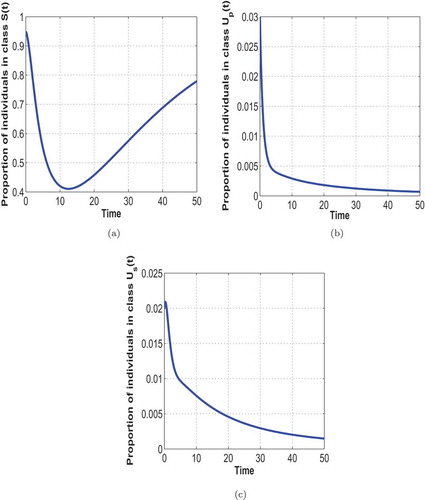
Figure 6. General population trajectory of individuals in class , (a); class
, (b); class
, (c) and class
, (d)
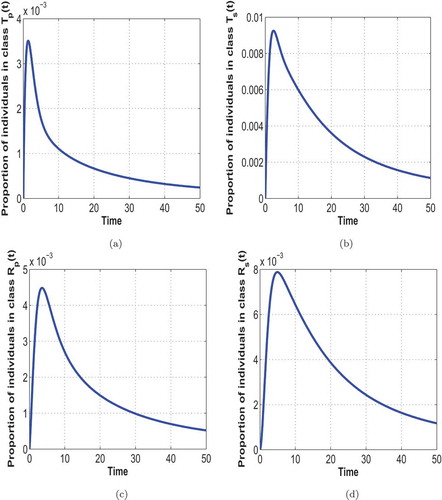
Figure 7. Effects of varying ,
,
,
,
,
and
,
on the prevalence of substance abuse, starting from
up to
with a step size of
across all the parameters
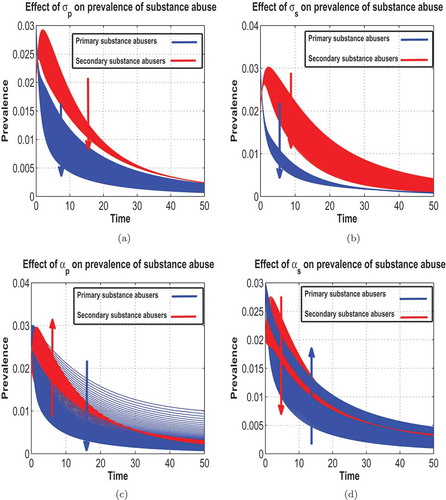
Figure and Figure illustrate the general population trajectory of individuals in classes S(t), Up(t), Tp(t), Rp(t), Us(t), Ts(t) and Rs(t). Figure illustrates the effect of varying parameters ,
,
and
on the prevalence of substance abuse. Figure
shows that increasing the parameter
leads to a decrease in the prevalence of both primary and secondary substance abusers. Also, Figure
shows that increasing the parameter
leads to a decrease in the prevalence of both primary and secondary substance abusers. However, we observe that the parameter
has more positive impact in reducing the prevalence of both primary and secondary substance abusers as compared to the parameter
. Figure
shows that increasing the parameter
results in a decrease in the prevalence of primary substance abusers and an increase in the prevalence of secondary substance abusers. Lastly, Figure
shows that increasing the parameter
results in an increase in the prevalence of primary substance abusers and a decrease in the prevalence of secondary substance abusers. We note from Figure that although the prevalence of substance abuse either increases or decreases when a parameter is varied, the prevalence change for secondary substance abuse always dominates that of primary substance abuse. Thus, more effort should be directed towards ensuring adequate treatment of secondary substance abusers as this will substantially contribute to the control of substance abuse in the general population.
5. Conclusion
The goal of this paper is to model the trends of primary and secondary substance abuse in the Western Cape Province of South Africa. As such, the model developed in this paper explicitly captures the levels of substance abuse by classifying substance abuse as either primary substance abuse or secondary substance abuse, not considered in past substance abuse models. Structuring the model in such a way enables the application of the model to data from SACENDU.
An epidemic threshold termed the initiation reproduction number, , has been derived and qualitatively used to analyze the model equilibria. The substance-free equilibrium point is shown to be locally asymptotically stable whenever the initiation reproduction number
is less than unity. It was also shown that the system has a positive unique substance-persistent equilibrium if and only if
. The least-squares curve fit routine (lsqcurvefit) in Matlab with optimization has been used to fit the model to data on primary and secondary substance abusers in treatment centres of Cape Town of South Africa. The model was observed to fit well with these data and parameter values from model fitting were obtained. Performing a visual predictive check on the graphs from data fitting suggests that the proportion of primary substance abusers in Cape Town shall continue to decrease over the years whereas that of secondary substance abusers shall continue to increase but steadily. However, the proportion of primary substance abusers shall continue to dominate that of secondary substance abusers.
Numerical simulations have also been performed to support theoretical results. For illustrative purposes, we have chosen a few important parameters, namely, ,
,
and
. The results obtained suggest that there is need to increase control efforts targeting secondary substance abusers as this will have more impact in the fight against substance abuse. This, however, should not be taken to mean that control measures should do away with primary substance abusers, rather a concerted effort on both substance abusing classes is perceived to achieve enhanced positive results.
The study presented here is not exhaustive. We want to acknowledge that restricting our model to the primary and secondary substance abuse levels only has some implications in limiting the results of this study. Thus, depending on the availability of data, some future work on the model can be done by extending it to include more levels of substance abuse, for instance, primary substance abusers, primary substance abusers, primary
substance abusers
substance abusers and so on.
Acknowledgements
The authors acknowledge, with thanks, the support of their respective departments for the production of this manuscript.
Additional information
Funding
Notes on contributors

Josiah Mushanyu
Josiah Mushanyu (PhD) is a Senior Lecturer in the Department of Mathematics, Faculty of Science, University of Zimbabwe. F. Nyabadza (PhD) is a Professor in Applied Mathematics and Deputy HOD, Department of Mathematics and Applied Mathematics, Faculty of Science, University of Johannesburg. P. Mafuta (PhD) is a Senior Lecturer in the Department of Mathematics, Faculty of Science, University of Zimbabwe. The authors’ research interests include Mathematical Modelling and Application of Graph Theoretic Approaches to Mathematical Biology.
References
- American Addiction Centers. (2019). Polysubstance use and abuse: The unique treatment needs of polydrug users. Retrieved June 3, 2019, from https://americanaddictioncenters:org/polysubstance – abuse
- Gropper, B. A., & Burke, M. I. (1974, December 12–18). Characteristics of multi-drug abuse incidence and abuser populations. Presented at North American Congress on Alcohol and Drug Problems.
- Kalula, A. S., & Nyabadza, F. (2012). A theoretical model for substance abuse in the presence of treatment. South African Journal of Science, 108(3–4). article number 654. http://dx.doi.org/10.4102/sajs.v108i3/4.654
- Kaufman, E. (1976). The abuse of multiple drugs. 1. Definition, classification, and extent of problem. The American Journal of Drug and Alcohol Abuse, 3(2), 279–18. https://doi.org/10.3109/00952997609077197
- Mushanyu, J., Nyabadza, F., Muchatibaya, G., & Stewart, A. G. R. (2015). Modelling multiple relapses in drug epidemics. Ricerche di matematica, 65(1), 37–63. https://doi.org/10.1007/s11587-015-0241-0
- Mushanyu, J., Nyabadza, F., Muchatibaya, G., & Stewart, A. G. R. (2016a). On the role of imitation on adolescence methamphetamine abuse dynamics. Acta biotheoretica, 65(1), 37–61. https://doi.org/10.1007/s10441-016-9302-3
- Mushanyu, J., Nyabadza, F., Muchatibaya, G., & Stewart, A. G. R. (2016b). Modelling drug abuse epidemics in the presence of limited rehabilitation capacity. Bulletin of Mathematical Biology, 78(12), 2364–2389. https://doi.org/10.1007/s11538-016-0218-5
- Mushanyu, J., Nyabadza, F., & Stewart, A. G. R. (2015). Modelling the trends of inpatient and outpatient rehabilitation for methamphetamine in the Western Cape province of South Africa. BMC Research Notes, 8. article number 797. https://doi.org/10.1186/s13104-015-1741-4
- Njagarah, J. B. H., & Nyabadza, F. Modelling the impact of rehabilitation, amelioration and relapse on the prevalence of drug epidemics. (2013). Journal of Biological Systems, 21(1), 1350001. article ID 1350001. https://doi.org/10.1142/S0218339013500010
- Nyabadza, F., & Hove-Musekwa, S. D. (2010). From heroin epidemics to methamphetamine epidemics: Modelling substance abuse in a South African Province. Mathematical Biosciences, 225, 132–140. https://doi.org/10.1016/j.mbs.2010.03.002
- Nyabadza, F., Njagarah, J. B. H., & Smith, R. J. (2012). Modelling the dynamics of crystal Meth (‘Tik’) abuse in the presence of drug-supply chains in South Africa. Bulletin of Mathematical Biology, 75(1), 24–48. https://doi.org/10.1007/s11538-012-9790-5
- Rossi, C. (2002). The role of dynamic modelling in drug abuse epidemiology. Bulletin on Narcotics, LIV (1 and 2), 33–44.
- South African Community Epidemiology Network on Drug Use (SACENDU). Retrieved May 8, 2019, from http://www.mrc.ac.za/intramural-research-units/ATOD-sacendu
- Van den Driessche, P., & Watmough, J. (2002). Reproduction numbers and sub-threshold endemic equilibria for compartmental models of disease transmission. Mathematical Biosciences, 180, 29–48. https://doi.org/10.1016/S0025-5564(02)00108-6
- Van Heerden, M. S., Grimsrud, A. T., Seedat, S., Myer, L., Williams, D. R., & Stein, D. J. (2009). Patterns of substance use in South Africa: Results from the South African stress and health study. South African Medical Journal = Suid-Afrikaanse Tydskrif Vir Geneeskunde, 99(4), 358–366.
- White, E., & Comiskey, C. (2007). Heroin epidemics, treatment and ODE modelling. Mathematical Biosciences, 208, 312–324. https://doi.org/10.1016/j.mbs.2006.10.008