
 ?Mathematical formulae have been encoded as MathML and are displayed in this HTML version using MathJax in order to improve their display. Uncheck the box to turn MathJax off. This feature requires Javascript. Click on a formula to zoom.
ABSTRACT
Nanoionic and photoionic reconfigurable oxides and chalcogenide semiconductors are emerging material platforms for field-based, non-volatile control of electrons and photons in nanoscale optoelectronic device architectures. Their potential low-power requirements, athermal switching mechanism and mixed-mode operation, have facilitated the demonstration of a wealth of highly promising application-driven optoelectronic devices over the last decade that address growing global demands requiring low-power, high-speed, and high-density data storage and signal modulation in ultra-compact architectures. This review highlights advancements in such ion-migration-based materials, fundamental mechanisms, device architectures, and their impact on the observed reconfigurable performance with a view to applications in optical and electronic data storage, signal modulation and beyond-classical computing.
Graphical Abstract
1. Introduction
Creating optical devices with tunability and reconfigurability is advantageous for a range of applications as they allow for fine-tuning their functionalities post-fabrication. This characteristic facilitates the development of flexible and dynamic optical computing architectures, adaptive optical communication systems, and intelligent data processing paradigms. Diverse reconfiguration mechanisms have been investigated, including but not limited to thermo-optic effects [Citation1], electro-optic (plasma dispersion) [Citation2], and nano-optomechanical phenomena [Citation3]. The volatile nature of these reconfiguration techniques demands a constant power bias to maintain the desired modulation state, which limits their utility for applications that have memory requirements and drastically increases power requirements. Furthermore, achievable on/off ratios in conventional silicon-based modulators are often small, resulting in reduced contrast between modulation states and large-footprint devices to accumulate the required signal perturbation [Citation4–6]. Addressing these challenges is an active field of study, with current efforts concentrating on finding alternative materials, better device configurations, and novel modulation approaches.
Phase transition in transition metal oxides [Citation7–9] and chalcogenides [Citation10,Citation11] have demonstrated great potential as volatile and non-volatile reconfigurable material platforms due to their high compatibility with CMOS fabrication processes and the substantial contrast in optical properties between two reversible states. The transitions can be manipulated via thermal, electrical, and optical stimuli, significantly modifying the electrical and optical device response [Citation12]. Among the phase transition oxide systems, Vanadium dioxide (V O2) is widely utilized, taking advantage of its transition between dielectric and metallic phases. The transition from monoclinic to tetragonal crystal structures at approximately 340 K brings about a significant heterogeneity in permittivity, resistivity, and carrier mobility, leading to a pronounced change in free carrier density [Citation13]. However, V O2 exhibits high power consumption due to the volatile nature of its switching behavior, requiring a constant stimulus to maintain the metallic state. While this characteristic can be advantageous for emulating biological neurons, it poses a notable limitation for memory and adaptive applications, where a constant bias is a notable drawback [Citation14].
Chalcogenides phase change alloys require energy stimulus for only the switching step, as the states are maintained without external stimuli (non-volatile), making chalcogenides an excellent choice for electronic data storage applications as potential alternates for conventional flash memory [Citation15]. The fundamental elements of chalcogenide semiconductors are group-16 ‘chalcogens (sulphur “S,” selenium “Se,” and tellurium “Te”) that are covalently bound to ‘network formers’ like arsenic “As,” germanium “Ge” and antimony “Sb.” They present a particularly adaptable platform offering a variety of beneficial properties, including infrared (IR) transparency, high optical nonlinearity, photo refractivity, and most predominantly readily-induced reversible structural phase transition [Citation16,Citation17]. By annealing the material above the glass transition temperature using optical or electrical pulses, it is possible to switch its phase from an amorphous phase with covalent bonds to a crystalline one with resonant bonding. The reverse transition is achieved by elevating the local temperature of the material above the melting point in a melt-quenching process triggered by relatively short pulses [Citation11]. The amorphous phase typically has higher electrical resistance and a lower optical absorption than the crystalline phase due to the difference in refractive index and extinction coefficients between the two phases [Citation18]. However, the melt/quench is a power-hungry process that can reduce the lifetime of a device due to the associated chemical and geometrical instabilities. Ongoing studies explore different device designs and reconfiguration techniques to improve devices’ long-term switching stability and endurance using these material platforms [Citation10,Citation19].
In pursuing alternative solutions, the ongoing research is directed toward nanoionics and photoionics [Citation6,Citation20–23]. These scientific disciplines unfold as promising fields of research, presenting promising avenues for innovative switching devices depending on the rearrangement of atoms or ions within a dielectric thin film triggered by external stimuli. It offers a solution for achieving non-volatile switching without relying on a melt-quench process for reversibility. The idea of ionic switching has widely matured in energy storage devices, as demonstrated by the global use of Li-ion batteries [Citation24].
Nanoionics is dedicated to studying the ion migration within solid electrolytes in nanoscale devices. Moving ions, such as oxygen or metals found in materials like transition metal oxides (TMOs) or amorphous chalcogenides, are responsible for modulating the valence change memory (VCM) and electrochemical metallization (ECM) in devices. The Metal-Insulator-Metal (MIM) architecture stands out as the optimal device structure, involving placing an insulating or dielectric layer between two metal electrodes. Nanoionics operates on electrical stimuli, prompting the moving of ions within solid electrolytes, leading to the formation and eliminating of filaments between electrodes or homogeneous ion redistribution near the electrode surface. This dynamic process results in resistive switching (RS) between low and high resistance states, showcasing the versatility of nanoionic devices. The device response can be either voltage-polarity-dependent in bipolar switching or polarity-independent in unipolar switching.
On the other hand, photoionics emerges as a compelling avenue, harnessing the mobilization of metal ions under the influence of optical signals with photon energy equal to or exceeding the solid electrolyte’s optical bandgap. Chalcogenides predominantly serve as the host medium in photoionics, where ionic migration induces optical modulation in reflection, transmission, and absorption. The three primary classifications within photoionics include optically-induced dissolution and diffusion (OIDD), photochemical modification (PCM), and photo-induced surface deposition (PSD). While photoionics experienced maturation in bulk glasses several decades ago [Citation23], the recent focus has shifted to thin-film metal-doped amorphous chalcogenides (MdACs) [Citation6]. MdACs, particularly those doped with silver and copper, have been used in batteries [Citation25] and electronic memristors [Citation26] due to their significant ionic conduction and non-volatile switching behaviour. This transition reflects the growing interest in leveraging photoionic phenomena as a promising mechanism for the evolution of all-optical switching devices with low power requirements [Citation6], poised to revolutionize future energy storage and telecommunication systems and pave the way for advancements in neuromorphic computing [Citation22,Citation27]. Consequently, this has fed a surge of research focused on ionic-based switches and modulators as scientists and engineers delve into novel material compositions, device architectures, and fabrication methods to improve the manipulation of ionic transport in reconfigurable optoelectronic platforms.
This comprehensive review presents an in-depth analysis of the current advancements in switches and modulators based on ionic movement. The scope of this study encompasses devices relying on metallic migration in MdACs as well as those dependent on the movement of oxygen ions in TMOs. A detailed analysis of the optoelectronic properties of the material constituents (both host and ion) employed in these devices is conducted. The review presents an extensive analysis of various device structures and switching mechanisms based on ionic migration. It also delves into their potential applications in optical and electronic data storage, signal modulation, and the domain of beyond-classical computing. Furthermore, it discusses the critical challenges that necessitate thorough consideration in future research.
2. Material platforms
Comprehending the differences in the behaviour of mobile particles within electronic or ionic devices is of utmost importance to discern the fundamental disparities between these two platforms. While ions possess a higher effective mass than electrons, which can limit the speed of charge transfer in larger-scale devices, this constraint is mitigated in nanoscale devices where the active layers are extremely small. At the nanoscale level, the increased mass of ions, relative to electrons, can promote greater device stability by effectively reducing leakage currents compared to electronic counterparts [Citation21,Citation28]. Like electrons, ions are charged particles that react to external electric fields, triggering oxidation and reduction and facilitating ion transport within solid electrolytes. Mass redistribution occurs due to the ion migration in the host materials, resulting in variations in their electrical, geometrical, chemical, and optical properties. A wide range of materials, such as perovskites [Citation29,Citation30], oxides [Citation28,Citation31,Citation32], and chalcogenides [Citation33–35], have shown successful demonstrations of ionic switching in various device architectures. This article focuses on ionic switching in oxides and chalcogenides and their related devices. Solid electrolytes of TMOs such as TiO2, Hf O2, and Ta2O5 [Citation31,Citation36–39] are commonly used to create valence change memories (VCMs). In comparison, electrochemical metallization (ECM) cells utilize binary electrolytes like Cu2S and Ag2S, as well as ternary electrolytes such as AgGeS or AgGeSe as switching layers [Citation6,Citation26,Citation40]. The process of electrically induced ion migration in the switching layer is strongly influenced by the characteristics of both the ions and host materials, as well as the specific materials utilized in the electrodes.
Furthermore, it is imperative to recognize the significance of defects within the solid electrolyte layer, particularly MdACs. These defects serve as pathways for the metal ions to travel through and can greatly impact the efficiency and functionality of ionic devices. Hence, materials in an amorphous phase are more advantageous than those in a crystalline phase because they can better accommodate defects and facilitate ion movement [Citation20,Citation21,Citation28]. VCMs and ECM cells’ functionality relies heavily on the material selection of hosts, ions, and electrodes. The ability of ion migration within the host materials is determined by two crucial factors: the mobility of ions within the hosts and the redox rate [Citation28]. More research is required to determine the precise values of the ionic mobility and redox rates of ions in different solid electrolytes. However, the diffusivity and oxidation potential can be useful aspects for identifying the optimal materials for ionic movement.
The ionic diffusivity (Di) exhibits a direct correlation with both ionic mobility (µi) and the temperature of the material (T). This relationship is mathematically expressed by the Nernst – Planck relationship, which incorporates the Boltzmann constant (KB) [Citation24,Citation41]:
And
Where A is the preexponential diffusivity factor, which varies according to the material system and depends on the frequency of collisions between molecules. Q, the Activation energy of diffusion, is the energy barrier ions must surpass to migrate through host materials. EquationEquation (2)(2)
(2) , the Arrhenius equation, is the fundamental connection between the diffusivity of ions across host materials and the temperature as well as activation energy [Citation24,Citation42]. It is clear from this relationship that diffusivity increases when the activation energy decreases.
illustrates a study on the relationship between self-diffusion’s activation energy and different metals’ melting temperature. The study focuses on well-known elements found in VCMs and ECMs, which are utilized as moving ions, including O, Cu, and Ag, as well as host materials like Hf and Nb, to name a few. Li has established itself as the standard for mature moving ions in batteries due to its impressive ionic mobility, proven over the years. The utilization of lithium in numerous commercial applications [Citation44] can be attributed to the significantly low self-diffusion activation energy of 53 kJ/mol that comes at the cost of its low melting point of 454 K. This substantiates the strong correlation between the activation energy of self-diffusion and the mobility of particles, providing further evidence for the practical implications of such properties. Metals like W, Ta, Mo, Nb, and Hf (indicated by the red ellipse in ) have a high melting point and require much energy for diffusion; so due to their low mobility, they are not commonly used as moving ions. Rather, they are typically used as inert electrodes or host materials by combining them with oxygen (oxides) [Citation45–48].
Figure 1. Factors influencing material utilization in ionic-based devices (a) the melting point (Tm) and self-diffusion activation energy (Q) of various elements commonly used in ionic devices are grouped into three categories denoted by green, blue, and red loops. Li is used as a reference element due to its high mobility ion and established presence in ionic batteries (Ref. [Citation42]). (b) Standard potential (determines the tendency of elements to oxidation “red” or reduction “blue”) of most common metals (W, Ta, Mo, Nb, Hf, Pt, Ni, Pd, Ti, Cu, Ag, Au, Al) utilized in ionic devices as well as Si as a well-known substrate material in intrinsic or nitride form and sometimes solid electrolyte in oxide form (SiO2) (Ref [Citation43]).
![Figure 1. Factors influencing material utilization in ionic-based devices (a) the melting point (Tm) and self-diffusion activation energy (Q) of various elements commonly used in ionic devices are grouped into three categories denoted by green, blue, and red loops. Li is used as a reference element due to its high mobility ion and established presence in ionic batteries (Ref. [Citation42]). (b) Standard potential (determines the tendency of elements to oxidation “red” or reduction “blue”) of most common metals (W, Ta, Mo, Nb, Hf, Pt, Ni, Pd, Ti, Cu, Ag, Au, Al) utilized in ionic devices as well as Si as a well-known substrate material in intrinsic or nitride form and sometimes solid electrolyte in oxide form (SiO2) (Ref [Citation43]).](/cms/asset/1c642427-7f06-4565-bf18-e2494a8ee834/tapx_a_2338285_f0001_oc.jpg)
On the contrary, the green circle in consists of metals with low self-diffusion activation energy, indicating better ionic mobility. However, gold and aluminum cannot be employed as cations in the switching layer of ECM cells because gold has a high oxidation potential, as seen in , making oxidation a complicated process [Citation28]. Although aluminum is easily oxidized, reducing it as filaments or metallic layers in ECM cells is challenging, so it is mainly used in batteries [Citation49,Citation50]. Therefore, copper and silver are the top choices for ionic movement in ECM devices due to their excellent mobility and adequate redox rate. It is worth noting that the standard potential in represents the potential difference between the metal electrode and the standard hydrogen electrode in the typical redox process. A more negative standard potential indicates a greater ease of oxidation and a more intricate reduction process and vice versa. The last group in (represented by a blue ellipse) comprises materials such as Ni, Pt, Pd, and Ti with moderate Q values (169–277 kJ/mole) and melting points (1728–2041 K). The primary purpose of these materials is to serve as inert electrodes in ECM cells, and their oxides act as switching layers for the movement of oxygen vacancies in VCMs. However, recent studies have reported that these elements and some elements with much higher Q in the red group, like Ta, can also be employed as moving cations in their oxides when subjected to specific conditions of higher potential and smaller switching layer thickness (< 20 nm) [Citation51].
2.1. Optical properties of typical ionic materials
The primary objective in developing ionic-based optical modulators/switches is to induce changes in their optical characteristics in response to the rearrangement of atoms within the active regions. This rearrangement manipulates plasmonic modes and perturbs wave propagation within the active region. The emergence of ionics as a paradigm for achieving reconfigurable optical switches has prompted extensive exploration of various material platforms. Ionic devices, such as VCM and ECM cells, utilize diverse materials to enhance their performance. These materials include oxides or chalcogenides, which serve as host electrolytes, as well as inclusions or ions that can either be a constituent of the host medium or form the electrode materials. These materials exhibit plasmonic or dielectric properties across the UV to IR spectral band, allowing for tailored electromagnetic responses based on their stoichiometry. The careful choice and use of these materials play a crucial role in advancing the science and optimizing the performance of these devices.
This analysis aims to study the optical properties of these materials and determine whether they can support plasmonic modes or propagating waves. The evaluation presents figures of merit (FOM) related to plasmonic and dielectric characteristics. The potential of materials to sustain the propagating surface plasmon-polariton (SPP) at the interface with the vacuum is described using SPP FOM in EquationEquation (4)(4)
(4) , which corresponds to the ratio between the distance dissipation (dSP P = 1/KSP P) and SPP wavelength (λSP P = 2π/KSP P) [Citation52,Citation53]; Where KSP P and KSP P are the real and imaginary components of SPP wavevector (KSP P).
The second plasmonic FOM (EquationEquation (5)(5)
(5) ) implies a material’s ability to support localized surface plasmon resonance (LSPR) in spherical nanoparticles. This FOM is determined by the ratio between the real and imaginary permittivity parts, representing the ratio between the resonant frequency and resonance line width [Citation54].
Finally, the dielectric figure of merit (DFOM) is important in assessing the support strength of waves propagating through dielectric materials. It determines the ratio between the attenuation length (inverse of the attenuation coefficient α = 4πk/λ) and the wavelength inside the dielectric (λ/n) (as described in Equationequation (6)(6)
(6) ). Where n is the refractive index and k is the extinction coefficient indicating losses [Citation53,Citation55].
2.1.1. Metals for ions (mobile inclusions) and electrodes
Metals are crucial in constructing ionic-based circuits because they can be employed as both moving ions and electrodes for addressing and connectivity. They are primarily characterized by their plasmonic (ϵ1 < 0) properties, which arise from the presence of free electrons that can collectively oscillate in response to incident electromagnetic fields. This, in turn, enhances the electromagnetic field and confines it to the surface. However, metals exhibit high optical loss (k) due to Ohmic or free electron absorption. illustrates a comparison between the optical constants as well as the plasmonic figures of merit of the most widely used metals in ionic-based devices. Pd (black) and Ni (red) have values that are quite similar. Their real permittivity (ϵ1) values are the closest to dielectric properties among these metals and can reach as low as −53 at a wavelength of λ = 1600 nm. Pd and Ni have the highest imaginary permittivity (ϵ2 range from 9.1 at λ = 400 nm to 50 at λ = 1600) values across most 400–1600 nm bands, except for λ = 660–890 nm and λ = 1400–1600 nm ranges. The range of the Pd refractive index is 1.33 ≤ n ≤ 3.14, while the Ni range is 1.7 ≤ n ≤ 3.14. In the NIR region, Pd and Ni are the least lossy metals. They have the lowest extinction coefficients among this group of metals (6 ≤ n ≤ 8). Regarding plasmonic FOMs, Pd and Ni have the lowest values over the spectrum except for the (λ < 600 nm). The SPP FOM range in Ni and Pd is 3 ≤ SPP FOM ≤ 34, while their LSPR FOM is close to unity [Citation56].
Figure 2. Optical constants of well-known metals (Au, Ag, Al, Cu, Pt, Pd, Ni) in ionic-based switching devices. (a) Refractive indices, (b) Extinction coefficients, (c), (d) Real and imaginary permittivity components (ϵ1, ϵ2). (e), (f) SPP and LSPR FOM of these metals (Ref. [Citation52,Citation56,Citation57]).
![Figure 2. Optical constants of well-known metals (Au, Ag, Al, Cu, Pt, Pd, Ni) in ionic-based switching devices. (a) Refractive indices, (b) Extinction coefficients, (c), (d) Real and imaginary permittivity components (ϵ1, ϵ2). (e), (f) SPP and LSPR FOM of these metals (Ref. [Citation52,Citation56,Citation57]).](/cms/asset/12f83c7c-def5-49d1-97a1-fee21e3c8a6a/tapx_a_2338285_f0002_oc.jpg)
Pt (green) exhibits the most negativity in ϵ1 (9.5 ≤ ϵ1 ≤ 294.7) at longer wavelengths after crossing with the values of Al at λ = 800 nm. The value of ϵ2 for Pt has the highest values only after λ = 1400 nm, hitting 60 at λ = 1550 nm. Its refractive index starts at 1.05 at λ = 400 nm and gradually decreases to 0.46 at λ = 620 nm before slowly rising to 1.85 at λ = 1600 nm and crossing unity at λ = 1150 nm. The extinction coefficient (k) rises from 3 to 17.4 over the spectrum and is highest in the IR range, making it a very lossy medium. Its plasmonic FOMs display good plasmonic behavior, with higher LSPR FOM values than Au and Cu in the lower and mid-visible spectrum, increasing from 1.5 at λ = 400 nm to 7 at λ = 620 nm. Then, it gradually decreases to 4 at λ = 1600 nm. The SPP FOM increases from 3 to 400 over the spectrum, with equal or slightly higher values than Au and Cu [Citation57].
At a wavelength of λ = 800 nm, Aluminum (Al) exhibits a peak inflection point, where the value of ϵ2 reaches 35, and the refractive index is 2.41. It is worth noting that both ϵ1 and k show a linear increase, in negative and positive, respectively, throughout the spectrum. However, this behavior does not apply to the range of 750 nm ≤ λ ≤ 850 nm. During this range, the value of k decreases from 7.6 to 7.2, while ϵ2 goes from −53.5 to −46.8. At λ = 830 nm, a significant tipping point is observed in the plasmonic FOMs, with values of 1.3 and 31 for LSPR FOM and SPP FOM, respectively [Citation52].
In ionic-cell structures, inert electrodes such as Pt, Pd, Ni, and Al are commonly employed. However, Ag and Cu are the most popular plasmonic materials for moving ions, with Au sometimes used too. These three noble metals have close optical constant values across the spectrum. From , it is clear that Ag has the highest plasmonic performance over the selected spectrum. Its LSPR FOM value reaches 100 at around λ = 800 nm, where the SPP FOM exceeds 1000. Ag also has a refractive index between 0.05 and 0.15 and an extinction coefficient range of 2 ≤ k ≤ 12. Au and Cu exhibit similar behavior, with n < 1 for the entire wavelength range except for wavelengths shorter than 500 nm for Au and 550 nm for Cu, respectively. At these wavelengths, the plasmonic LSPR FOM experiences a notable increase, reaching its peak at longer wavelengths within the visible spectrum (around 700 nm). Beyond this point, the FOM remains relatively constant. In contrast, the SPP FOM of these two metals rises to 400 at a wavelength of 1600 nm [Citation56].
2.1.2. Host electrolytes (Oxides and chalcogenides)
The host medium, the switching layer, is critical in constructing ionic-based devices. Its primary purpose is to facilitate the movement of ions throughout the system. The most often utilized oxides in ionic devices, including Ta2O5 [Citation39,Citation58–60], SiO2 [Citation61], WO3 [Citation47], Nb2O5 [Citation62], TiO2 [Citation38], and Hf O2 [Citation51]. Generally, such oxide extinction coefficients are very low over the Vis-NIR spectrum, presenting very low insertion losses when included in various optical components. Metal oxides are classified as dielectric materials based on their ϵ1 > 0, which remains relatively constant, along with their index of refraction throughout the visible to NIR, except for a slight increase near the low wavelengths of the visible spectrum (λ < 600 nm).
Nb2O5 has the highest refractive index and ϵ1 among these oxides, with values shown in falling from 2.5 and 6.5 at λ = 400 nm to nearly constant values in NIR around 2.2 and 5, respectively. Nb2O5 exhibits a very low extinction coefficient < 1 × 10⁻³ in the visible region and near zero for longer wavelengths of NIR (see inset in ), reflected in ultimately high dielectric FOM > 200 as shown in . The inset in reveals that TiO2 exhibits the lowest extinction coefficient among these oxides. Despite having a lower refractive index and real per-mittivity than Nb2O5, TiO2 shows a remarkably high dielectric FOM (DFOM). As a result, TiO2 stands out as an outstanding choice for efficiently guiding waves with minimal energy dissipation. TiO2, Ta2O5,Hf O2, and WO3 have mid and very close values of refractive index (2 ≤ n ≤ 2.3) and real permittivity (4 ≤ ϵ1 ≤ 5.5). These values are higher than those of matured SiO2, with a refractive index of less than 1.5. Ta2O5 has the highest optical losses compared to other oxides, especially in the visible regime where k is greater than 5 × 10⁻³, and the dielectric FOM is less than 100. Due to these limitations, it is not preferable as an optical-guided medium. WO3, However, displays a prominent inflection point at λ = 530 nm, where its imaginary permittivity (ϵ2) and extinction coefficient (k) reach their minimum values of 2x10⁻³ and 5x10⁻⁴, respectively. Consequently, WO3 demonstrates a higher dielectric figure of merit (DFOM = 60) at this specific wavelength, surpassing all the studied oxides except Nb2O5 ().
Figure 3. Oxide-based switching layers for ionic-based devices: A Group of promising oxides; Ta2O5, SiO2 (Ref. [Citation63]), Hf O2 (Ref. [Citation37]), TiO2 (Ref. [Citation64]), WO3 (Ref. [Citation65,Citation66]), and Nb2O5 (Ref. [Citation67]) (a) Refractive indices. (b) Extinction coefficients. (c), (d) Real and imaginary permittivity parts (ϵ1, ϵ2). The insets show close values for some of these oxides.
![Figure 3. Oxide-based switching layers for ionic-based devices: A Group of promising oxides; Ta2O5, SiO2 (Ref. [Citation63]), Hf O2 (Ref. [Citation37]), TiO2 (Ref. [Citation64]), WO3 (Ref. [Citation65,Citation66]), and Nb2O5 (Ref. [Citation67]) (a) Refractive indices. (b) Extinction coefficients. (c), (d) Real and imaginary permittivity parts (ϵ1, ϵ2). The insets show close values for some of these oxides.](/cms/asset/765e87d3-0ff8-4b3b-bce7-0349e415ea32/tapx_a_2338285_f0003_oc.jpg)
Figure 4. A set of chalcogenide semiconductors widely used as solid electrolytes in ionic-based devices; As2S3 (Ref. [Citation68]), GeSe (Ref. [Citation69]), GeTe (Ref. [Citation70]), and GST (Ref. [Citation17,Citation71]), (a) Refractive indices. (b) Extinction coefficients. (c), (d) Real and imaginary permittivity parts (ϵ1, ϵ2).
![Figure 4. A set of chalcogenide semiconductors widely used as solid electrolytes in ionic-based devices; As2S3 (Ref. [Citation68]), GeSe (Ref. [Citation69]), GeTe (Ref. [Citation70]), and GST (Ref. [Citation17,Citation71]), (a) Refractive indices. (b) Extinction coefficients. (c), (d) Real and imaginary permittivity parts (ϵ1, ϵ2).](/cms/asset/6c00be12-23db-4d16-917c-e071f959ea6f/tapx_a_2338285_f0004_oc.jpg)
The other branch of the host electrolytes in this study is the chalcogenide alloys such as GST [Citation72], As2S3 [Citation73], GeTe [Citation74], and GeSe [Citation75], which have been utilized in ECM cells over the last decade. The amorphous phase is the primary focus of this study as it allows for favored ionic migration processes to occur. This is due to the high level of material disorder, resulting in a large free volume that makes it easier to produce compositional and coordination defects [Citation76,Citation77]. depicts these alloys’ complex refractive index (n, k) and their real and imaginary permittivity (ϵ1, ϵ2).
GeSe, among the amorphous chalcogenide, has the highest n and ϵ1 values at λ = 660 nm with a peak of 4.8 and 22, as shown in . Beyond λ = 1030 nm, GeTe surpasses GeSe with maximum values of n = 4.25 and ϵ1 = 17.7 at λ = 1180 nm. GeSe and GeTe have similar n values in the NIR telecommunication band. However, GeTe experiences the highest losses (k) as illustrated in (), significantly reducing its DFOM values in comparison to other chalcogenides ().
Figure 5. Dielectric FOM of materials used as switching layers in ionic devices. (a) Oxides Ta2O5, SiO2 (Ref. [Citation63]), Hf O2 (Ref. [Citation37]), TiO2 (Ref. [Citation64]), WO3 (Ref. [Citation65,Citation66]), and Nb2O5 (Ref. [Citation67] (b) Chalcogenides As2S3 (Ref. [Citation68]), GeSe (Ref. [Citation69]), GeTe (Ref. [Citation70]), and GST (Ref. [Citation17,Citation71]). These values are calculated using Equationequation (6)(6)
(6) .
![Figure 5. Dielectric FOM of materials used as switching layers in ionic devices. (a) Oxides Ta2O5, SiO2 (Ref. [Citation63]), Hf O2 (Ref. [Citation37]), TiO2 (Ref. [Citation64]), WO3 (Ref. [Citation65,Citation66]), and Nb2O5 (Ref. [Citation67] (b) Chalcogenides As2S3 (Ref. [Citation68]), GeSe (Ref. [Citation69]), GeTe (Ref. [Citation70]), and GST (Ref. [Citation17,Citation71]). These values are calculated using Equationequation (6)(6) DFOM=n4πk(6) .](/cms/asset/b3c7abb2-7c55-4f37-a94e-e049a55207b1/tapx_a_2338285_f0005_oc.jpg)
In the NIR spectral regime, GeSe and As2S3 exhibit near-zero extinction coefficient values, which are even lower than those of the GST and GeTe alloys, resulting in higher DFOM. However, As2S3 has a lower refractive index value (the lowest amongst these chalcogenides) than GeSe by 1.5, which requires larger dimensions for effective light confinement. According to , the decline of k and ϵ1 is faster in GeSe than in GST and GeTe. This decline reaches nearly zero values for wavelengths exceeding λ = 1000 nm, making it a highly promising material for photonic applications requiring lower energy dissipation. GeSe also boasts a high refractive index (n ≈ 4), allowing light confinement in narrow dimensions.
Table 1. Summary of the optoelectronic switching devices based on ionic migration, geometry, stimuli, operating conditions, responses, and applications.
3. Device architectures
The emergence of ionic-based devices has led to the development of diverse structures, which can be categorized based on the stacking orientation of the electrodes/switching layer into vertical and horizontal stacking configurations. In the vertical stacking configuration, the electrodes and switching layers are arranged in a layered structure perpendicular to the substrate. On the other hand, in the horizontal stacking configuration, the electrodes and switching layers are arranged in a planar manner parallel to the substrate. Another classification scheme considers the number of switching layers and the materials employed in the active region. Single or multiple dielectric layer architectures are commonly utilized. These dielectric layers exhibit different electrical and optical properties, enabling tailored device performance. Moreover, electrodes can function as a supplementary source of ions for the switching layer within metal-dielectric hybridized platforms, contributing to the improved switching performance of the device. Optimizing the materials used for the switching layer and the electrodes is imperative to attain optimal performance in such devices. concisely summarizes different ionic-based switching devices with different configurations and mechanisms.
3.1. VCM-based resistive switching
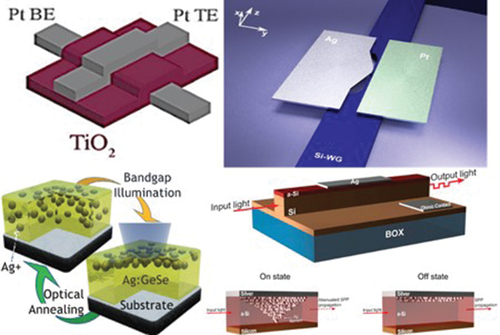
The formation of conductive pathways and filaments through the movement of oxygen vacancies, which aggregate between the electrodes, is considered to be the primary mechanism underlying the reconfiguration capabilities in VCM platforms such as TiO2, Hf O2, Ta2O5, to name a few [Citation38,Citation86–90]. They have the advantages of excellent temperature stability, simplicity in film deposition, and compatibility with traditional semiconductor production procedures with smaller features. TiO2 is the oxide used most frequently in resistive switching devices such as resistive random-access memories (RRAMs) because it has a substantial resistance differential between its high resistance state (HRS) and low resistance state (LRS).
The performance of VCM devices depends not only on their dimensions and constituent materials but also on the stoichiometry of the switching layer. In a study by Sassine et al., they compared the response of a device with an active region of a double layer of titanium dioxide (12 nm) with different oxygen vacancy concentrations and another with a single Hf O2 (4 nm) switching layer (see ) [Citation38]. The authors emphasize the role of oxygen vacancy organization in determining the device response that delineates the potential applications of each material/device technology. The Crosspoint arrangement was used to construct both VCM devices. The bottom and top electrodes were patterned employing EBL, and all metals were deposited using the e-beam evaporation process. ALD was used to deposit the oxide layers as a better choice than alternative deposition methodologies. ALD provides the benefits of film conformality, stoichiometric control, and intrinsic film quality. The variation in stoichiometry among different layers of titanium dioxide can be confirmed by measuring the resistance or conductivity of each layer. A lower resistance indicates a higher concentration of oxygen vacancies within the layer.
Figure 6. Resistive switching devices utilizing VCM. Architecture representation of a vertical Crosspoint design with an area of 200 x 200 nm and the I-V characteristics of (a),(b) interfacial (homogeneous) TiO2−x/TiO2 based-device and (c),(d) filamentary Hf O2-base device, respectively (Ref. [Citation38]). I-V characteristics of Pt/ZnO thin film/Pt device in (e) filamentary and (f) homogeneous resistive switching mechanisms. The insets portray the TEM images of the device before and after the Filamentary interfacial mechanism transition (Ref. [Citation91]). (g) a single-layer TiO2-based device and (i) an Al2O3/TiO2-based device with Pt electrodes. Popular bipolar switching behavior of a device based on the stack (h) Pt/TiO2/Pt and (j) Pt/Al2O3/TiO2/Pt, operating at 0.1 µs pulses of changing polarity voltage ramps varying from 1 to 2 V, with voltage steps of 0.2 V. The red and green horizontal lines in ) represent the HRS and LRS, respectively (Ref. [Citation92]). (k) Resistance switching characteristics over 100 ITO/TiO2/Pt VCM device cycles. A compliance current of 10 mA was applied to protect the device. The inset represents the schematic representation of the device (Ref. [Citation86]).
![Figure 6. Resistive switching devices utilizing VCM. Architecture representation of a vertical Crosspoint design with an area of 200 x 200 nm and the I-V characteristics of (a),(b) interfacial (homogeneous) TiO2−x/TiO2 based-device and (c),(d) filamentary Hf O2-base device, respectively (Ref. [Citation38]). I-V characteristics of Pt/ZnO thin film/Pt device in (e) filamentary and (f) homogeneous resistive switching mechanisms. The insets portray the TEM images of the device before and after the Filamentary interfacial mechanism transition (Ref. [Citation91]). (g) a single-layer TiO2-based device and (i) an Al2O3/TiO2-based device with Pt electrodes. Popular bipolar switching behavior of a device based on the stack (h) Pt/TiO2/Pt and (j) Pt/Al2O3/TiO2/Pt, operating at 0.1 µs pulses of changing polarity voltage ramps varying from 1 to 2 V, with voltage steps of 0.2 V. The red and green horizontal lines in Figure 6(h,j) represent the HRS and LRS, respectively (Ref. [Citation92]). (k) Resistance switching characteristics over 100 ITO/TiO2/Pt VCM device cycles. A compliance current of 10 mA was applied to protect the device. The inset represents the schematic representation of the device (Ref. [Citation86]).](/cms/asset/76e71858-a7d1-4a2e-88c3-880f06120034/tapx_a_2338285_f0006_oc.jpg)
The distribution of oxygen vacancies within the active region between the electrodes is a distinguishing factor among various VCMs [Citation28]. As an illustrative example, one viable approach is the interfacial (homogeneous) method of organizing oxygen vacancies within a TiO2−x/TiO2 device. This method redistributes oxygen vacancies along the metal/dielectric interface, unlike the single layer (Hf O2) device, where oxygen vacancies are ordered into a filament form between the two metallic electrodes. The typical current-voltage (I-V) hysteresis loops are shown in . For TiO2−x/TiO2 devices, a smooth, completely voltage-controlled loop depicting bipolar switching was established, whereas bipolar switching with distinct SET (current control) and RESET transitions was demonstrated for Hf O2 devices. Interfacial TiO2−x/TiO2 devices may be versatile for analog/neuromorphic computing. However, they suffer from low retention (The resistance states maintain their values for a short time ≈ 1s) in data storage applications [Citation38,Citation93]. On the other hand, Hf O2 devices exhibit good retention (Time ≈ 4000 s), making them an excellent choice for memory applications.
Various studies have been carried out to determine the effects on the VCM switching performance of adding a thin interfacial layer with different stoichiometries between the switching layer and an electrode [Citation38,Citation94–96]. One observed effect involves switching device operation from unipolar to bipolar polarities. A Pt/ZnO 100 nm thin film/Pt device, illustrated in the inset of , displayed a bias conversion transition from filamentary to homogenous resistive switching [Citation91]. An abrupt increase in current, or the “forming process,” was observed by applying a positive bias from 0 V to 2.8 V (forming voltage) with a compliance current of 10 mA. During this process, the device’s resistance changes from the initial resistance state to LRS (R ≈ 50 Ω) due to the formation of conducting filaments in the ZnO thin film, as shown in . The resistance of the device switching to HRS (R ≈ 2000 Ω) was observed by varying the biases from 0 V to 0.7 V (RESET) ().
A reverse sweep bias of −1.75 V was used with a higher strong IC (≈ 100 mA) to start the transition from filamentary to homogeneous resistive switching. Consequently, SET (RLRS ≈ 40 Ω) and RESET (RHRS ≈ 400 Ω) states were obtained at −2 V and +2 V, respectively, while maintaining constant current compliance (ICC) of 100 mA (See 6- 6 6(f)). Notably, the resistances were quantified through the application of a reading voltage set at 0.1 V. Energy dispersive spectroscopy (EDS) was used to determine the compositional difference in two different types of samples, namely a pristine sample without any operations and a sample after the transition of filamentary to homogeneous resistive switching, as shown in the insets of , respectively. Near the bottom electrode, the uniform ZnO region’s atomic concentration of Zn drops to 40% from its previous 50% value, confirming the existence of the oxygen-defective region close to the bottom Pt electrode. Furthermore, comparison studies were also carried out to determine the impact of the bottom electrode on switching between filamentary and interfacial resistive mechanisms in Ref [Citation97]. Conforming to the previous interpretations, the filament production and rupture theory was used to explain the unipolar resistive switching in the Pt/Mn:ZnO/Pt device and the interfacial conduction theory was used to explain the bipolar resistive switching in the Pt/Mn: ZnO/Si device.
Reducing resistance fluctuation from cycle to cycle is a major challenge faced by filamentary platforms that can significantly degrade device performance in various applications. Homogeneous distribution has been proven advantageous over filamentary distribution in tackling this issue by Stathopoulos et al. [Citation92]. Several vertical prototype metal-insulator-metal (MIM) cells with a Crosspoint configuration were developed with a single TiO2 layer and Al2O3/TiO2 bilayer, as illustrated in . A solid electrolyte of amorphous TiO2 and an interface barrier layer of Al2O3 were utilized for the bilayer structure with Pt top and bottom electrodes. A 100 ns signal pulse with changing polarity and values from 1–2 V for more than 20 cycles was applied to single and bilayer architecture. Here, the stability of the measured resistance was enhanced significantly by adding an Al2O3 layer () rather than a single (TiO2) layer (), which led to significant programming drift. Even after 20 × 103 switching cycles, adding the TiO2 leads to non-discernible memory states [Citation92]. Another advantage obtained by adding this layer was obtaining multi-bit memory. The same paper confirms that concept for different interfacial oxide layers Ta2O5, WO3, Hf O2, ZnO, and SiO2 with 4 nm thickness added to the 40 nm TiO2 layer, like Al2O3. The Pt electrodes were fabricated using EBL, followed by a lift-off procedure. Magnetron sputtering was also used to deposit TiO2, TiO2, Ta2O5, and SiO2 layers, while ALD was utilized to synthesize ZnO, Hf O2, and WO3.
It was reported that the resistance window could be enhanced by increasing the oxygen concentration of the oxide electrode [Citation96]. An effective method is utilizing transparent conductive oxides like ITO and ZnO as an electrode, as they can offer a constant oxygen supply to the TMO switching layer [Citation98]. The inset in depicts a vertically stacked VCM device deposited by magnetron sputtering with a single-layer TiO2 switching region with a thickness of 7.5 nm and a device area of 500 µm × 500 µm. An E-beam was used to evaporate a 50 nm thick Pt bottom electrode (BE) layer onto a 10 nm Ti metal (adhesion) layer. The top electrode is constructed of 50-nm ITO deposited by an RF magnetron sputter [Citation86].
The constructed TiO2 RRAM’s bipolar resistance switching properties for DC voltage sweeping operations are shown in . Current compliance of 10 mA was established during the SET operation to prevent severe breakdown. The device transi-tioned to LRS (R ≈ 6 Ω) after a strong enough positive sweeping voltage was supplied, owing to the motion of the oxygen vacancies from BE to TE, forming conductive filaments. The device switched back to the HRS (R ≈ 500 Ω) at a reset voltage of around −0.5 V with a current compliance of 20 mA. However, by employing positive DC sweeps after that, the device would switch back to the LRS at a predetermined value of about 0.6 V. The retention and resistance properties of HRS and LRS were tested under a 100-mV working voltage and IC = 10 mA. After 104 seconds, no significant changes were observed.
3.2. ECM-based resistive switching
In contrast to VCMs, ECM cells strongly depend on the electrode metal-ions incorporation in switching criteria. Notably, programmable metallization cells (PMC), ECM, and conductive bridge RAM (CBRAM) are different names for the same device principle of operation. Generally, a solid electrolyte, which may be doped with noble metal or remain undoped, is positioned between two electrodes. These electrodes can be either active or inert. Although chalcogenide glasses are the most commonly used materials for switching layers in this category of devices [Citation79,Citation81,Citation99], oxides were utilized sometimes as switching layers for metals [Citation35,Citation82].
Chen et al. studied the effect of doping the SiO2 switching layer with the material of the top electrode (Cu) [Citation100]. The active layer in the Cu/SiO2/Pt stack was deposited using an e-beam evaporator, as shown in . First, as illustrated in , the cu electrode voltage was swept from −0.8 V to 1 V at a wide range of compliance current (from 10 nA to 500 µA). Then, the device switches from HRS to LRS at different threshold potentials from 0.5 to 0.8. At this voltage, the current climbs quickly to the compliance limit. When the positive voltage is suitably high, the device maintains its LRS value; however, when it decreases to near zero, the filament spontaneously ruptures, returning the device to its HRS state. A remarkable contrast ratio between resistance states (RHRS/RLRS) reaching approximately 5 × 10⁷ can be achieved when the current is measured at ± 0.8 V, employing a programming/compliance current of 500 µA. This substantial contrast ratio underscores the potential utility of this device as an effective sneak path-blocking selector [Citation103].
Figure 7. Resistive switching devices utilizing ECM. Schematic representation of ECM device with (a) Cu/SiO2/Pt stack. (b) after Cu doping to the switching layer before annealing and (c) after thermal annealing at 550°C for 10 minutes. (d) Volatile response at different compliance currents and (e) non-volatile resistive switching performance for 50 cycles (Ref. [Citation101]) (f) Cross-section of a PMC device with an Ag anode, a Ni cathode, and a chalcogenide via layer fabricated on SOI substrate. (g) The I-V characteristics of a 5 µm diameter size of the same device with a compliance current of 10 µA demonstrate the switching between HRS and LRS. (h) TEM micrograph of a PMC device cross-section (HRS state). (i) Magnified perspective of the same cross-section near the chalcogenide via-Ni cathode interface, revealing the existence of two layers (lighter and darker) within the chalcogenide (Ref. [Citation102]) (j) I-V characteristics and (k) Pt/GeSe/TiN device TEM image. (l) I-V characteristics and (m) TEM image of Pt/Ti/GeSe/TiN device. The red lines represent the initial voltage sweep cycle, while the grey lines represent the next ten cycles. The insets depict the structures (Ref. [Citation75]) (n) Schematic representation of Lateral memristive device with Ag-Ag electrode pair on a GeTe switching layer. The same device after (o) replacing one Ag electrode with Pt one, (p),(q) the I-V characteristics observed during the filament growth of the electrode pair depicted in (n) and (p) using compliance currents of 10 µA and 1 µA, respectively (Ref. [Citation74]).
![Figure 7. Resistive switching devices utilizing ECM. Schematic representation of ECM device with (a) Cu/SiO2/Pt stack. (b) after Cu doping to the switching layer before annealing and (c) after thermal annealing at 550°C for 10 minutes. (d) Volatile response at different compliance currents and (e) non-volatile resistive switching performance for 50 cycles (Ref. [Citation101]) (f) Cross-section of a PMC device with an Ag anode, a Ni cathode, and a chalcogenide via layer fabricated on SOI substrate. (g) The I-V characteristics of a 5 µm diameter size of the same device with a compliance current of 10 µA demonstrate the switching between HRS and LRS. (h) TEM micrograph of a PMC device cross-section (HRS state). (i) Magnified perspective of the same cross-section near the chalcogenide via-Ni cathode interface, revealing the existence of two layers (lighter and darker) within the chalcogenide (Ref. [Citation102]) (j) I-V characteristics and (k) Pt/GeSe/TiN device TEM image. (l) I-V characteristics and (m) TEM image of Pt/Ti/GeSe/TiN device. The red lines represent the initial voltage sweep cycle, while the grey lines represent the next ten cycles. The insets depict the structures (Ref. [Citation75]) (n) Schematic representation of Lateral memristive device with Ag-Ag electrode pair on a GeTe switching layer. The same device after (o) replacing one Ag electrode with Pt one, (p),(q) the I-V characteristics observed during the filament growth of the electrode pair depicted in (n) and (p) using compliance currents of 10 µA and 1 µA, respectively (Ref. [Citation74]).](/cms/asset/6a6a0b37-66fa-485a-bc89-c8f23b5b80ad/tapx_a_2338285_f0007_oc.jpg)
The porous nature of the evaporated SiO2 and the significant concentration differential between the Cu-rich conducting area and the surrounding oxide are the reasons for the quick dissolution of the Cu filament (volatility). Doping the SiO2 layer was accomplished by depositing a 3 nm intermediate layer of Cu, followed by annealing, as illustrated in . In addition to lowering the concentration gradient, thermal doping also lowers the diffusion coefficient by reducing the likelihood of unoccupied sites in the porous oxide matrix, leading to the non-volatile bipolar switching seen in . With voltage sweeps and a 100 µA compliance current, the Cu-doped device was cycled 50 times. While the non-volatile device is appropriate for storage devices, the volatile functionality is crucial for reducing sneak path currents in crossbar schemes.
The Kozicki group has made significant steps in electronic PMC devices with metal-doped amorphous chalcogenides (MdAC) starting in 1999 [Citation103]. A PMC device with a layer of AgGe30Se70 sandwiched between an anode made of an active metal (Ag) and a cathode made of an inert metal (Ni) was developed in 2014 by Mahalanabis et al. [Citation102]. A cross-section of the PMC device is shown in , in which 100 nm of SiO2 was first deposited using electron beam evaporation on a p-doped Si wafer. Then, 100 nm of Ni (the device cathode) and 100 nm of SiO2 (for isolation) were progressively deposited. Next, device vias were wet etched in the isolation layer to expose the Ni layer. After etching, 30 nm Ag and 80 nm AgGe30Se70 films are deposited to the vias using a thermal evaporator. The wafer is then subjected to UV radiation at a power density of 10 mW/cm2 for one hour to facilitate Ag photodoping of the Chalcogenide layer (wavelength: 324 nm, energy: 3.82 eV). This photo-induced doping is a critical stage in the PMC manufacturing process that transforms the glass’s electronic characteristics from dielectric to electrolytic, resulting in the development of a solid-state electrolyte that enables PMC stability, uniformity, and reliable switching. Then, a further layer of 35 nm of Ag was placed to form the anode of the device. Finally, Al (800 nm) was deposited and etched to create connections for both device electrodes.
Ag atoms are oxidized and migrate as cations toward the cathode under the influence of the electric field when a positive bias is applied at the anode. The cations are electrodeposited and reduced at the cathode, creating a conducting filament that moves in the anode direction. Once the filament reaches the anode, it creates a low-resistance pathway through the film. This transition causes a shift from HRS to LRS (RHRS/RLRS = 2.5). When the electrical bias is reversed, the filament dissolves, and the device returns to its HRS state. The typical resistance-switching behavior of PMC devices is illustrated in . A write voltage threshold between 200 and 300 mV is shown in the figure (HRS to LRS switching). However, the erase voltage threshold for transitioning from LRS to HRS was below 100 mV. Therefore, it was decided to use 10 µA as the compliance or programming current. To examine the device cross-section, a PMC was subjected to TEM, as shown in . Ag and Ni layers exhibit crystalline granularity; however, the photo-doped Chalcogenide layer was amorphous and composed of two distinct (undoped, Ag-doped) layers inside a via, as illustrated in the enlarged image of the Chalcogenide-Ni interface ().
In 2019, W. Kim et al. reported on the bipolar resistive switching of amorphous GeSe thin films with 10 nm thickness deposited through ALD [Citation75]. They demonstrated improved cycle endurance and consistent retention by sandwiching a 30 nm Ti layer between the GeSe switching layer and the top Pt electrode. A Se-deficient GexSe1−x matrix and the interfacial TiSe layer are produced because Ti has a strong chemical affinity for Se. The thorough investigation showed that the Ti layer initially functions as a Se sink by creating the Ti-Se bond, leaving a Se-deficient layer beneath the interfacial Ti-Se.
Two device configurations, Pt/GeSe/Pt and Pt/Ti/GeSe/TiN, were prepared and characterized as shown in . The first one required the electroforming process with an initial SET voltage of ≈1.14 V (red line in ). The SET voltage for the following cycles was ≈0.65 V. (gray lines in ). On the other hand, the second device had a Ti interfacial layer. It demonstrated electroforming-free performance with a constant SET voltage of ≈0.75 V, greater switching uniformity, and a lower threshold voltage (< 1 V) (see ). shows a TEM-EDS image of the Pt/GeSe/Pt device after around 50 cycles of electrical operation. The GeSe layer displays a considerably more irregular contrast than the Ti-layer device (). These places were primarily referred to as Ge nanoclusters, indicating that the GeSe layer lost a large amount of Se during the electrical operation, most likely due to Se migrating toward Pt. The findings of the local composition analysis of the contacting Pt layer (40% of the Se at the interface) supported this conclusion. Residual Ge has the potential to aggregate into clusters, leading to a transition of the devices from HRS (R ≈ 50kΩ) into LRS (R ≈ 8kΩ). In scenarios where an excessive formation of Ge clusters occurs, it can lead to device failure, where they become permanently trapped in the LRS (Low repeatability < 100 cycles). The Second device’s TEM-EDS picture in shows a thin layer (≈5 nm thick), believed to be the TixSey layer, separating the bulk Ti layer (which had a lattice fringe) from the amorphous GeSe layer. This layer prevented additional Se from diffusing toward the top electrode, preventing Ge from having more extensive concentrations.
While the layers in the previous ECM devices were stacked vertically, lateral ECM cells were created with Ag/GeTe/Ag and Ag/GeTe/Pt configurations. The GeTe (50/50) layer with 50 nm thickness was sputtered by an RF magnetron over the SiO2/Si layer; both the Ag and Pt electrodes have a thickness of 50 nm [Citation74]. In the case of the Ag-Pt electrodes (), Silver showed high diffusion inside the GeTe layer to the extent that the silver electrode was barely observed by TEM-EDX spectroscopy and an unusual ECM switching polarity was observed (). Contrary to fundamental ECM theory, a negative bias to the active electrode created the filament. The basic ECM theory predicts that Ag filament growth in chalcogenide systems occurs when a positive bias is applied to an active electrode at which the Ag+ ions are oxidized and are the source of filament formation starting from the inert electrode. This peculiar behavior can be attributed to the near-complete dissolution of the silver electrode in GeTe. This converts the silver electrode’s shape from a pentagon to just the contact side, leading to repulsion with neighboring silver ions when the electrode has a positive polarity. This repulsion prevents the completion of the silver filament between the two electrodes. When utilizing a platinum (Pt) electrode instead of a silver (Ag) electrode with identical shape and dimensions (as depicted in ), a distinct dendritic filament was observed to form, extending from the negatively biased electrode towards the positively biased electrode. Upon adjusting the bias voltage back to approximately 0 V, the filaments initiated a fading process, suggesting the occurrence of dissolution. This behavior signifies a unipolar switching response, as shown in (). Depositing a Pt over the Ag electrode with the same geometry in was suggested to retain the expected behavior of ECM by conserving the geometry of the active electrode even after high silver diffusion in GeTe.
4. Optical modulation
Optical modulators are devices utilized to dynamically manipulate an incoming light signal through an optical waveguide or in free space through amplitude, phase, and polarization control. Current research endeavors to incorporate ionic switching principles into nanoscale device configurations like plasmonic nanogaps, silicon photonics waveguide architectures or metamaterials and metasurfaces, enabling significant non-volatile signal modulation within subwavelength nanoscale architectures based on manipulation of ultrathin ionic layers.
4.1. Waveguide-integrated optical modulators
The electrical formation of conductive paths of metal ions in dielectric layers rather than changing their lattice phase has shown substantial promise in optical modulation as it alleviates the power-hungry melt-quenching process associated with phase change-based devices or drift associated with electro-opto-mechanically driven architectures. A 30 nm silicon dioxide (SiO2) layer was employed as an active layer in a plasmonic MIM waveguide illustrated in ; Au and ITO represent the cell electrodes [Citation104]. The MIM stack was structured on top of a photonic Si-WG with a very thin ITO layer (10 nm) to allow coupling between photonic and plasmonic modes. The normalized optical transmission as a function of an external voltage between −2 V and 2 V is illustrated in . When the gold (Au) electrode reached the maximum allowable negative potential, the transmission of electrical current through the electrode was observed to be at its peak, indicating “on-state” behavior. The transmitted optical signal diminished to 6.3% and 25% of its peak value for device lengths of 10 µm and 5 µm, respectively, as the voltage was progressively increased to +2 V. By inverting the polarity of the applied voltage, the optical transmission resumes an ascent, eventually reaching its peak value again at −2 V. In addition, this hysteresis behavior illustrates the switch’s memory effect.
Figure 8. Modulation of an optical signal propagating in a waveguide (a), (b) Structure and optical transmission response of a photonic Si-WG integrated with a plasmonic waveguide consisting of Au (300 nm)/SiO2 (30 nm)/ITO (10 nm) vertical stack on top. Higher modulation contrast was obtained for the longer device when two alternative lengths (5 µm and 10 µm) were investigated (Ref. [Citation104]) (c) Schematic representation of the hybrid plasmonic switch illustrates (d) metallic filament formation (electrically on/optically off) and (e)filament removal (electrically off, optically on). (f) Electrical (black) and optical (green) responses of the hybrid plasmonic waveguide (Ag/a-Si/Si-WG structure) over the applied voltage from −3 V to 9 V (Ref. [Citation105]). (g)3D schematic representation of a lateral plasmonic switch with an active area of a-Si between two metallic “Ag(active) and Pt(inert)” electrodes coupled with Si-WG through Ag-tapering architecture. The switching mechanism depends on the formation and departure of an atomic scale Ag filament in the active volume. (h) Optical response of the switch in NIR by FDTD simulation in both on-state (filament formation) and off-state (filament removal) (Ref. [Citation106]).
![Figure 8. Modulation of an optical signal propagating in a waveguide (a), (b) Structure and optical transmission response of a photonic Si-WG integrated with a plasmonic waveguide consisting of Au (300 nm)/SiO2 (30 nm)/ITO (10 nm) vertical stack on top. Higher modulation contrast was obtained for the longer device when two alternative lengths (5 µm and 10 µm) were investigated (Ref. [Citation104]) (c) Schematic representation of the hybrid plasmonic switch illustrates (d) metallic filament formation (electrically on/optically off) and (e)filament removal (electrically off, optically on). (f) Electrical (black) and optical (green) responses of the hybrid plasmonic waveguide (Ag/a-Si/Si-WG structure) over the applied voltage from −3 V to 9 V (Ref. [Citation105]). (g)3D schematic representation of a lateral plasmonic switch with an active area of a-Si between two metallic “Ag(active) and Pt(inert)” electrodes coupled with Si-WG through Ag-tapering architecture. The switching mechanism depends on the formation and departure of an atomic scale Ag filament in the active volume. (h) Optical response of the switch in NIR by FDTD simulation in both on-state (filament formation) and off-state (filament removal) (Ref. [Citation106]).](/cms/asset/2677a501-53bb-427f-bc54-de44c827fce1/tapx_a_2338285_f0008_oc.jpg)
The device demonstrated outstanding repeatability for more than 50 switching cycles. Studies were also done into how much the extinction ratio varied with device length. The extinction ratio rises from 6 dB to 12 dB as one extends the length from 5 µm to 10 µm. Consequently, when device length rises, the extinction ratio grows as well. A positive voltage applied to the gold electrode creates a conductive route in the plasmonic active layer (SiO2), which is the basis for the switching mechanism. This conductive channel greatly disrupts the plasmonic mode, leading to higher absorption. No details are provided about the nature of the conductive path. However, it can still be formed typically via oxygen vacancies. Although Au is often not employed in ionic motion devices due to its challenges with oxidation (as illustrated in ), it can share oxygen vacancies in the switching layer because of the infinitesimally small spacing between electrodes (30 nm) relative to the applied voltage.
A metal filament’s obvious growth and impact as the basis for optical switching were first reported in the Ag/a-Si/Si stack [Citation105]. The structure of the device shown in is based on integrating an SOI waveguide (280 nm × 350 nm) and a plasmonic waveguide (Ag/a-Si). The device is designed to operate at the telecommunication band (λ ≈ 1550 nm). The fundamental operational principle of this device involves the manipulation of the optical signal within the photonic waveguide by applying an electrical signal across the plasmonic waveguide. This functionality holds the potential for optically reading the logic state of a memory device by monitoring two distinct optical transmission states. The modulation in the optical transmission is attributed to the emergence of a nanoscale metallic filament within the a-Si layer, where the plasmonic mode is supported, causing absorption and scattering. Silver ions are diffused into the a-Si and trapped at defect sites under positive voltage at the silver electrode. The formation of a nanoscale chain of silver nanoparticles results from the recombination of silver ions with electrons from the substrate (). An enhanced electron tunnelling dominates the conduction mechanism through this metal filament (LRS), and the measured optical transmission is low. Conversely, when a negative voltage is applied, the metal filament dissociates (), resulting in an HRS and causing a high optical transmission. The detected modulation depth of the optical signal is ≈1%.
By measuring the I-V characteristics of the device, the electrical resistance switching behavior of the fabricated memristor device was explored (black line of ). Nevertheless, the device’s optical response exhibits a hysteresis characteristic that is both apparent and distinct. As seen in (green line), By using an erase pulse of −3 V, the device’s default state was changed to “off.” Up to the threshold voltage of 5 V, the optical signal is somewhat reduced as the voltage rises, with a more abrupt transition occurring at higher potentials. As a result, the measured optical signal gradually increases by reducing the applied voltage from its maximum value of 9 V until it reaches the off state (V = −3 V). As a result, a memory device with electrical write and optical read capabilities is created.
Scaling down Modulators (electrical/optical) has significant advantages such as higher speed, reduced power consumption; nonetheless, it still encountered technical difficulties in manufacturing. In this pursuit, the Leuthold group has developed systems that rely on nonvolatile filament formation [Citation34,Citation107]. An example of their advancements in on-chip electro-optic switches is demonstrated through the architectural design depicted in [Citation106]. A reconfigurable optical switch with a 9.2 dB extinction ratio, functioning up to MHz switching speeds with femtojoule (fJ) power requirements. The switch comprises a plasmonic MIM slot waveguide on top of a planar Si photonic waveguide (220 nm × 500 nm). The optical signal is launched into the MIM slot waveguide using the Si-WG. The MIM slot waveguide is adiabatically tapered down until it finally directs the plasmon into a metallic tip with a separation distance as small as 20 nm, where the plasmonic nanogap-based optical switching occurs in the region between the left (Ag) and right (Pt) electrodes. The active region is filled with amorphous Si, which functions as a host matrix for the silver ions. The optical modulation is handled by supplying a voltage between the two metals. When a positive voltage is applied to the Ag electrode, silver ions become mobile and travel into the a-Si, where they capture free electrons from the Pt to form an atomic-scale conductive filament (channel) between the electrodes. Two different plasmonic resonances are supported by the formation and removal of this filament, which changes the plasmonic cavity’s physical characteristics (conductance ratio ‘Gon/Goff ’ = 13 × 103). The optical switching function between the on (black curve) and off (red curve) states is calculated using finite difference time domain (FDTD) simulations (). When in the off state, the transmission of the system demonstrates a broadband response, but with a notable and pronounced dip at a specific wavelength of λ = 1450 nm. This phenomenon primarily arises from stimulating the plasmonic resonance localized between the Ag nanoscale filament and the Pt electrode. When the device is switched from the off to on state, the conductance changes due to the relocation of one or a few atoms, causing short circuits and promoting greater tunnelling between the electrodes. The switching causes a blue shift in transmission and a widening resonance in the on-state. The qualitative agreement between the simulations and the experimental data is good. However, the shapes and locations of the experiment’s resonances do not exactly match those predicted by the simulations. This discrepancy can be attributed to the challenges of creating such tiny gaps (≈ 20 nm), which result in significant fabrication imperfections. A trade-off has emerged between the use of non-resonating wider gaps (h > 20 nm), which can be easily fabricated (see Ref. [Citation108]), and the utilization of extremely small resonating gaps, which pose challenges in terms of fabrication in these particular devices.
4.2. Free-space metasurface and metamaterial-based modulators
In past decades, optical components like lenses and mirrors were used to manipulate light over large distances. However, the emergence of ultra-thin subwavelength nanostructured optical metasurfaces has allowed for similar light control on a much smaller scale. These metasurfaces can manipulate the phase and amplitude of light and have been utilized for various applications. While most metasurfaces were traditionally passive and fixed in their response, there has been growing interest in developing dynamically tunable metasurfaces in the last decade. Ionic-based devices have emerged as a promising approach for achieving post-fabrication non-volatile reconfigurability in optical systems.
In 2017, Thyagarajan et al. proposed an innovative method for the dynamic control of the optical characteristics (Reflectance, absorptance and transmittance) using ionic inclusions in a plasmonic metasurface through the application of electrical signals on the order of a few millivolts [Citation109]. Plasmonic metasurfaces, composed of subwavelength nanostructures designed to manipulate light at the nanoscale, have garnered significant attention in recent years due to their potential to realize high-scaled photonic components [Citation110,Citation111]. This approach is based on the nucleation and growth of silver (Ag) nanoparticles “filamentation,” leading to modulation of the ionic conductance. The device is configured in a vertical arrangement by depositing a 5 nm layer of solidstate electrolyte (Al2O3) between an 80 nm layer of plasmonic material (Ag) and a 110 nm layer of a transparent electrode (ITO). The metasurfaces were patterned using FIB to create inverse Dolmen structures, as illustrated in .
Figure 9. Tunable metasurfaces based on ionic migration (a) Schematic illustrating the anticipated interaction between light and matter in the metasurface with dimensions of tIT O = 110nm, tAl2 O3 = 5nm, tAg = 80nm, tCr = 1nm. (b) Illustration demonstrating the movement of silver ions and the creation of silver filaments when an electrical bias is applied; the gray circles within Al2O3 and ITO represent silver nanoparticles. (c) Reflectance spectra were obtained at normal incidence for a freshly prepared sample. The dashed lines indicate simulation results without any applied bias, while the solid lines correspond to experimental results obtained under an applied bias ranging from 0 to 5 mV. The applied bias is incremented in steps of 0.5 mV (Ref. [Citation109]). (d) SEM images of the fabricated Ag-doped GeSe metagrating array. Inset depicting the nanostructure’s periodicity “P” and linewidth “W.” (e) Schematic representation of the photoionic reconfiguration mechanism. (f) The reflection spectrum of the as-deposited, optical set, and reset of Ag-doped GeSe nanogratings at p = 400nm. (g) The numerically simulated shift in optical constants conforms to the experimentally measured modification in reflection between the as-deposited, set, and reset conditions of the metagrating (Ref. [Citation6]).
![Figure 9. Tunable metasurfaces based on ionic migration (a) Schematic illustrating the anticipated interaction between light and matter in the metasurface with dimensions of tIT O = 110nm, tAl2 O3 = 5nm, tAg = 80nm, tCr = 1nm. (b) Illustration demonstrating the movement of silver ions and the creation of silver filaments when an electrical bias is applied; the gray circles within Al2O3 and ITO represent silver nanoparticles. (c) Reflectance spectra were obtained at normal incidence for a freshly prepared sample. The dashed lines indicate simulation results without any applied bias, while the solid lines correspond to experimental results obtained under an applied bias ranging from 0 to 5 mV. The applied bias is incremented in steps of 0.5 mV (Ref. [Citation109]). (d) SEM images of the fabricated Ag-doped GeSe metagrating array. Inset depicting the nanostructure’s periodicity “P” and linewidth “W.” (e) Schematic representation of the photoionic reconfiguration mechanism. (f) The reflection spectrum of the as-deposited, optical set, and reset of Ag-doped GeSe nanogratings at p = 400nm. (g) The numerically simulated shift in optical constants conforms to the experimentally measured modification in reflection between the as-deposited, set, and reset conditions of the metagrating (Ref. [Citation6]).](/cms/asset/8c20f153-deb2-41b9-bb81-856ce3a7238e/tapx_a_2338285_f0009_oc.jpg)
Upon the application of a positive voltage to the oxidizable electrode (Ag), the constituent atoms start dissolving and form a metallic filament on the inert electrode located on the opposite side (as shown in ). With an increasing applied bias, this metallic filament eventually connects with the counter electrode (ITO), causing a broadband relative increase in reflectance of up to 9% within the wavelength range of 500 nm < λ <800 nm (). Reversing the bias triggers the dissolution of the filament through ionic transport in the opposite direction, gradually restoring the device to its original state. Such an ionic-based modulation mechanism allows for non-volatile optical modulation with low power consumption, eliminating the requirement for slower mechanical mechanisms or energy-intensive melt-quenching procedures. The study delved deeper into the fundamental mechanism of this process by employing the effective medium model in the Bruggeman approximation. This analysis encompassed varying fill fractions of silver into ITO, unveiling a clear relation between the change in ionic conductance (optical response) and the permittivity of the surrounding medium (By increasing the silver content in the indium tin oxide (ITO), the real part of the effective permittivity shifts towards longer wavelengths and the imaginary part increases).
In the pursuit of transitioning towards the realization of all-optical devices, various studies have been conducted to explore the potential of harnessing the photoionic phenomena in metal-doped amorphous chalcogenides (MdACs) [Citation26,Citation77]. McRae et al. recently employed this approach to achieve an all-optical nonvolatile reconfiguration in Ag-doped GeSe metasurfaces [Citation6]. An array of meta-gratings, characterized by a periodicity ranging from 400 nm to 450 nm and a linewidth of 130 nm, were fabricated using FIB milling of 300 nm thickness Ag-doped GeSe, employing a current of less than 28 pA to prevent crystallization during the milling process, as illustrated in the SEM image in . In this study, the researchers investigated the migration of Ag ions toward the surface of metagratings forming Ag clusters in response to light with photons possessing energies on the order of the host material’s bandgap. The light source employed is a continuous-wave (CW) laser with a wavelength of 405 nm, providing 13.8 mW for the “set” process (Ag deposition on the surface) and 30.8 mW for the “reset” process (Ag returning to the chalcogenide matrix) as shown in . The reversible ion migration induced by light results in a modulation of over 50% in reflection amplitude and less than 3 nm shift in the resonance wavelength between the “set” and “reset” states in Ag-doped GeSe metagratings, as shown in .
In-depth analysis aimed at comprehending the change in Ag-doped GeSe involved fine-tuning optical constants in the simulations to align with the experimentally observed variations in reflection between the “set” and “reset” states. This analysis unveiled a significant 10% shift in both the refractive index (n) and extinction coefficient (k), resulting in a total average change of ∆n = 0.2 and ∆k = 0.04 due to photonic-induced transformations within the metasurfaces (see ). Moreover, when the device transitions to the “reset” state after cycling, there is an average reduction of 2.4% in both n and k values. Consequently, the changes observed in reflection can be attributed to the change in the refractive index and extinction coefficient of the photoionic metasurfaces.
5. The underlying physical mechanism
Gaining a comprehensive understanding of the switching behavior in electrical and optical devices, particularly regarding the transition between higher and lower resistive and optical states, necessitates thoroughly comprehending the underlying physical processes occurring in the active layer. Given the highly cross-disciplinary nature of the multitude of forces at play in ionic devices, the precise microscopic mechanism governing the resistive switching process in many systems remains to be fully determined. A crucial factor in understanding the switching process in ionic-based switches and modulators is the type of moving ion involved, whether positive or negative. Furthermore, as mentioned, the distribution of ions within the switching layer can be filamentary or interfacial, depending on their arrangement. The device’s response to the polarity of the applied voltage (electrical stimulus), whether it exhibits unipolar or bipolar switching, is also vital. This section will discuss several underlying physical switching strategies triggered by electrical or optical stimuli that have been widely utilized in device architectures presented in previous sections.
5.1. Electrical mechanisms
Electrical switching in ionic devices is focused on the modulation of electrical resistance in response to the history of the applied voltage or current in a device that has experienced significant activity and attracts interest from both fundamental science and practical engineering. This phenomenon is commonly referred to as memristive switching, which represents a non-volatile variation in the resistance value of the device. The most favorable configuration for memristors is the MIM, which involves sandwiching an insulating or dielectric layer between two metal electrodes. Furthermore, the device’s response is contingent upon various factors, such as the forming conditions, dimensions, and materials of choice for the electrodes and switching layers. In the case of bipolar switching, the device response exhibits dependence on the polarity of the applied voltage, whereas, in unipolar switching, it remains independent of the voltage polarity [Citation88]. The occurrence of resistance switching in these devices can be attributed to either a filamentary mechanism or an interfacial (homogeneous) mechanism, as discussed before [Citation20,Citation21,Citation28,Citation47,Citation48,Citation112–117].
5.1.1. Effect of electrical stimulus specifications on the device response
Over the past several years, research has focused on optimizing the resistive switching device parameters (geometries, materials, operating voltage, and current), seeking to understand the physical mechanisms of the polarity-dependence devices and define the most efficient performance for each application. The applied voltage and current restrictions, in addition to the memristive device design and component material for electrodes and switching layers, play a vital role in deciding whether the device is unipolar or bipolar. The coexistence of unipolar and bipolar resistive switching in VCM cells was demonstrated for the first time in 2007 [Citation61,Citation118].
Wang et al. recently investigated the impact of compliance current (IC) on the device response [Citation82]. Their investigation of the Ag/Ti/CeO2/Pt devices in demonstrated bipolar and unipolar resistive switching characteristics at ambient temperature. The top and bottom electrodes are an Ag disc with a diameter of 0.2 mm and a Pt thin film, respectively. At the same time, the active area is a bilayer structure made of amorphous 25 nm Ti and polycrystalline 50 nm CeO2. All these layers were deposited using sputtering. The device demonstrated bipolar resistive switching, which is advantageous for non-volatile memory applications, with no forming step and IC set to 1 mA, as shown in . The device, in its as-deposited state, demonstrated a high resistance state (HRS) with a measured resistance value of 2.8 kΩ. However, applying +300 mV to the Ag electrode converted the device to LRS (270 Ω). This high on/off (> 10) contrast ratio can be referred to as the conductive filament growth observed in the switching layer. Therefore, ECM dominates this device’s resistance for the reasons listed above. Some Ag atoms are converted into positive ions when a positive voltage is applied to the Ag top electrode. Then, silver ions go to the negative electrode under an electric field. The device switches from HRS to LRS during this phase, when silver ions are converted into Ag atoms and create conductive filaments. The reverse process is seen when a negative voltage is supplied to the Ag; the produced conductive path slowly diffuses to create HRS. The diffusion mechanism of Ag through the active area in the set and reset procedures was shown in the inset of . As a result of the production of a second (weak) filament formed of oxygen vacancies in the set stage, the reset voltage changes from cycle to cycle and ranges from −300 mV to −600 mV. On the other hand, when a current constraint of 2 mA was maintained in the set process and no compliance current as specified in the reset process (allowing a greater current to flow), the device exhibited unipolar behavior. The device switched from HRS to LRS when the voltage increased to roughly 1.4 V, causing the current to increase.
Figure 10. Effect of different parameters on the device response (a) Artistic representation of an Ag/Ti(25 nm)/CeO2(50 nm)/Pt ECM memristor. Log (I)-V characteristics in (b) Bipolar and (c) Unipolar approaches. The insets show the electrochemical reactions during both modes’ growth and rupturing of the conducting Ag filaments (Ref. [Citation82]) (d) A 3D representation of the structure of the Pt(100 nm)/NiO(30 nm)/Pt(100 nm) resistive switching device. The switching procedures for unipolar and bipolar modes are depicted schematically when (e) a positive voltage is applied, oxygen vacancies move downhill via favored routes such as grain boundaries, forming the first conducting filaments near the top electrode (top), reaching the opposite electrode (bottom) and the current rapidly climbs to IC . (f) A large current flow through the constricted channel thermally collapses the filament (top) with another positive voltage sweep, with no IC applied, resulting in a dramatic rise in resistance. The following voltage sweep with IC causes the development of bridge filaments to develop amid the existing filaments (bottom). (g) A negative voltage sweep causes oxygen vacancies to travel upward, causing the connecting filament close to the top electrode to break (top), and then the oxygen vacancies shift downward, restoring the filament (bottom) (Ref. [Citation119]). (h) Schematic illustration of resistive switching crossbar structure with Pt/metal-oxide/Pt stack. (i) Diagram exhibiting observed scaling patterns forming the two electrical polarity features when cell area and forming current are varied. Unipolar shows less dependency on the device area than bipolar behavior. (j) Diagram explaining the effect of crystal structure (single/polycrystalline), device area, and electric field intensity on determining the switching response. Single crystalline behaves mostly bipolar (Ref. [Citation120]).
![Figure 10. Effect of different parameters on the device response (a) Artistic representation of an Ag/Ti(25 nm)/CeO2(50 nm)/Pt ECM memristor. Log (I)-V characteristics in (b) Bipolar and (c) Unipolar approaches. The insets show the electrochemical reactions during both modes’ growth and rupturing of the conducting Ag filaments (Ref. [Citation82]) (d) A 3D representation of the structure of the Pt(100 nm)/NiO(30 nm)/Pt(100 nm) resistive switching device. The switching procedures for unipolar and bipolar modes are depicted schematically when (e) a positive voltage is applied, oxygen vacancies move downhill via favored routes such as grain boundaries, forming the first conducting filaments near the top electrode (top), reaching the opposite electrode (bottom) and the current rapidly climbs to IC . (f) A large current flow through the constricted channel thermally collapses the filament (top) with another positive voltage sweep, with no IC applied, resulting in a dramatic rise in resistance. The following voltage sweep with IC causes the development of bridge filaments to develop amid the existing filaments (bottom). (g) A negative voltage sweep causes oxygen vacancies to travel upward, causing the connecting filament close to the top electrode to break (top), and then the oxygen vacancies shift downward, restoring the filament (bottom) (Ref. [Citation119]). (h) Schematic illustration of resistive switching crossbar structure with Pt/metal-oxide/Pt stack. (i) Diagram exhibiting observed scaling patterns forming the two electrical polarity features when cell area and forming current are varied. Unipolar shows less dependency on the device area than bipolar behavior. (j) Diagram explaining the effect of crystal structure (single/polycrystalline), device area, and electric field intensity on determining the switching response. Single crystalline behaves mostly bipolar (Ref. [Citation120]).](/cms/asset/131659aa-5e72-4684-84bf-39857e04aaf9/tapx_a_2338285_f0010_oc.jpg)
Finally, the device switched from LRS to HRS at about 0.7 V when positive voltage was introduced, as seen in . The thermochemical mechanism (TCM) was used to explain unipolar behavior. As can be seen in the inset of , when the filament formation occurs, the device is in LRS because the film typically conducts through a local conductive channel that is only a small size. As a result, the current density through the conductive channel is rather high, and the resulting amount of Joule heat causes the conductive filament temperature to rise quickly. Eventually, the conductive filament ruptures due to the high temperature, and the device switches back to HRS.
In 2014, Choi and Kim demonstrated the coexistence of unipolar and bipolar resistive switching methods in a 30 nm NiO thin film fabricated by reactive sputtering sandwiched between two Pt electrodes with 100 nm thickness, as shown in the schematic architecture in [Citation119]. The authors further explained the two switching approaches, including a graphical illustration in . During the initial voltage sweep, the migration of oxygen vacancies towards the bottom electrode occurs predominantly through pathways with higher concentrations of defects, such as grain boundaries or dislocations. These regions serve as favorable drift pathways for the movement of oxygen vacancies. Instead of a uniform decrease in bulk resistance from the top to the bottom surface, this process creates conducting “filaments” that have grown downward after forming at the top electrode ( ‘top’). Then, the current flows until it reaches IC = 1 mA after a filament connects the top/bottom electrodes ( ‘bottom’). Without IC, the filament is thermally ruptured in the positive direction during the third voltage sweep. ( ‘top’), causing a reset to the pre-existing filaments. New filaments are produced during the fourth sweep ( ‘bottom’). The writing process is repeated, finishing the switching cycle for the unipolar mode as a new bridging filament or many filaments that develop nearly together. In the case of bipolar switching, the disconnection of the conducting filament results from the upward migration of oxygen vacancies to reconnect with Ni ions near the top electrode ( ‘top’) when a negative voltage is applied to the top electrode from the state shown in ‘bottom.’ The formation process is initiated once the positive applied voltage reconnects the top electrode ( ‘bottom’). The observed transition between the two switching modes shows that the two modes share the conducting filaments. However, smaller magnitudes of programming voltages are required for the bipolar mode (VSET ≈ 3.5 V and VRESET ≈ 0.5 V compared to VSET ≈ 5.5 V and VRESET ≈ 1.5 V in unipolar mode), where partial connection/disconnection of the filaments achieves the switching. Contrarily, unipolar switching necessitates higher programming voltages since it involves eliminating one filament and creating a new bridging filament.
Yanagida et al. demonstrated how variations in geometrical dimensions influence the electrical polarity response [Citation120]. They achieved this by studying resistive switching behaviors across eight orders of magnitudes of surface areas (102 nm2 < Area < 1010 nm2) in a selection of diverse metal oxide materials, including TiO2−x, CoOx, and NiOx. These materials were placed between two Pt electrodes. The investigation also encompassed a wide range of forming current values(10−10 A < IF orming < 10−2 A) and electric field intensity values, from −1 MV/cm to 1 MV/cm. As seen in , the devices were built as crossbar junctions. PLD was used at room temperature to deposit these oxide layers with thicknesses ranging from 50 nm to 200 nm on the bottom electrodes. As shown in , the graph provides a new perspective group of the alterations of two electrical polarities according to the formation current and cell area for various metal oxides under study. Although the oxide materials differ in their elemental compositions, they qualitatively display a similar response, demonstrating comparable trends in the cell area effect and forming-current effect. Two threshold lines in the figure indicate whether an increase in forming current will result in bipolar or unipolar switching. The crossover of the two threshold lines in the diagram indicates that the threshold line for unipolar switching appears less area-dependent than bipolar switching and arises for larger cell devices at a relatively high forming current range. Non-memory behavior is mostly seen in relatively lower forming current values for all cell areas.
The occurrence of threshold events in both resistive switching modes is inherently dependent on the crystallographic structure of the deposited oxide films, as depicted in . The graph compares polycrystalline and single crystalline epitaxial oxide (CoOx and NiOx) samples’ resistive switching behaviors. Polycrystalline devices predominantly demonstrate unipolar switching, while their single crystalline epitaxial counterparts exhibit bipolar switching. This contrast remains consistent in the case of identical cell areas, forming currents, and similar electric field conditions. The electrical breakdown strength of the oxide coating plays a significant role in shaping unipolar switching characteristics. The lower presence of crystal defects in single-crystal samples contributes to their higher electrical breakdown strength, setting them apart from polycrystalline samples and resulting in the observed distinct switching behaviors.
5.1.2. Influence of kinetic parameters on metallic filament shape
As the previous example explains, the ECM structure mainly consists of three layers (solid electrolyte medium between two active and inert electrodes). Both electrodes are in equilibrium when no external voltage is applied to the cell. The switching mechanism begins with the oxidation of the process at which the active anode (oxidizable) produces the metallic ions. In contrast, the counter electrode (inert) provides electrons by applying external voltage (positive on the active electrode) as follows [Citation28]:
After that, the strong electric field starts to cause cations in the solid electrolyte to move toward the opposing electrode. The final phase in filament growth is the reduction of metal and its subsequent electro-crystallization on the surface of the inert electrode.
However, the reduction location, growth direction, and filament shape vary depending on the redox rate (Γi) and ion mobility (µ) kinetic factors. There are four case studies with these two aspects, as shown in . Controlled nanocluster movement can be employed to create and adjust the operations of innovative electric devices [Citation121].
Figure 11. Filament growth shapes and directions as a function of kinetic parameters (mobility and redox rate) (i) high mobility and high redox rate. (ii) low mobility and low redox rate. (iii) low mobility and high redox rate. (iv) high mobility and low redox rate (Ref. [Citation121]).
![Figure 11. Filament growth shapes and directions as a function of kinetic parameters (mobility and redox rate) (i) high mobility and high redox rate. (ii) low mobility and low redox rate. (iii) low mobility and high redox rate. (iv) high mobility and low redox rate (Ref. [Citation121]).](/cms/asset/2f59d533-114e-4b4e-81e3-c9990bbbe9a7/tapx_a_2338285_f0011_oc.jpg)
In the first case, the ion mobility and redox rates are high and uniform. As a result, the ions can reach the inert electrode without agglomerating, preventing nucleation within the insulating film. The filament growth starts from the inert electrode with an inverted cone-shaped filament with its base at the inert electrode interface (case a). This is consistent with filament development in typical ECM devices and correlates to material systems with strong ionic conductivity [Citation122]. In the case of low redox rate and high mobility, similar growth behavior is observed as in case (d). However, in this scenario, the filament adopts a tree branch-like structure, primarily due to reduction occurring predominantly at the borders characterized by high field intensities. This occurrence can be attributed to the limited availability of cations during the process. On the contrary, in case (c), the reduction occurs inside the electrolyte at low mobility and higher redox rate. The procedure is repeated after connecting the nuclei to the anode, resulting in effective forward development towards the cathode. This case was observed in Ni/SiO2/Pt structure in reference [Citation121]. Finally, in case (b), with low mobility and redox rate, the reduction starts at the active electrode and forms a cone shape of separate nanoclusters. The filament begins at the active electrode and develops into distinct nanoclusters as it moves toward the inert electrode. This situation relates to material systems with very low ionic conductivity. Case (b) and (d) were demonstrated in reference [Citation123] with a-Si and sputtered SiO2, respectively.
5.2. Optical mechanisms
The preceding section focused on how electrical stimulation switches the state of the material in nanoionics through ionic (cation/anion) migration in nanoscale ECM and VCM devices [Citation20–22,Citation124,Citation125]. On the other hand, in photoionics, the activation occurs through incident photons carrying sufficient energy to induce the mobilization of metallic ions within the host medium, predominantly comprising chalcogenides (Bulk and thin films) [Citation6,Citation23,Citation77,Citation126,Citation127]. Photoionics have a wide range of photo-induced phenomena that make them useful in several optical applications. These phenomena can be classified into two types depending on whether the temperature increase brought on by light is determinative or not: thermal effects and photon (athermal) effects. Optothermal effects include converting photon energy received by a material into a temperature increase that causes atomic modifications. The optical phase change material is the most well-known photothermal process in chalcogenides, with Ovshinsky first introducing the concept [Citation128]. As stated in earlier sections, structural shifts between an amorphous state and a crystalline phase occur in response to pulsed light exposures, which may function as optical memory (GST has matured in this field). The photon effects can be classified into bulk changes such as photodarkening [Citation129,Citation130] or photon-ion interactions, which is the focus of this review. Therefore, The rest of this section will study the metal ion movement stimulated by external optical sources in chalcogenide glasses, in particular in their amorphous phase, namely optically-induced dissolution and diffusion (OIDD), photochemical modification (PCM), and photo-induced surface deposition (PSD), as shown in [Citation23,Citation131].
Figure 12. Schematic illustration comparing the three photoionic phenomena of metallic ions (Ag) in host medium (chalcogenides) (a) Optically-induced dissolution and diffusion (OIDD). (b) Photochemical modification (PCM). (c) Photo-induced surface deposition (PSD). The small black dots represent the Ag atoms, and the arrow denotes the direction of ionic migration. This illustration has been redrawn from Ref [Citation23].
![Figure 12. Schematic illustration comparing the three photoionic phenomena of metallic ions (Ag) in host medium (chalcogenides) (a) Optically-induced dissolution and diffusion (OIDD). (b) Photochemical modification (PCM). (c) Photo-induced surface deposition (PSD). The small black dots represent the Ag atoms, and the arrow denotes the direction of ionic migration. This illustration has been redrawn from Ref [Citation23].](/cms/asset/e163f11e-88e5-437b-8d96-43965e099885/tapx_a_2338285_f0012_oc.jpg)
OIDD is evident in samples where a chalcogenide glass is in contact with an Ag layer. During illumination, Ag atoms dissolve into the glass, transforming into Ag+ and infiltrating its interior, as illustrated in . This phenomenon is induced by light with a photon energy equal to the bandgap of the host medium. This photodoping process, considered a photochemical reaction, results in the formation of MdACs [Citation132,Citation133]. Chalcogenide glasses with high Ag content, exceeding 30 at.%, have been extensively studied for their application as solid-state electrolytes in batteries due to their significant ionic conduction. Conversely, a phenomenon termed PSD occurs in Ag-rich chalcogenides when exposed to bandgap light, leading to the deposition of metallic silver particles in the illuminated region [Citation76,Citation84], as shown in . PCM was reported to occur in MdACs with Ag concentration less than the PSD. Under bandgap light illumination, the Ag+ ions migrate from the dark region to the illuminated region, resembling the PSD phenomenon, without the deposition of Ag particles (see ). Importantly, the PCM process is reversible without annealing [Citation134].
Over the past few decades, bulk and thin films of MdACs have attracted researchers due to their unique optoelectronic characteristics [Citation40,Citation102,Citation135–138]. In such systems, silver (Ag) is favored as a dopant of choice primarily due to its mobility characteristics and ability to manifest distinctive photoinduced phenomena during migration. In 2019, Zheng et al. conducted an investigation into the impact of Ag concentrations in Agx(GeSe3)100−x films by co-sputtering from two Ag and GeSe3 targets [Citation139]. The research involved various characterization techniques, including X-ray diffraction (XRD), Raman spectroscopy, and optical transmission measurements. The study encompassed a range of compositions, specifically for x values of 0, 15, 21, 25, and 29. The optical transmission spectra were measured within the wavelength range of 0.5µm ≤ λ ≤ 1.2µm are illustrated [Citation139]. The transmission spectral response experiences a redshift as the silver content increases, signifying the Ag composition in tailoring the optical properties of MdAC films. This phenomenon was attributed to the influence of increased silver concentration, which led to the narrowing of the bandgap within the electronic structure of MdAC. The optical bandgap of a material delineates the required photon energy for exciting electron-hole pairs and inducing the displacement of metallic ions in MdACs. A reduced bandgap allows modulation/switching with lower photon energy. The optical bandgap can be derived by analyzing the slope of a plot based on Equationequation (9)
(9)
(9) [Citation15], as illustrated in .
Figure 13. Photoionic effect in metal-doped chalcogenides (a) The optical transmission spectra for Agx(GeSe3)100−x films with x = 0,15,21,25,29. (b) The optical bandgap energies are calculated using Tauc’s rule as a linear extrapolation of the strong absorption results. (c) The refractive indices of different concentrations are estimated according to the Swanepoel approach [Citation139]. (d) Schematic illustration of the suggested procedures for the optically induced diffusion and dissolution (OIDD) phenomenon in an Ag/chalcogenide structure (Ref. [Citation77]). Inset: The three stages of Silver OIDD in As2S3 (induction period “exponential behavior,” effective region, and shutdown stage) (Ref. [Citation140]). SEM image of (e) 800 nm As2Se3 film. (f) 10 nm Ag thermally evaporated over the chalcogenide layer in (e). (g) The bi-layer device after illumination with a 523 nm laser. (h) After-illumination annealing step to 150 C (Ref. [Citation141]).
![Figure 13. Photoionic effect in metal-doped chalcogenides (a) The optical transmission spectra for Agx(GeSe3)100−x films with x = 0,15,21,25,29. (b) The optical bandgap energies are calculated using Tauc’s rule as a linear extrapolation of the strong absorption results. (c) The refractive indices of different concentrations are estimated according to the Swanepoel approach [Citation139]. (d) Schematic illustration of the suggested procedures for the optically induced diffusion and dissolution (OIDD) phenomenon in an Ag/chalcogenide structure (Ref. [Citation77]). Inset: The three stages of Silver OIDD in As2S3 (induction period “exponential behavior,” effective region, and shutdown stage) (Ref. [Citation140]). SEM image of (e) 800 nm As2Se3 film. (f) 10 nm Ag thermally evaporated over the chalcogenide layer in (e). (g) The bi-layer device after illumination with a 523 nm laser. (h) After-illumination annealing step to 150 C (Ref. [Citation141]).](/cms/asset/bf251848-81dc-4e93-b941-9049711a2fae/tapx_a_2338285_f0013_oc.jpg)
Where K is constant depends on the transition probability and ν is the light frequency. In addition, displays the refractive indices of the Agx(GeSe3)100−x films, which were computed using the Swanepoel method in Ref [Citation142]. based on the optical transmission spectra. It reveals a consistent pattern where the refractive indices exhibit enhancement as the silver (Ag) content in the MdAC films increases.
Historically, the first investigation of optically induced dissolution and diffusion (OIDD) of metal in semiconductors was conducted in 1966 by Kostyshin et al. [Citation143]. The OIDD process is generally considered to be a solid-state chemical reaction. S-based [Citation73,Citation132,Citation144,Citation145] and Se-based [Citation141] chalcogenides were extensively studied as host materials for ionic motion in OIDD. This process can be divided into three stages illustrated in : an induction period, effective photo-dissolution, and a final step that shuts down the diffusion. The first stage (exponential part of the inset in ) starts just after the light exposure to the two-layer system Ag/Chalcogenide with an energy higher than the chalcogenide optical bandgap energy to excite
electron-hole pair close to the boundary.
Electrons will likely be trapped within a limited distance and form negatively charged centers at chalcogen sites, whereas holes can move considerably further. The creation of pairs of Ag+ and electrons results from the buildup of holes at the Ag/chalcogenide border. The holes and Ag+ are introduced into the chalcogenide, leaving some silver species linked to the chalcogen sites and some free unbonded Ag+ capable of moving ahead and neutralizing the electrons. Over time, an intermediate layer developed between the metal electrode and the chalcogenide film. Increasing light intensity enhances the formation of a uniformly doped layer, which reduces the induction time. The second stage, the effective step in the OIDD, has two possibilities for rate-limiting. The first occurs because of a metal-chalcogenide reaction at the surface between them; thus, the metallic thickness is linearly dependent on the time. On the other hand, the square root time dependency of the photo dissolution behavior may be explained as rate restriction caused by metal diffusion through the reaction product with chalcogenide. This stage applies till reaching a film thickness of ≈ 1 µm −1.5 µm or exhausting the metallic Layer [Citation77]. Then, the final stage starts with lower dissolution rates till shutdown [Citation127,Citation132].
Jain et al. [Citation73] investigated the kinetics of photo-dissolution of Ag in Ag/As2S3 heterostructures, shedding light on the difference in dynamic processes occurring in diffusion kinetics when illumination comes from the chalcogenide (As2S3) side versus the silver side. Various sample sets were prepared, each with different layer configurations. In Set 1, the thickness of Ag was systematically varied, while the thickness of the overlying As2S3 was consistently maintained at 430 nm. Set 2 involved the deposition of 20 nm Ag beneath As2S3 layers, with the As2S3 having thicknesses of 430 nm and 860 nm. In Set 3, 20 nm Ag was deposited above and below the As2S3 layer with 430 nm and 860 nm thicknesses. Their observations unveiled that the dissolution process is accelerated when light is incident from the chalcogenide side, owing to silver’s significantly higher reflectivity than chalcogenides. Consequently, only a minor light fraction reaches the Ag/As2S3 interface. Furthermore, the OIDD achieves its saturation more rapidly as the thickness of the Ag film decreases. In contrast, this process does not significantly show a relation with the thickness of the As2S3 matrix.
In 2018, Aparimita et al. suggested a thermally enhanced OIDD of Ag (10 nm)/As2S3(800 nm) bilayer structure by adding an annealing stage at 423 k after 532 nm laser irradiation [Citation141]. The SEM picture of the four films, such as as-deposited As2S3, Ag/As2S3, illuminated and annealed Ag/As2S3, is shown in , which reveals the uniformity of the films. The As2S3 film has a very smooth surface (). The Ag particles are spread equally, as visible on the surface of the As2S3 layer (). Because of the Ag particles contained in the chalcogenide network, light diffusion resulted in the formation of tiny species of As2S3. These species are visible as white-marked particles on the exposed film (). The thermally diffused film exhibits more conspicuous species with an increasing number, as shown in .
The other two photoinduced phenomena (photochemical modification and photoinduced surface deposition) mainly deal with the metal already dissolved in chalcogenides. However, the difference is that photochemical modification is volatile after removing the optical stimulus, and no deposition happens on the film’s surface [Citation134].
In addition, PSD requires a higher concentration of silver. Although there is no deposition observed in photochemical modification, the concentration of silver in illuminated was observed to have higher values in the irradiated region. When an Ag – As – S system is irradiated with optical energy around the bandgap, the lone pair of electrons are excited, resulting in electrons and holes. Because the holes distribute toward the unlit zone, it becomes positively charged. The Ag+ ions counterflow the hole current to preserve charge neutrality, changing Ag concentration with light illumination [Citation147]. shows an SEM picture of Ag deposition and thermal erasure in PSD Ag61.5 (Ge0.3S0.7)38.5 films.
Figure 14. SEM image Ag61.5(Ge0.3S0.7)38.5 MdAC films (a) As deposited (140 nm). (b) After initial illumination. (c) After annealing of (b) at 423 K for 10 min. (d) After illumination of (c) with a Hg lamp of 0.16 W/cm2 for 10 min (Ref. [Citation146]). Ag45As15S40 bulk film after Illumination with Hg lamp of (e) 200 mW/cm2 and (f) 530 mW/cm2 for 15 min at room temperature. The flower-like shape was observed of deposited silver with increasing light intensity (Ref. [Citation23]). SEM pictures of Ag-As-S thin-film surface after an hour of laser irradiation at 4.64 W/cm2 (laser dewetting) with concentrations (g) 0%. (h) 4%. (i) 9%. (j) 36%. The wrinkles’ direction is normal to the electric field polarization direction (Ref. [Citation126]).
![Figure 14. SEM image Ag61.5(Ge0.3S0.7)38.5 MdAC films (a) As deposited (140 nm). (b) After initial illumination. (c) After annealing of (b) at 423 K for 10 min. (d) After illumination of (c) with a Hg lamp of 0.16 W/cm2 for 10 min (Ref. [Citation146]). Ag45As15S40 bulk film after Illumination with Hg lamp of (e) 200 mW/cm2 and (f) 530 mW/cm2 for 15 min at room temperature. The flower-like shape was observed of deposited silver with increasing light intensity (Ref. [Citation23]). SEM pictures of Ag-As-S thin-film surface after an hour of laser irradiation at 4.64 W/cm2 (laser dewetting) with concentrations (g) 0%. (h) 4%. (i) 9%. (j) 36%. The wrinkles’ direction is normal to the electric field polarization direction (Ref. [Citation126]).](/cms/asset/686c42bf-51cb-44bc-a982-eeda1f26cf6d/tapx_a_2338285_f0014_b.gif)
The as-deposited film in was initially illuminated, resulting in small Ag particle deposition even after switching off the light source (see ). The RESET step is performed thermally at 150 C. The dissolved Ag particles left dark spots on the film surface, as illustrated in , causing larger deposited particles in the second illuminating () [Citation146]. The Ag deposits’ morphology changes concerning the illumination light’s intensity, as seen in . Disc-like deposits can be observed in , and as the light intensity increases, so does the size of the deposits. The periphery portion of , representing rather significant deposits, is higher than the core section, giving the particles the look of a flower. Between the deposits that resemble flowers, other smaller deposits are also seen. Little deposits appear to form after the development of the deposits that resemble flowers. The photosensitivity of the PSD effect rises with an increase in photon energy, and photon energy larger than the optical bandgap is required to induce PSD. According to these findings, the PSD cannot occur without photoexciting electron-hole pairs [Citation76].
The topography of silver deposited onto the surface of an alloy through ionic migration is elegantly utilized for laser-induced dewetting of silver in such alloys, which was initially demonstrated by Douaud et al. [Citation126,Citation148]. This phenomenon can be observed when subjecting silver-doped chalcogenide thin films with lower silver concentrations (< 20%) to laser irradiation within the bandgap energy range. This process resulted in the formation of periodic relief patterns on the film surfaces, and the characteristics of these patterns could be finely tuned by adjusting laser parameters (time and energy) or by varying the film thickness. Notably, the direction of the periodic pattern was observed to be perpendicular to the polarization of the laser. In their study shown in [Citation126], the authors examined the laser-induced modifications in Agx(As20S80)100−x thin films with varying silver concentrations (x ranging from 0% to 36% Ag). They utilized SEM to observe the effects of laser irradiation at a power density of 4.64 W/cm−2 over 60 minutes.
The results revealed three distinct types of surface features, each associated with specific silver concentration ranges. In samples with no silver (Ag0), small crystal formation occurred on the surface (see ), attributed to As2O3, a known phenomenon for As-S chalcogenide glasses [Citation149,Citation150]. The second type of surface modification occurred within the silver concentration range of 4% < Ag% < 19%, where relief periodic structures emerged, as shown in . The increased silver concentration amplified relief height, resulting in fully dewetted patterns. The periodicity of these structures was approximately 10 µm. The third type of surface change was observed for silver concentrations exceeding 36%, resulting in a rough texture, as illustrated in , due to photo crystallization of the thin film, with (Ag2S) crystallites verified via X-ray diffraction. The underlying mechanism of laser-induced dewetting can be explained as the absorption of laser energy by the silver-doped chalcogenide glass results in a localized temperature rise. This thermal effect drives surface diffusion of silver ions to the film surface, causing the film to dewet and form nanoscale silver droplets [Citation151]. The practical implications of this research are also explored. The authors discuss the potential use of laser-induced dewetting in developing nanoscale structures for various applications, such as information storage components and diffraction gratings [Citation126,Citation148].
6. The emergence of 2D Xenes materials
Since the pivotal discovery of graphene in 2004, the realm of nanoscience and nanotechnology has been captivated by two-dimensional (2D) materials, distinguished by their vertically stacked layers and unique structural characteristics [Citation152–156]. Within each layer, atoms are intricately covalently bonded, while van der Waals forces govern the stacking of these layers. As these materials transition from bulk to atomic monolayers, their properties change remarkably. Few nanometer layers exhibit better characteristics when compared to their bulk counterparts., including a remarkable surface-to-volume ratio, increased optical transparency, and flexible mechanical properties, in addition to their ability to form heterojunctions with other materials through van der Waals forces, enhancing their properties, rendering them exceptionally well-suited for the development of stable and energy-efficient nanoscale devices [Citation157].
In recent years, considerable advancements have been made in exploring 2D materials, specifically atomic sheets belonging to group 15 (black phosphorene [Citation158–160], antimonene [Citation161,Citation162], and bismuthene [Citation163,Citation164]), group 16 (selenene [Citation165] and tellurene [Citation166]) and graphdiyne [Citation167,Citation168]. These materials exhibit compelling potential as frontrunners for emerging devices, such as field-effect transistors [Citation169–172], optoelectronics, photonics [Citation166,Citation173,Citation174], catalysts [Citation175–177], batteries [Citation166,Citation178,Citation179], and biomedical applications [Citation167,Citation180,Citation181]. This is attributed to their intriguing physicochemical properties, notably the tunable bandgap and mechanical flexibility. Nevertheless, the material undergoes chemical degradation after its preparation under ambient conditions, culminating in a swift attenuation of its initially superb photoelectric properties. The principal instigator of this degradation is the prevalence of oxygen on its surface [Citation182]. Enhancing the stability of these materials is thus pivotal for their seamless integration into devices. This predicament can be addressed by doping [Citation159,Citation183,Citation184] or employing alternative substrates [Citation185], fostering interactions capable of effectively passivating the chemical bonds of the specific Xene.
Guo al. explored the application of metal-ion modification to bolster the stability and transistor efficacy of black phosphorus (BP) sheets [Citation158]. The primary focus of their study revolved around the spontaneous adherence of Ag+ ions to the BP surface, enhancing its strength against oxidation and degradation. The resulting Ag±modified BP field-effect transistor (FET) showed substantial improvements in hole mobility and ON/OFF ratio, crucial for applications in electronics and optoelectronics.
illustrates schematically the adsorption mechanism of Ag+ on BP. The lone pair electrons of phosphorus atoms within each BP layer are evenly distributed on both sides, engaging in a cation-π interaction with Ag+ ions, reinforcing the stability of BP against oxidation and degradation. Meanwhile, demonstrates the formation of bubbles on the BP surface after 5 days in ambient conditions due to the presence of PxOy. In contrast, the surface morphology after Ag+ doping remains intact, devoid of any discernible bubbles, corrosion, or degradation (). The consequential deterioration caused by such oxidation significantly impacts the electronic transport properties, impeding its viability in electronic devices. Fabrication of BP FET devices involved traditional micro-nano machining via electron-beam lithography, employing a three-electrode system to evaluate transport performance. shows the structure and microscopy image of a few-layer BP FET device with electrodes spanning the BP sheet and a 3 µm channel length for the source and drain electrodes. The Si substrate serves as the backgate electrode. The stability of the BPAg(+) FET was further assessed through exposure to air with a 95% relative humidity at room temperature. Transport property assessments were conducted every 12 hours, revealing that the BPAg(+) device maintained its transport properties for the initial 60 hours, with only a slight decline observed in the subsequent 12 hours (). In contrast, the FET device fabricated on bare BP experienced a substantial decline in transport properties within the initial 12 hours, becoming non-conductive after 24 hours ().
Figure 15. Ag+ integration for enhanced field-effect transistor (FET) performance (a) Schematic representation of the adsorption process of Ag+ on black phosphorus (BP). (b) Atomic Force Microscopy (AFM) images showing a bare BP and (c) BPAg+ after exposure to air for 5 days. (d) Microscopy picture (top) and structural schematic of a BP FET device on a 300 nm SiO2 Si substrate. (e) Current-to-gate voltage acquired from a BPAg+ FET device following air exposure for 0–72 hours. (f) Current-to-gate voltage acquired from a BP FET device after air exposure for 0–24 hours [Citation158].
![Figure 15. Ag+ integration for enhanced field-effect transistor (FET) performance (a) Schematic representation of the adsorption process of Ag+ on black phosphorus (BP). (b) Atomic Force Microscopy (AFM) images showing a bare BP and (c) BPAg+ after exposure to air for 5 days. (d) Microscopy picture (top) and structural schematic of a BP FET device on a 300 nm SiO2 Si substrate. (e) Current-to-gate voltage acquired from a BPAg+ FET device following air exposure for 0–72 hours. (f) Current-to-gate voltage acquired from a BP FET device after air exposure for 0–24 hours [Citation158].](/cms/asset/066d8f2d-13d8-432e-80e7-61d7d8ec9e01/tapx_a_2338285_f0015_oc.jpg)
Incorporating Xenes into existing devices holds significant promise for enhancing ionic-based devices. An illustrative example is the improvement of traditional zincion batteries, which often suffer from insufficient specific capacity and unstable output potential due to ion-intercalation or surface redox mechanisms at the cathode side. Chen et al.’s recent study proposes using Te nanosheets as the cathode material in zinc-ion batteries [Citation166], introducing a two-step reversible conversion process () of hexagonal-phase Te to trigonal-phase ZnTe2 (intermittent product) and cubic-phase ZnTe (final product), resulting in a long and ultra-flat discharge plateau. In addition, Addressing the escalating demand for flexible energy storage devices, an Aqueous-solid-state rechargeable Zn – Te nanosheet battery is facilely assembled with a sandwich structure (). The quasi-solid-state device exhibits commendable cycling stability, with the capacity retaining 75.1% after 500 cycles at a substantial current density of 1 Ag−1 (). This notable performance results from the superior reactivity and interfacial durability between the polyacrylamide (PAM) hydrogel electrolytes and the electrodes, along with excellent water-holding capability to immobilize substantive aqueous electrolytes in the matrix. To assess the flexibility of the quasi-solid-state Zn – Te battery, it undergoes bending at different angles, demonstrating no significant performance decay even at a 180° bending angle and delivering a high capacitance of 329 mAhg−1, as illustrated in . A quasi-solid-state Zn – Te battery is constructed, showcasing superior flexibility, robustness, and favourable electrochemical performance, demonstrating practical applications. This development represents a significant stride in energy storage, offering high capacity, stable output potential, excellent rate capability, and prolonged cyclic performance.
Figure 16. Te nanosheets (NSs) for improved stability and flexibility in Zn battery systems (a) Schematic illustration depicting the phase transformation during charging/discharging process, where yellow denotes Te atoms and gray represents Zn atoms. (b) Illustrative schematic of the architecture of a solid-state Zn–Te NSs battery. (c) Displayed stability in prolonged cyclic performance of Zn–Te NSs battery (500 cycles). (d) Evaluation of electrochemical performance under different degrees of bending [Citation166].
![Figure 16. Te nanosheets (NSs) for improved stability and flexibility in Zn battery systems (a) Schematic illustration depicting the phase transformation during charging/discharging process, where yellow denotes Te atoms and gray represents Zn atoms. (b) Illustrative schematic of the architecture of a solid-state Zn–Te NSs battery. (c) Displayed stability in prolonged cyclic performance of Zn–Te NSs battery (500 cycles). (d) Evaluation of electrochemical performance under different degrees of bending [Citation166].](/cms/asset/7ca1a4be-26d6-49fc-b98b-f7ff34a35529/tapx_a_2338285_f0016_oc.jpg)
7. Conclusion and outlook
As detailed in this comprehensive review, nanoionic and photoionic devices, driven by the movement of ions within a chalcogenide or oxide host lattice in order to reversibly alter their electrical resistance or optical characteristics, have attracted significant interest from a cross-disciplinary array of scientists globally. This is due to the potentially versatile application set, including non-volatile memory [Citation135,Citation186], logic operations [Citation187–189], as well as the possibilities in realizing adaptive or smart displays, modulators and detectors for sensing, processing and telecommunication platforms relying on analog, quantum and neuromorphic computing paradigms [Citation190–192].
Despite decades of notable progress in ionic-based devices, a comprehensive understanding of the dynamic ion-switching mechanism remains elusive. The specific impact of factors such as ionic concentration in the host medium, active area volume, stress, and the nature of the stimulus (whether it be Joule heating, electric potential, or photons) lacks quantitative elucidation. A better understanding of the underlying mechanisms will unlock more stable, drift and noise-free devices in both the optical and electronic domains. This is best enabled through high throughput combinatorial material discovery techniques, which will enable stoichiometric engineering of the alloys for specific applications through mapping their static and dynamic optical properties as a function of ion doping levels for future device integration [Citation53]. Furthermore, the optimization of device architectures through forward and artificial intelligence-assisted inverse design techniques will enable drastically lower power-consuming devices, which may be engineered to rely on smaller and smaller switching volumes [Citation193].
Despite the widespread research interest in 2D Xenes as promising materials for achieving atomic-scale devices, their integration into technological applications hinges on two critical advancements. Firstly, there is a significant need for depositing Xenes on large-scale substrates, ideally aligning with the wafer scale compatible with the semiconductor industry, using deposition tools that are not only more accessible but also more cost-effective. This necessity arises from the aspiration to seamlessly integrate these novel materials into existing technologies, following the successful paradigm set by graphene and transition metal dichalcogenides (TMDCs) [Citation194–196]. The capability to employ more user-friendly deposition techniques on a larger scale holds the potential to expedite the practical implementation of Xenes. Secondly, swift progress in advancing the technology readiness level of devices relying on Xenes is essential to present their competitiveness among the diverse array of 2D materials. Achieving progress in these two key areas will undoubtedly play a pivotal role in unlocking the full potential of Xenes and fostering their seamless integration into future technology. Overall, the intense cross-disciplinary research activity showcased in this review indicates a highly promising mixed-mode technology platform with well-identified challenges that are being actively addressed, making nanoionic and photoionic materials and devices prime for proliferation into various device platforms and industries in the coming decades.
Disclosure statement
No potential conflict of interest was reported by the authors.
References
- Rahmani M, Xu L, Miroshnichenko AE, et al. Reversible thermal tuning of all-dielectric metasurfaces. Adv Funct Mater. 2017;27:1700580. doi: 10.1002/adfm.201700580
- Lu L, Zhao S, Zhou L, et al. 16× 16 non-blocking silicon optical switch based on electro-optic Mach-Zehnder interferometers. Opt Express. 2016;24:9295–9307. doi: 10.1364/OE.24.009295
- Venkatasubramanian A, Sauer VT, Roy SK, et al. Nano-optomechanical systems for gas chromatography. Nano Lett. 2016;16:6975–6981. doi: 10.1021/acs.nanolett.6b03066
- Liu K, Ye CR, Khan S, et al. Review and perspective on ultrafast wavelength-size electro-optic modulators. Laser Photonics Rev. 2015;9:172–194. doi: 10.1002/lpor.201400219
- Gholipour B, Mu¨ller MJ, Li Y, et al. Roadmap on Chalcogenide Photonics. J Phys. 2022. doi:10.1088/2515-7647/ac9a91
- McRae L, Xie Y, Gholipour B. Photoionic driven movement of metallic ions as a nonvolatile reconfiguration mechanism in amorphous chalcogenide metasurfaces. Adv Opt Mater. 2021;9:2101046. doi: 10.1002/adom.202101046
- Kim JT. CMOS-compatible hybrid plasmonic modulator based on vanadium dioxide insulator-metal phase transition. Optics Lett. 2014;39:3997–4000. doi: 10.1364/OL.39.003997
- Joushaghani A, Kruger BA, Paradis S, et al. Sub-volt broadband hybrid plasmonic-vanadium dioxide switches. Appl Phys Lett. 2013;102:061101. doi: 10.1063/1.4790834
- Briggs RM, Pryce IM, Atwater HA. Compact silicon photonic waveguide modulator based on the vanadium dioxide metal-insulator phase transition. Opt express. 2010;18:11192–11201. doi: 10.1364/OE.18.011192
- Gholipour B. The promise of phase-change materials. Science. 2019;366:186–187. doi: 10.1126/science.aaz1129
- Karvounis A, Gholipour B, MacDonald KF, et al. All-dielectric phase-change reconfigurable metasurface. Appl Phys Lett. 2016;109:051103. doi: 10.1063/1.4959272
- Yang Z, Ramanathan S. Breakthroughs in photonics 2014: phase change materials for photonics. IEEE Photonics J. 2015;7:1–8. doi: 10.1109/JPHOT.2015.2504960
- Kana JK, Ndjaka J, Vignaud G, et al. Thermally tunable optical constants of vanadium dioxide thin films measured by spectroscopic ellipsometry. Opt Commun. 2011;284:807–812. doi: 10.1016/j.optcom.2010.10.009
- Xu Z, Bernussi AA, Fan Z. Voltage pulse driven VO2 volatile resistive transition devices as leaky integrate-and-fire artificial neurons. Electronics. 2022;11:516. doi: 10.3390/electronics11040516
- Tauc J, Grigorovici R, Vancu A. Optical properties and electronic structure of amorphous germanium. Phys Status Solidi B. 1966;15:627–637. doi: 10.1002/pssb.19660150224
- Ovshinsky SR. Reversible electrical switching phenomena in disordered structures. Phys Rev Lett. 1968;21:1450. doi: 10.1103/PhysRevLett.21.1450
- Mandal A, Cui Y, McRae L, et al. Reconfigurable chalcogenide phase change metamaterials: A material, device, and fabrication perspective. J Phys Photonics. 2021;3:022005. doi: 10.1088/2515-7647/abe54d
- Shportko K, Kremers S, Woda M, et al. Resonant bonding in crystalline phase-change materials. Nature Mater. 2008;7:653–658. doi: 10.1038/nmat2226
- Ding K, Wang J, Zhou Y, et al. Phase-change heterostructure enables ultralow noise and drift for memory operation. Science. 2019;366:210–215. doi: 10.1126/science.aay0291
- Zhu X, Lee SH, Lu WDNR-SD. Nanoionic resistive-switching devices. Adv Electron Mater. 2019;5:1900184. doi: 10.1002/aelm.201900184
- Waser R, Aono M. Nanoionics-based resistive switching memories. Nanosci Technol. 2007;2010:158–165.
- Wang Z, Wang L, Nagai M, et al. Nanoionics-enabled memristive devices: strategies and materials for neuromorphic applications. Adv Electron Mater. 2017;3:1600510. doi: 10.1002/aelm.201600510
- Kolobov AV. Photo-induced metastability in amorphous semiconductors. John Wiley & Sons; 2006.
- Park M, Zhang X, Chung M, et al. A review of conduction phenomena in Li-ion batteries. J Power Sources. 2010;195:7904–7929. doi: 10.1016/j.jpowsour.2010.06.060
- Pruthvija B, Lakshmi KP, Harshitha U A comprehensive overview of metal chalco- genides for rechargeable batteries. Materials Today: Proceedings. 2022; 71: 317–324 doi: 10.1016/j.matpr.2022.09.220.
- Kozicki MN, Mitkova M. Mass transport in chalcogenide electrolyte films–materials and applications. J Non-Crystalline Solids. 2006;352:567–577. doi: 10.1016/j.jnoncrysol.2005.11.065
- Kim SG, Han JS, Kim H, et al. Recent advances in memristive materials for artificial synapses. Adv Mater Technol. 2018;3:1800457. doi: 10.1002/admt.201800457
- Waser R, Dittmann R, Staikov G, et al. Redox-based resistive switching memories – nanoionic mechanisms, prospects, and challenges. Adv Mater. 2009;21:2632–2663. doi: 10.1002/adma.200900375
- Li B, Hui W, Ran X, et al. Metal halide perovskites for resistive switching memory devices and artificial synapses. J Mater Chem C. 2019;7:7476–7493. doi: 10.1039/C9TC02233C
- Gu C, Lee J-S. Flexible hybrid organic–inorganic perovskite memory. ACS Nano. 2016;10:5413–5418. doi: 10.1021/acsnano.6b01643
- Ismail M, Chand U, Mahata C, et al. Demonstration of synaptic and resistive switching characteristics in W/TiO2/HfO2/TaN memristor crossbar array for bioinspired neuromorphic computing. J Mater Sci Technol. 2022;96:94–102. doi: 10.1016/j.jmst.2021.04.025
- Kim T, Son H, Kim I, et al. Reversible switching mode change in Ta2O5-based resistive switching memory (ReRAM). Sci Rep. 2020;10:1–9. doi: 10.1038/s41598-020-68211-y
- Chamele N, Balaban MB, Patadia A, et al. Materials characterization and electrical performance of bilayer structures for enhanced electrodeposition in programmable metallization cells. Adv Elect Materials. 2022;8:2100897. doi: 10.1002/aelm.202100897
- Cheng B, Emboras A, Salamin Y, et al. Ultra compact electrochemical metallization cells offering reproducible atomic scale memristive switching. Commun Phys. 2019;2:28. doi: 10.1038/s42005-019-0125-9
- Wang Z, Jiang H, Jang MH, et al. Electrochemical metallization switching with a platinum group metal in different oxides. Nanoscale. 2016;8:14023–14030. doi: 10.1039/C6NR01085G
- Mahata C, Kang M, Kim S. Multi-level analog resistive switching characteristics in tri-layer HfO2/Al2O3/HfO2 based memristor on ITO electrode. Nanomaterials. 2020;10:10. doi: 10.3390/nano10102069
- Wiatrowski A, Obstarczyk A, Mazur M, et al. Characterization of HfO2 optical coatings deposited by MF magnetron sputtering. Coatings. 2019;9:106. doi: 10.3390/coatings9020106
- Sassine G, La Barbera S, Najjari N, et al. Interfacial versus filamentary resistive switching in TiO2 and HfO2 devices. J Vac Sci Technol B, Nanotechnol Microelectron: Mater, Process, Meas Phenom. 2016;34:012202. doi: 10.1116/1.4940129
- Zaffora A, Cho D, Lee K, et al. Electrochemical tantalum oxide for resistive switching memories. Adv Mater. 2017;29:1703357. doi: 10.1002/adma.201703357
- Kawaguchi T, Maruno S, Elliott SR. Optical, electrical, and structural properties of amorphous Ag–Ge–S and Ag–Ge–Se films and comparison of photoinduced and thermally induced phenomena of both systems. J Appl Phys. 1996;79:9096–9104. doi: 10.1063/1.362644
- Monroe CW. In Encyclopedia of applied electrochemistry. Kreysa, G., Ota, K.-i., Savinell, R. F., Eds. New York, NY: Springer New York; 2014. pp. 1125–1130.
- Brandes EA, Brook G. Smithells metals reference book. Amsterdam, Netherlands: Elsevier; 2013.
- Dean J, Lange N. Electrolytes, electromotive force, and chemical equilibrium. Lange’s Handbook of Chemistry. New York, United States: McGraw-Hill; 1999. p. 8.124–8.139.
- Chen T, Jin Y, Lv H, et al. Applications of lithium-ion batteries in grid-scale energy storage systems. Trans Tianjin Univ. 2020;26:208–217. doi: 10.1007/s12209-020-00236-w
- Kumar S, Strachan JP, Williams RS. Chaotic dynamics in nanoscale NbO2 Mott memristors for analogue computing. Nature. 2017;548:318–321. doi: 10.1038/nature23307
- Kudo M, Arita M, Ohno Y, et al. Filament formation and erasure in molybdenum oxide during resistive switching cycles. Appl Phys Lett. 2014;105:173504. doi: 10.1063/1.4898773
- Won S, Lee SY, Park J, et al. Forming-less and non-volatile resistive switching in WO x by oxygen vacancy control at interfaces. Sci Rep. 2017;7:1–8. doi: 10.1038/s41598-017-10851-8
- Kim W, Menzel S, Wouters DJ, et al. Impact of oxygen exchange reaction at the ohmic interface in Ta 2 O 5-based ReRAM devices. Nanoscale. 2016;8:17774–17781. doi: 10.1039/C6NR03810G
- Das SK, Mahapatra S, Lahan H. Aluminium-ion batteries: developments and challenges. J Mater Chem A. 2017;5:6347–6367. doi: 10.1039/C7TA00228A
- Zafar ZA, Imtiaz S, Razaq R, et al. Cathode materials for rechargeable aluminum batteries: current status and progress. Journal of Materials Chemistry A. 2017;5:5646–5660. doi: 10.1039/C7TA00282C
- Wedig A, Luebben M, Cho D-Y, et al. Nanoscale cation motion in TaO x, HfO x and TiO x memristive systems. Nature Nanotechnol. 2016;11:67–74. doi: 10.1038/nnano.2015.221
- McPeak KM, Jayanti SV, Kress SJ, et al. Plasmonic films can easily be better: rules and recipes. ACS Photonics. 2015;2:326–333. doi: 10.1021/ph5004237
- Piccinotti D, Gholipour B, Yao J, et al. Stoichiometric engineering of chalcogenide semiconductor alloys for nanophotonic applications. Adv Mater. 2019;31. doi: 10.1002/adma.201807083
- West PR, Ishii S, Naik GV, et al. Searching for better plasmonic materials. Laser Photonics Rev. 2010;4:795–808. doi: 10.1002/lpor.200900055
- Wooten F. Optical properties of solids. London, United Kingdom: Academic press; 2013.
- Johnson PB, Christy R-W. Optical constants of the noble metals. Phys Rev B. 1972;6:4370. doi: 10.1103/PhysRevB.6.4370
- Werner WS, Glantschnig K, Ambrosch-Draxl C. Optical constants and inelastic electron-scattering data for 17 elemental metals. J Phys Chem Ref Data. 2009;38:1013–1092. doi: 10.1063/1.3243762
- Yang Y, Sheridan P, Lu W. Complementary resistive switching in tantalum oxide-based resistive memory devices. Appl Phys Lett. 2012;100:203112. doi: 10.1063/1.4719198
- Böttger U, von Witzleben M, Havel V, et al. Picosecond multilevel resistive switching in tantalum oxide thin films. Sci Rep. 2020;10:1–9. doi: 10.1038/s41598-020-73254-2
- Kim W, Menzel S, Wouters D, et al. 3-bit multilevel switching by deep reset phenomenon in Pt/W/TaO X/Pt-ReRAM devices. IEEE Electron Device Lett. 2016;37:564–567. doi: 10.1109/LED.2016.2542879
- Schindler C, Thermadam SCP, Waser R, et al. Bipolar and unipolar resistive switching in Cu-Doped $ SiO2$. IEEE Trans Electron Devices. 2007;54:2762–2768. doi: 10.1109/TED.2007.904402
- Liu X, Sadaf SM, Park S, et al. Complementary resistive switching in niobium oxide-based resistive memory devices. IEEE Electron Device Lett. 2013;34:235–237. doi: 10.1109/LED.2012.2235816
- Rodríguez-de Marcos LV, Larruquert JI, Méndez JA, et al. Self-consistent optical constants of SiO_2 and Ta_2O_5 films. Opt Mater Express. 2016;6:3622–3637. doi: 10.1364/OME.6.003622
- Sarkar S, Gupta V, Kumar M, et al. Hybridized guided-mode resonances via colloidal plasmonic self-assembled grating. ACS Appl Mater Interfaces. 2019;11:13752–13760. doi: 10.1021/acsami.8b20535
- Perkins J, Gholipour B. Optoelectronic gas sensing platforms: from metal oxide lambda sensors to nanophotonic metamaterials. Adv Photonics Res. 2021;2:2000141. doi: 10.1002/adpr.202000141
- Perkins J, Cheng H, Craig C, et al. Color tunable, Lithography-Free Refractory Metal–oxide metacoatings with a graded refractive index profile. Nano Lett. 2023;23:2601–2606. doi: 10.1021/acs.nanolett.2c04867
- Gao L, Lemarchand F, Lequime M. Exploitation of multiple incidences spectrometric measurements for thin film reverse engineering. Opt express. 2012;20:15734–15751. doi: 10.1364/OE.20.015734
- Synowicki R, Tiwald TE. Optical properties of bulk c-ZrO2, c-MgO and a-As2S3 determined by variable angle spectroscopic ellipsometry. Thin Solid Films. 2004;455–456:248–255. doi: 10.1016/j.tsf.2004.02.028
- Liu S, Mi Y, Xue D, et al. Investigation of physical and electronic properties of GeSe for photovoltaic applications. Adv Electron Mater. 2017;3:1700141. doi: 10.1002/aelm.201700141
- Raeis-Hosseini N, Rho J. Metasurfaces based on phase-change material as a reconfigurable platform for multifunctional devices. Materials. 2017;10:1046. doi: 10.3390/ma10091046
- Gholipour B, Zhang J, MacDonald KF, et al. An all-optical, non-volatile, bidirectional, phase-change meta-switch. Adv Mater. 2013;25:3050–3054. doi: 10.1002/adma.201300588
- Raeis-Hosseini N, Lim S, Hwang H, et al. Reliable Ge2Sb2Te5-integrated high-density nanoscale conductive bridge random access memory using facile nitrogen-doping strategy. Adv Electron Mater. 2018;4:1800360. doi: 10.1002/aelm.201800360
- Khan P, Xu Y, Leon W, et al. Kinetics of photo-dissolution within Ag/As2S3 heterostructure. J Non-Crystalline Solids. 2018;500:468–474. doi: 10.1016/j.jnoncrysol.2018.09.001
- Imanishi Y, Kida S, Nakaoka T. Direct observation of Ag filament growth and unconventional SET-RESET operation in GeTe amorphous films. AIP Adv. 2016;6:075003. doi: 10.1063/1.4958633
- Kim W, Yoo C, Park E-S, et al. Electroforming-free bipolar resistive switching in GeSe thin films with a Ti-containing electrode. ACS Applied Materials Interfaces. 2019;11:38910–38920. doi: 10.1021/acsami.9b10891
- Kawaguchi T, Maruno S. Photoinduced surface deposition of metallic silver in Ag-as-S glasses. J Appl Phys. 1995;77:628–634. doi: 10.1063/1.359048
- Taylor PC. Metal-Doped Chalcogenides. World scientific reference of amorphous materials, the: structure, properties, modeling and main applications (In 3 Volumes). Vol.15. Singapore: World Scientific; 2020.
- Krasavin A, Zayats A. Photonic signal processing on electronic scales: electro-optical field-effect nanoplasmonic modulator. Physical Review Letters. 2012;109:053901. doi: 10.1103/PhysRevLett.109.053901
- Kozicki MN, Balakrishnan M, Gopalan C, et al. Programmable metallization cell memory based on Ag-Ge-S and Cu-Ge-S solid electrolytes. Symposium Non-Volatile Memory Technology; Dallas, TX, USA; 2005. p. 7–89.
- Kozicki MN, Park M, Mitkova M. Nanoscale memory elements based on solid-state electrolytes. IEEE Trans Nanotechnol. 2005;4:331–338. doi: 10.1109/TNANO.2005.846936
- Mitkova M, Kozicki M. Silver incorporation in Ge–Se glasses used in programmable metallization cell devices. J Non-Crystalline Solids. 2002;299–302:1023–1027. doi: 10.1016/S0022-3093(01)01068-7
- Wang W, Zhang B, Zhao H. (2020). Forming-free bipolar and unipolar resistive switching behaviors with low operating voltage in Ag/Ti/CeO2/Pt devices. Results Phys, 16:103001. doi: 10.1016/j.rinp.2020.103001
- Kim C-J, Yoon S-G, Choi K-J, et al. Characterization of silver-saturated Ge–Te chalcogenide thin films for nonvolatile random access memory. J Vac Sci Technol B Microelectron Nanometer Struct Process Meas Phenom. 2006;24:721–724. doi: 10.1116/1.2180260
- Kawaguchi T, Maruno S, Elliott S. Compositional dependence of the photoinduced surface deposition of metallic silver in Ag?As?S glasses. J Non-Crystalline Solids. 1997;211:187–195. doi: 10.1016/S0022-3093(96)00625-4
- Binu S, Khan P, Barik A, et al. Photoinduced formation of Ag nanoparticles on the surface of as 2 S 3 /Ag thin bilayer. Mater Res Express. 2014;1:045025. doi: 10.1088/2053-1591/1/4/045025
- Chen S-X, Chang S-P, Chang S-J, et al. Highly stable ultrathin TiO2 based resistive random access memory with low operation voltage. ECS Journal Solid State Science and Technology. 2018;7:Q3183. doi: 10.1149/2.0281807jss
- Jeong DS, Schroeder H, Breuer U, et al. Characteristic electroforming behavior in Pt/TiO 2/Pt resistive switching cells depending on atmosphere. J Appl Phys. 2008;104:123716. doi: 10.1063/1.3043879
- Long S, Lian X, Ye T, et al. Cycle-to-Cycle Intrinsic RESET Statistics in ${\rm HfO}_{2}$-Based Unipolar RRAM Devices. IEEE Electron Device Lett. 2013;34:623–625. doi: 10.1109/LED.2013.2251314
- Sarkar B, Lee B, Misra V. Understanding the gradual reset in Pt/Al2O3/Ni RRAM for synaptic applications. Semicond Sci Technol. 2015;30:105014. doi: 10.1088/0268-1242/30/10/105014
- Chen H, Zhou Y, Han S. Recent advances in metal nanoparticle-based floating gate memory. Nano Select. 2021;2:1245–1265. doi: 10.1002/nano.202000268
- Huang C-H, Huang J-S, Lai C-C, et al. Manipulated transformation of filamentary and homogeneous resistive switching on ZnO thin film memristor with controllable multistate. ACS Applied Materials Interfaces. 2013;5:6017–6023. doi: 10.1021/am4007287
- Stathopoulos S, Khiat A, Trapatseli M, et al. Multibit memory operation of metal-oxide bi-layer memristors. Sci Rep. 2017;7:1–7.
- Lee M-J, Lee CB, Lee D, et al. A fast, high-endurance and scalable non-volatile memory device made from asymmetric Ta2O5−x/TaO2−x bilayer structures. Nature Mater. 2011;10:625–630. doi: 10.1038/nmat3070
- Choi J, Kim J-S, Hwang I, et al. Different resistance switching behaviors of NiO thin films deposited on Pt and SrRuO 3 electrodes. Appl Phys Lett. 2009;95:022109. doi: 10.1063/1.3173813
- Tang MH, Jiang B, Xiao YG, et al. Top electrode-dependent resistance switching behaviors of ZnO thin films deposited on Pt/Ti/SiO2/Si substrate. Microelectron Eng. 2012;93:35–38. doi: 10.1016/j.mee.2011.12.003
- Hasan M, Dong R, Choi H, et al. Effect of ruthenium oxide electrode on the resistive switching of Nb-doped strontium titanate. Appl Phys Lett. 2008;93:052908. doi: 10.1063/1.2969052
- Peng H, Li G, Ye J, et al. Electrode dependence of resistive switching in Mn-doped ZnO: Filamentary versus interfacial mechanisms. Appl Phys Lett. 2010;96:192113. doi: 10.1063/1.3428365
- Seo JW, Park J-W, Lim KS, et al. Transparent resistive random access memory and its characteristics for nonvolatile resistive switching. Appl Phys Lett. 2008;93:223505. doi: 10.1063/1.3041643
- Kozicki MN, Dandamudi P, Barnaby HJ, et al. (Invited) programmable metallization cells in memory and switching applications. ECS Trans. 2013;58:47. doi: 10.1149/05805.0047ecst
- Linn E, Rosezin R, Kügeler C, et al. Complementary resistive switches for passive nanocrossbar memories. Nature Mater. 2010;9:403–406. doi: 10.1038/nmat2748
- Chen W, Barnaby H, Kozicki M. Volatile and non-volatile switching in Cu-SiO 2 programmable metallization cells. IEEE Electron Device Lett. 2016;37:580–583. doi: 10.1109/LED.2016.2540361
- Mahalanabis D, Gonzalez-Velo Y, Barnaby HJ, et al. Impedance measurement and characterization of Ag-ge 30 Se 70-based programmable metallization cells. IEEE Trans Electron Devices. 2014;61:3723–3730. doi: 10.1109/TED.2014.2358573
- Kozicki M, Yun M, Hilt L, et al. Applications of programmable resistance changes in metal-doped chalcogenides. Pennington NJ USA: Electrochem Soc. 1999;298:309.
- Hoessbacher C, Fedoryshyn Y, Emboras A, et al. The plasmonic memristor: a latching optical switch. Optica. 2014;1:198–202. doi: 10.1364/OPTICA.1.000198
- Emboras A, Goykhman I, Desiatov B, et al. Nanoscale plasmonic memristor with optical readout functionality. Nano Lett. 2013;13:6151–6155. doi: 10.1021/nl403486x
- Emboras A, Niegemann J, Ma P, et al. Atomic scale plasmonic switch. Nano Lett. 2016;16:709–714. doi: 10.1021/acs.nanolett.5b04537
- Emboras A, Alabastri A, Ducry F, et al. Atomic scale photodetection enabled by a memristive junction. ACS Nano. 2018;12:6706–6713. doi: 10.1021/acsnano.8b01811
- Farmakidis N, Youngblood N, Li X, et al. Plasmonic nanogap enhanced phase-change devices with dual electrical-optical functionality. Sci adv. 2019;5:eaaw2687. doi: 10.1126/sciadv.aaw2687
- Thyagarajan K, Sokhoyan R, Zornberg L, et al. Millivolt modulation of plasmonic metasurface optical response via ionic conductance. Adv Mater. 2017;29:1701044. doi: 10.1002/adma.201701044
- Zheludev NI. The road ahead for metamaterials. Science. 2010;328:582–583. doi: 10.1126/science.1186756
- Choudhury SM, Wang D, Chaudhuri K, et al. Material platforms for optical metasurfaces. Nanophotonics. 2018;7:959–987. doi: 10.1515/nanoph-2017-0130
- Chang C, Chen J, Huang C, et al. Direct observation of dual-filament switching behaviors in Ta2O5-based memristors. Small. 2017;13:1603116. doi: 10.1002/smll.201603116
- Zhu Y, Zheng K, Wu X, et al. Enhanced stability of filament-type resistive switching by interface engineering. Sci Rep. 2017;7:1–7. doi: 10.1038/srep43664
- Philip´aWong H-S. Multi-level control of conductive nano-filament evolution in HfO 2 ReRAM by pulse-train operations. Nanoscale. 2014;6:5698–5702. doi: 10.1039/C4NR00500G
- Mickel PR, Lohn AJ, Marinella MJ. Memristive switching: physical mechanisms and applications. Mod Phys Lett B. 2014;28:1430003. doi: 10.1142/S0217984914300038
- Zahoor F, Azni Zulkifli TZ, Khanday FA. Resistive random access memory (RRAM): an overview of materials, switching mechanism, performance, multilevel cell (MLC) storage, modeling, and applications. Nanoscale Research Letters. 2020;15:1–26. doi: 10.1186/s11671-020-03299-9
- Zhou F, Chang Y-F, Chen Y-C, et al. A study of the interfacial resistive switching mechanism by proton exchange reactions on the SiO x layer. Phys Chem Chem Phys. 2016;18:700–703. doi: 10.1039/C5CP06507K
- Jeong DS, Schroeder H, Waser R. Coexistence of bipolar and unipolar resistive switching behaviors in a Pt∕TiO[sub 2]∕Pt Stack. Electrochem Solid-State Lett. 2007;10:G51. doi: 10.1149/1.2742989
- Choi D, Soo Kim C. Coexistence of unipolar and bipolar resistive switching in Pt/NiO/Pt. Appl Phys Lett. 2014;104:193507. doi: 10.1063/1.4875918
- Yanagida T, Nagashima K, Oka K, et al. Scaling effect on unipolar and bipolar resistive switching of metal oxides. Scientific Reports. 2013;3:1–6. doi: 10.1038/srep01657
- Yang Y, Gao P, Li L, et al. Electrochemical dynamics of nanoscale metallic inclusions in dielectrics. Nature Communications. 2014;5:1–9. doi: 10.1038/ncomms5232
- Choi S, Park G, Kim K, et al. In situ observation of voltage-induced multilevel resistive switching in solid electrolyte memory. Adv Mater. 2011;23:3272–3277. doi: 10.1002/adma.201100507
- Yang Y, Gao P, Gaba S, et al. Observation of conducting filament growth in nanoscale resistive memories. Nat Commun. 2012;3:732. doi: 10.1038/ncomms1737
- Lu W, Jeong DS, Kozicki M, et al. Electrochemical metallization cells—blending nanoionics into nanoelectronics? MRS bulletin. MRS Bull. 2012;37:124–130. doi: 10.1557/mrs.2012.5
- Maier J. Nanoionics: ion transport and electrochemical storage in confined systems. Nature Mater. 2005;4:805–815. doi: 10.1038/nmat1513
- Douaud A, Messaddeq SH, Boily O, et al. Laser-induced dewetting of silver-doped chalcogenide glasses. Appl Surface Sci. 2018;445:1–7. doi: 10.1016/j.apsusc.2018.03.129
- Kolobov AV, Tominaga J. Chalcogenides. Berlin, Heidelberg: Springer; 2012. pp. 133–145. doi: 10.1007/978-3-642-28705-3_7
- Feinleib J, DeNeufville J, Moss SC, et al. Rapid reversible light-induced crystallization of amorphous semiconductors. Appl Phys Lett. 1971;18:254–257. doi: 10.1063/1.1653653
- Tanaka K. Light intensity dependence of photodarkening in amorphous As2S3 films. Thin Solid Films. 1988;157:35–42. doi: 10.1016/0040-6090(88)90343-4
- Hayashi K, Mitsuishi N. Thickness effect of the photodarkening in amorphous chalcogenide films. J Non-Crystalline Solids. 2002;299–302:949–952. doi: 10.1016/S0022-3093(01)01059-6
- Frumar M, Polak Z, Cˇernoˇsek Z. Photoinduced Effects in Amorphous Chalcogenides. In: Andriesh A, Bertolotti M, editors. Physics and applications of non-crystalline semiconductors in optoelectronics. Dordrecht: Springer; 1997. p. 123–139. doi: 10.1007/978-94-011-5496-3
- Goldschmidt D, Rudman P. The kinetics of photodissolution of Ag in amorphous As2S3 films. J Non-Crystalline Solids. 1976;22:229–243. doi: 10.1016/0022-3093(76)90056-9
- Elliott SR. A unified mechanism for metal photodissolution in amorphous chalcogenide materials. J Non-Crystalline Solids. 1991;130:85–97. doi: 10.1016/0022-3093(91)90159-4
- Tanaka K, Yoshida N, Yamaoka Y. Photo-induced chemical modification in Ag-as-S glasses. philosophical magazine letters. Philos Mag Lett. 1993;68:81–83. doi: 10.1080/09500839308240497
- Frumar M, Wagner T. Ag doped chalcogenide glasses and their applications. Curr Opin Solid State Mater Sci. 2003;7:117–126. doi: 10.1016/S1359-0286(03)00044-5
- Alvi M. (2013). Influence of thermal annealing on optical constants of Ag doped Ga–Se chalcogenide thinfilms. Opt Commun, 295:21–25. doi: 10.1016/j.optcom.2012.12.098
- Ren J, Yan Q, Wagner T, et al. Conductivity study on GeS2-Ga2S3-AgI-Ag chalcohalide glasses. J Appl Phys. 2013;114:023701. doi: 10.1063/1.4813139
- Aly K, Dahshan A, Yahia I. Optical constants for Ge 30− x Se 70 Ag x (0 ≤ x ≤ 30 at%) thin films based only on their reflectance spectra. Philos Mag. 2012;92:912–924. doi: 10.1080/14786435.2011.637978
- Zheng S, Kang Z, Wang C, et al. (2019). Structural and optical properties of Agx (GeSe3) 100-x films fabricated by sputtering method. Optik, 195:163152. doi: 10.1016/j.ijleo.2019.163152
- Kolobov A, Elliott S. Photodoping of amorphous chalcogenides by metals. Adv Phys. 1991;40:625–684. doi: 10.1080/00018739100101532
- Aparimita A, Sripan C, Ganesan R, et al. Photo-and thermally induced property change in Ag diffusion into Ag/As 2 Se 3 thin films. Appl Phys A. 2018;124:1–10. doi: 10.1007/s00339-018-1692-4
- Swanepoel R. Determining refractive index and thickness of thin films from wavelength measurements only. JOSA A. 1985;2:1339–1343. doi: 10.1364/JOSAA.2.001339
- Kostyshin M, Mikhailovskaia E, Romanenko P. The photographic sensitivity effect of semiconductor films deposited on metallic substrates(Photosensitivity of semiconductor thin films deposited on metallic substrates in vacuum, noting photochemical transformation and photodecomposition of substance). Fizika Tverdogo Tela. 1966;8:571.
- Sakaguchi Y, Hanashima T, Aoki H, et al. Kinetics of silver photodiffusion into amorphous Ge20S80 films: case of pre-reaction. Phys Status Solidi A. 2018;215:1800049. doi: 10.1002/pssa.201800049
- Sakaguchi Y, Asaoka H, Uozumi Y, et al. Silver photo-diffusion and photo-induced macroscopic surface deformation of Ge33S67/Ag/Si substrate. J Appl Phys. 2016;120:055103. doi: 10.1063/1.4959207
- Kawaguchi TKT, Maruno SMS. Reversible photowriting and thermal erasing of Ag patterns on Ag-rich Ag–ge–S films. Jpn J Appl Phys. 1994;33:6470. doi: 10.1143/JJAP.33.6470
- Itoh M, Yoshida N, Tanaka H, et al. Transient photoconduction and photo induced phenomenon in ion-conducting amorphous semiconductors. Journal of Non-Crystalline Solids. 1996;198–200:684–687. doi: 10.1016/0022-3093(96)00006-3
- Douaud A, Messaddeq SH, Messaddeq Y. (2019). Photo-induced birefringence and surface ripples structures in As-S-Ag chalcogenide thin-films. J Non-Crystalline Solids, 519:119446. doi: 10.1016/j.jnoncrysol.2019.05.022
- Berkes JS, Ing SW Jr, Hillegas WJ. Photodecomposition of amorphous As2Se3 and As2S3. J Appl Phys. 1971;42:4908–4916. doi: 10.1063/1.1659873
- Ogusu K, Hosokawa Y, Maeda S, et al. Photo-oxidation of As2Se3, Ag–As2Se3, and Cu–As2Se3 chalcogenide films. J Non-Crystalline Solids. 2005;351:3132–3138. doi: 10.1016/j.jnoncrysol.2005.07.034
- Correr W, Messaddeq SH, Douaud A, et al. Vibrational and conductive microscopic investigation of thermal dewetting in Ag-As-S chalcogenide thin films. Applied Surface Science. 2021;554:149621. doi: 10.1016/j.apsusc.2021.149621
- Geim AK. Graphene: status and prospects. Science. 2009;324:1530–1534. doi: 10.1126/science.1158877
- Novoselov K, Mishchenko A, Carvalho A, et al. 2D materials and van der Waals heterostructures. Science. 2016;353:aac9439. doi: 10.1126/science.aac9439
- Buscema M, Island JO, Groenendijk DJ, et al. Photocurrent generation with two-dimensional van der Waals semiconductors. Chem Soc Rev. 2015;44:3691–3718. doi: 10.1039/C5CS00106D
- Allain A, Kang J, Banerjee K, et al. Electrical contacts to two-dimensional semiconductors. Nature Mater. 2015;14:1195–1205. doi: 10.1038/nmat4452
- Won R. Ultrafast nanoprobing. Nat Photonics. 2010;4:882–882. doi: 10.1038/nphoton.2010.271
- Geim AK, Grigorieva IV. Van der Waals heterostructures. Nature. 2013;499:419–425. doi: 10.1038/nature12385
- Guo Z, Chen S, Wang Z, et al. Metal-ion-modified black phosphorus with enhanced stability and transistor performance. Adv Mater. 2017;29:1703811. doi: 10.1002/adma.201703811
- Hu H, Shi Z, Khan K, et al. Recent advances in doping engineering of black phosphorus. J Mater Chem A. 2020;8:5421–5441. doi: 10.1039/D0TA00416B
- Peruzzini M, Bini R, Bolognesi M, et al. A perspective on recent advances in phosphorene functionalization and its applications in devices. Eur J Inorg Chem. 2019;2019:1476–1494. doi: 10.1002/ejic.201801219
- Shao Y, Liu Z-L, Cheng C, et al. Epitaxial growth of flat antimonene monolayer: A new honeycomb analogue of graphene. Nano Letters. 2018;18:2133–2139. doi: 10.1021/acs.nanolett.8b00429
- Wang X, Yu X, Song J, et al. Two-dimensional semiconducting antimonene in nanophotonic applications–A review. Chemical Engineering Journal. 2021;406:126876. doi: 10.1016/j.cej.2020.126876
- Huang W, Zhu J, Wang M, et al. Emerging mono-elemental bismuth nanostructures: controlled synthesis and their versatile applications. Adv Funct Mater. 2021;31:2007584. doi: 10.1002/adfm.202007584
- Wang M, Hu Y, Zi Y, et al. Functionalized hybridization of bismuth nanostructures for highly improved nanophotonics. APL Mater. 2022;10. doi: 10.1063/5.0091341
- Huang W, Wang M, Hu L, et al. Recent advances in semiconducting monoelemental selenium nanostructures for device applications. Adv Funct Mater. 2020;30:2003301. doi: 10.1002/adfm.202003301
- Chen Z, Yang Q, Mo F, et al. Aqueous zinc–tellurium batteries with ultraflat discharge plateau and high volumetric capacity. Adv Mater. 2020;32:2001469. doi: 10.1002/adma.202001469
- Liu J, Chen C, Zhao Y. Progress and prospects of graphdiyne-based materials in biomedical applications. Adv Mater. 2019;31:1804386. doi: 10.1002/adma.201804386
- Wang M, Pu J, Hu Y, et al. Functional graphdiyne for emerging applications: recent advances and future challenges. Adv Funct Mater. 2024;34:2308601. doi: 10.1002/adfm.202308601
- Du H, Lin X, Xu Z, et al. Recent developments in black phosphorus transistors. J Mater Chem C. 2015;3:8760–8775. doi: 10.1039/C5TC01484K
- Yang Z, Wu Z, Lyu Y, et al. Centimeter-scale growth of two-dimensional layered high-mobility bismuth films by pulsed laser deposition. InfoMat. 2019;1:98–107. doi: 10.1002/inf2.12001
- Qin J, Qiu G, Jian J, et al. Controlled growth of a large-size 2D selenium nanosheet and its electronic and optoelectronic applications. ACS Nano. 2017;11:10222–10229. doi: 10.1021/acsnano.7b04786
- Zhou W, Chen J, Bai P, et al. Two-dimensional pnictogen for field-effect transistors. Research. 2019;2019. doi: 10.34133/2019/1046329
- Zhang S, Xie M, Li F, et al. Semiconducting Group 15 monolayers: a broad range of band gaps and high carrier mobilities. Angew Chem. 2016;128:1698–1701. doi: 10.1002/ange.201507568
- Xu Y, Shi Z, Shi X, et al. Recent progress in black phosphorus and black-phosphorus-analogue materials: properties, synthesis and applications. Nanoscale. 2019;11:14491–14527. doi: 10.1039/C9NR04348A
- Wang F, Lv X, Zhu X, et al. Bi nanodendrites for efficient electrocatalytic N 2 fixation to NH 3 under ambient conditions. Chem Comm. 2020;56:2107–2110. doi: 10.1039/C9CC09803H
- Ren X, Zhou J, Qi X, et al. Few-layer black phosphorus nanosheets as electrocatalysts for highly efficient oxygen evolution reaction. Adv Energy Mater. 2017;7:1700396. doi: 10.1002/aenm.201700396
- Fan K, Jia Y, Ji Y, et al. Curved surface boosts electrochemical CO2 reduction to formate via bismuth nanotubes in a wide potential window. ACS Catal. 2020;10:358–364. doi: 10.1021/acscatal.9b04516
- Lin S, Liu S, Yang Z, et al. Solution-processable ultrathin black phosphorus as an effective electron transport layer in organic photovoltaics. Adv Funct Mater. 2016;26:864–871. doi: 10.1002/adfm.201503273
- Kistanov AA, Kripalani DR, Cai Y, et al. Ultrafast diffusive cross-sheet motion of lithium through antimonene with 2 + 1 dimensional kinetics. ?J Mater Chem A. 2019;7:2901–2907. doi: 10.1039/C8TA11503F
- Chen W, Ouyang J, Yi X, et al. Black phosphorus nanosheets as a neuroprotective nanomedicine for neurodegenerative disorder therapy. Adv Mater. 2018;30:1703458. doi: 10.1002/adma.201703458
- Chaudhary S, Umar A, Mehta S. (2016). Selenium nanomaterials: an overview of recent developments in synthesis, properties and potential applications. Pro Mater Sci, 83:270–329. doi: 10.1016/j.pmatsci.2016.07.001
- Zhang T, Wan Y, Xie H, et al. Degradation chemistry and stabilization of exfoliated few-layer black phosphorus in water. J Am Chem Soc. 2018;140:7561–7567. doi: 10.1021/jacs.8b02156
- Ge Y, Chen S, Xu Y, et al. Few-layer selenium-doped black phosphorus: synthesis, nonlinear optical properties and ultrafast photonics applications. J Mater Chem C. 2017;5:6129–6135. doi: 10.1039/C7TC01267E
- Yang B, Wan B, Zhou Q, et al. Te-doped black phosphorus field-effect transistors. Adv Mater. 2016;28:9408–9415. doi: 10.1002/adma.201603723
- Grazianetti C, Martella C, Molle A. The Xenes generations: a taxonomy of epitaxial single-element 2D materials. physica status solidi (RRL)–Rapid Res Lett. 2020;14:1900439. doi: 10.1002/pssr.201900439
- Kim K-H, Gaba S, Wheeler D, et al. A functional hybrid memristor crossbar-Array/CMOS system for data storage and neuromorphic applications. Nano Lett. 2012;12:389–395. doi: 10.1021/nl203687n
- Kaeriyama S, Sakamoto T, Sunamura H, et al. A nonvolatile programmable solid-electrolyte nanometer switch. IEEE J Solid-State Circuits. 2005;40:168–176. doi: 10.1109/JSSC.2004.837244
- Borghetti J, Snider GS, Kuekes PJ, et al. ‘Memristive’ switches enable ‘stateful’ logic operations via material implication. Nature. 2010;464:873–876. doi: 10.1038/nature08940
- Balatti S, Ambrogio S, Ielmini D. Normally-off logic based on resistive switches—part I: logic gates. IEEE Trans Electron Devices. 2015;62:1831–1838. doi: 10.1109/TED.2015.2422999
- Jo SH, Chang T, Ebong I, et al. Nanoscale memristor device as synapse in neuromorphic systems. Nano Lett. 2010;10:1297–1301. doi: 10.1021/nl904092h
- Hu M, Graves CE, Li C, et al. Memristor-based analog computation and neural network classification with a dot product engine. Adv Mater. 2018;30:1705914. doi: 10.1002/adma.201705914
- Yao P, Wu H, Gao B, et al. Face classification using electronic synapses. Nature Communications. 2017;8:15199. doi: 10.1038/ncomms15199
- Mandal A, Ellis R, Gholipour B. Reconfigurable phase change chalcogenide grating couplers with ultrahigh modulation contrast. Opt Mater Express. 2024;14:1–12. doi: 10.1364/OME.502154
- Yu S, Wu X, Chen K, et al. All-optical graphene modulator based on optical Kerr phase shift. Optica. 2016;3:541–544. doi: 10.1364/OPTICA.3.000541
- Akinwande D, Huyghebaert C, Wang C-H, et al. Graphene and two-dimensional materials for silicon technology. Nature. 2019;573:507–518. doi: 10.1038/s41586-019-1573-9
- Hu Z, Wu Z, Han C, et al. Two-dimensional transition metal dichalcogenides: interface and defect engineering. Chem Soc Rev. 2018;47:3100–3128. doi: 10.1039/C8CS00024G