
Abstract
The visual dimension of cities has been a fundamental subject in urban studies since the pioneering work of late-nineteenth- to mid-twentieth-century scholars such as Camillo Sitte, Kevin Lynch, Rudolf Arnheim, and Jane Jacobs. Several decades later, big data and artificial intelligence (AI) are revolutionizing how people move, sense, and interact with cities. This article reviews the literature on the appearance and function of cities to illustrate how visual information has been used to understand them. A conceptual framework, urban visual intelligence, is introduced to systematically elaborate on how new image data sources and AI techniques are reshaping the way researchers perceive and measure cities, enabling the study of the physical environment and its interactions with the socioeconomic environment at various scales. The article argues that these new approaches would allow researchers to revisit the classic urban theories and themes and potentially help cities create environments that align with human behaviors and aspirations in today’s AI-driven and data-centric era.
自19世纪末至20世纪中期卡米洛·西特、凯文·林奇、鲁道夫·阿恩海姆和简·雅各布斯等学者开展开创性研究以来, 城市的视觉维度一直是城市研究的重要主题。几十年后, 大数据和人工智能正在彻底改变人们的活动、感知及其与城市的互动。本文回顾了城市外观和功能的文献, 以阐述如何运用视觉信息来理解城市外观和功能。引入了一个概念性框架——城市视觉智能, 系统地阐述了新的图像数据和人工智能技术如何重塑研究人员感知和度量城市的方法, 从而在不同尺度上研究自然环境及其与社会经济环境的相互作用。这些新方法使得研究人员重新审视经典的城市理论和主题, 并在人工智能驱动和数据为中心的当今时代, 帮助城市建设符合人类行为和愿望的环境。
La dimensión visual de las ciudades ha sido materia fundamental en los estudios urbanos desde el trabajo pionero de estudiosos que actuaron desde finales del siglo XIX hasta mediados del siglo XX, tales como Camillo Sitte, Kevin Lynch, Rudolf Arnheim y Jame Jacobs. Algunas décadas después, big data y la inteligencia artificial (IA) están revolucionando el modo como la gente se mueve, siente e interactúa con las ciudades. Este artículo hace una revisión de la literatura sobre el surgimiento y la función de las ciudades para ilustrar cómo la información visual ha sido utilizada para comprenderlas. Se presenta un marco conceptual, la inteligencia visual urbana, para elaborar sistemáticamente en el modo como una nueva imagen de las fuentes de datos y las técnicas de IA están reconfigurando la manera como los investigadores perciben y miden las ciudades, permitiendo el estudio del entorno físico y sus interacciones con el entorno socioeconómico a varias escalas. En el artículo se arguye que estos nuevos enfoques podrían permitir a los investigadores volver sobre las teorías y temas urbanos clásicos, y potencialmente ayudar a las ciudades a crear escenarios geográficos que se alineen con los comportamientos y aspiraciones humanos en esta era actual impulsada por la IA y centrada en los datos.
Images have played a crucial and enduring role in the study of cities, providing valuable insights into the physical environment and influencing urban design theories. This historical importance has been essential in shaping our understanding of urban spaces, their characteristics, and their impact on individuals and communities.
From the nineteenth century onward, images facilitated the aesthetic evaluation of urban spaces, allowing researchers to observe, document, and assess the design, beauty, and workings of urban settings (Freestone Citation2011). Images also played a key role in shaping and informing urban design theories that emphasized the significance of aesthetic value in urban environments and their impact on human behavior (C. Mulford Citation1899; Cullen Citation1961; Nasar Citation1990; Robinson Citation1903).
Traditionally, the use of images for studying cities relied on manual collection and careful observation and analysis. Pioneers of the field, such as Lynch (Citation1960), used firsthand observations and photographs from selected parts of a city to create perceptual maps. Whyte (Citation1980) hand-collected and manually analyzed hours of video footage to study human behavior in urban settings. Although these traditional methods provide valuable insights, they are limited in terms of scalability and feasibility over large areas or extended periods (Sampson and Raudenbush Citation1999; Clifton, Livi Smith, and Rodriguez Citation2007).
Recent advances in sensing technologies and the growing availability of geo-tagged imagery have begun to address these limitations. Social media platforms and advanced sensing technologies enable real-time image capture, vastly expanding the scope and scale of urban research (Biljecki and Ito Citation2021). The advent of powerful computer vision and machine learning algorithms has further revolutionized the analysis of these vast image data sets (Ibrahim, Haworth, and Cheng Citation2020). This transformation in data collection and analysis techniques marks a significant revival and advancement in the field of urban studies.
Despite the wealth of available visual data, there is still a challenge in distinguishing and effectively using the different characteristics of each type of visual data. Moreover, developing standardized methods to extract and interpret this information consistently remains a challenge. Although numerous studies have used visual data to analyze neighborhood appearance, the methodologies for conceptually quantifying the physical environment of urban spaces are not yet fully established. Furthermore, it is unclear how this quantification can be systematically applied to deepen our understanding of the relationship between humans and place and how it might integrate or enhance classical theories and practices.
In this article, we examine theories and recent empirical studies on the use of visual information to understand cities. We introduce a conceptual framework termed urban visual intelligence, which illustrates how the integration of images and artificial intelligence (AI) can be used to (1) observe, (2) interpret, (3) measure the physical environment of cities, and (4) discover how they interact with human behavior and the socioeconomic environment.
Historical Overview of Visual Information in Urban Studies
The tradition of incorporating visual information has been integral to modern urban studies since the early days of city planning. Historically, planners documented and measured physical environmental attributes—such as shape, proportion, rhythm, scale, complexity, color, order, elements, and hierarchy—through photographs or sketches along the streets and sidewalks (Wohlwill Citation1976). This practice of using the formal attributes of the physical environment to create a pleasing sensory experience for citizens traces back to Camilo Sitte. He advocated for interpreting cities through visual art and architecture, emphasizing the value of irregularity in urban form over rigid symmetry, and proposing aesthetic considerations as primary in city design (Sitte Citation1889).
This focus on designing the physical environment to influence citizen behavior peaked with planning utopias such as the Garden City and the City Beautiful movements. Proponents of these philosophies believe in the power of beauty, order, and cleanliness in the public realm to shape civic spirit and enhance the quality of life (Talen and Ellis Citation2002). Designers and theorists, including Frederick Law Olmsted, Sr., Phillip Mackintosh, and F. W. Fitzpatrick, recognized the aesthetic experience of urban spaces as fundamental in urban design and planning. They argued that visually pleasing cities contribute to citizens’ satisfaction, comfort, and pride (L. S. Mulford Citation1899; Wilson Citation1964; Nasar Citation1994; Ahlfeldt and Mastro Citation2012). Despite a consensus on the need for aesthetic appeal in cities, the debate about what constitutes beauty in urban spaces persists. Is beauty subjective, or can it be measured to design spaces appealing to many?
In the twentieth century, urban planners shifted focus from aesthetics to understanding the subjective experiences evoked by urban environments. This approach sought a deeper understanding of how humans visually perceive and evaluate urban scenes (Arnheim Citation1965). Researchers attempted to capture how a city’s physical environment can elicit emotions, informing our understanding of attractive and unattractive environments. For example, Nasar (Citation1998) proposed a model explaining aesthetic responses from human interaction with the surrounding environment. Similarly, Rapoport (Citation1990) identified thirty-six characteristics of aesthetically pleasing urban environments. These studies focused on the interplay between people shaping their environment and the physical environment’s impact on them. Their influence on urban studies theories and practices was limited, however, due to challenges in quantifying and representing the physical environment on a large scale.
To overcome this limitation, Lynch (Citation1960) introduced “imageability” as a criterion for quantifying and representing a place’s physical environment. This concept, developed by Lynch, shifted the focus from a purely aesthetic perspective to one emphasizing human cognition, underscoring the importance of meaning in understanding how people navigate and comprehend urban environments (Lynch Citation1984). In his seminal work, The Image of the City, Lynch proposed a framework consisting of three categories: identity (distinct visual objects), structure (recognizable patterns and relationships between objects), and meaning (emotional values and character of a place; Lynch Citation1960). Although Lynch initially concentrated on identity and structure, he acknowledged the importance of “meaning.” This aspect received less emphasis in his early analysis, however.
It was Nasar (Citation1998) who further explored the “meaning” aspect of urban environments, enriching Lynch’s framework. Nasar’s work provided a more nuanced understanding of urban spaces, emphasizing the cognitive impacts alongside physical attributes. This evolution in urban studies was also mirrored in Milgram’s (Citation1970) approach to mapping New York City. His method of measuring city recognizability through small-scale experiments, as discussed in Milgram (Citation1970), paralleled this shift toward integrating cognitive experiences with urban environments. Collectively, these advancements marked a significant evolution in the field, offering a more holistic understanding of urban spaces.
In the late twentieth century, there was a philosophical shift toward people-centered and place-based urban design. Designers and planners started prioritizing the performance, vitality, and usage of spaces as alternative measures of urban design quality (Gehl Citation1971). Scholars typically collected information on urban space utilization using simple techniques like pen and paper and photographic images. For example, William H. Whyte’s “The Street Life Project” used conversations, photographs, and video analysis to observe public space usage (Whyte Citation1980). Similarly, Gehl (Citation1971) documented elements fostering liveliness and social interaction in urban spaces in his influential book, Life Between Buildings. These studies have profoundly influenced twenty-first-century urban design practices.
These works have been pivotal in shaping urban studies and design, but it is crucial to recognize the dynamic nature of our world. The rapid changes in urban environments need a reexamination of these studies in diverse contexts and times to effectively address contemporary issues. Moreover, there is a growing concern among researchers about the limitations of these studies, particularly regarding small sample sizes and subject selection biases. Such limitations could lead to a skewed understanding of urban spaces, reflecting varying preferences across different populations and over time (Nasar Citation1998).
Framework of Urban Visual Intelligence
Cities generate an enormous amount of data through hybrid sensing techniques such as crowdsensing and ad hoc sensor deployments. With the advent of urban big data and AI-driven approaches, researchers can now analyze and quantify the physical environment, socioeconomic conditions, and human dynamics in unprecedented ways. These tools enable observation of the interaction between human behavior and the physical environment across spatial and temporal scales.
To leverage these opportunities, we propose the framework of urban visual intelligence. This framework is designed to assess and integrate current data and AI-based approaches, specifically targeting the challenges that traditional methods in urban studies have faced. At the heart of this framework is the strategic employment of AI tools for the analysis of large data sets. This approach not only offers a novel perspective but also seamlessly merges modern methodologies with both long-standing and emerging issues in urban studies, thereby transforming our understanding and analysis of urban environments.
As illustrated in , the urban visual intelligence framework proposes four levels for studying urban environments using street-level imagery: vista, scene, place, and city. Each hierarchical level addresses a different challenge: (1) observing the urban physical environment at a human scale; (2) deriving semantic information from street-level imagery; (3) quantifying the physical environment of a place; and (4) understanding the fine-grained interactions between physical and socioeconomic environments.
Figure 1. Framework of urban visual intelligence. The framework outlines key aspects related to the urban physical environment. It focuses on using visual intelligence technologies to observe, measure, and represent physical environments and explore their interactions with socioeconomic dimensions at various levels and scales.
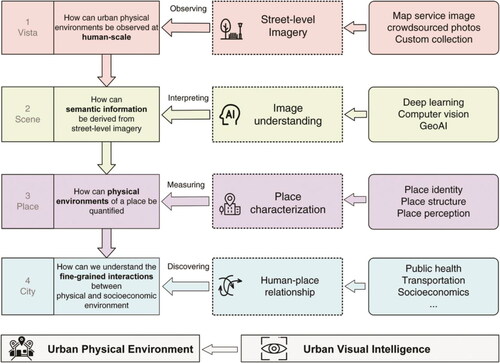
Vista. The first level emphasizes the importance of street-level imagery for observing the physical environment. It focuses on individual images or vistas, capturing the urban environment from a human perspective.
Scene. The second level builds on the vista level by applying advanced techniques, including deep learning and computer vision, to analyze semantic information derived from street-level imagery. This involves extracting details about the physical environment, such as measuring tree coverage or sky visibility in a given scene.
Place. The third level focuses on localized areas within a city, using collections of images to create comprehensive, quantitative representations of a place. This is crucial for characterizing the structure and perception of a specific area.
City. The final level extends the study to a broader scale, integrating insights from the preceding levels. It focuses on a comprehensive understanding of the interactions between the physical environment of places and broader human dynamics and socioeconomic characteristics.
The framework starts with the focused observation of individual images (vistas), progresses to understanding scenes, delves into a detailed analysis of specific areas or places within a city, and finally expands to encompass the city as a whole. This structure ensures a comprehensive understanding of urban environments at various scales, from the most detailed to the most expansive.
Observing the Urban Physical Environment at a Human Scale
Street-level imagery, as highlighted in the first level of the urban visual intelligence framework, is increasingly becoming an important data source for studying cities. With the rapid adoption of mobile Internet technologies and the growing use of Web mapping services and crowdsourcing platforms, geo-tagged images are being produced at an unprecedented rate, covering every corner of cities (Goodchild Citation2007). This data source, with its extensive spatial coverage, has become invaluable for observing large-scale urban environments (Ibrahim, Haworth, and Cheng Citation2020; Biljecki and Ito Citation2021; Duarte and Ratti Citation2021; Liang, Zhao, and Biljecki Citation2023). In 2023, the Camera and Imaging Products Association reported that 1.72 trillion photos were taken using digital cameras on mobile phones.Footnote1
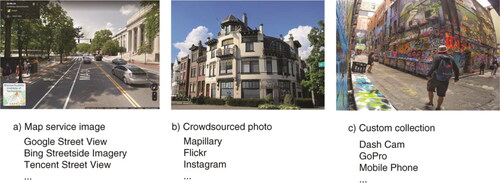
illustrates three primary sources of street-level imagery for city analysis. The first category includes map service images, such as those from Google Street View, which offer stable update frequency, broad coverage (spanning more than 200 countries), and uniform standards, enabling comparative analysis across locations (Anguelov et al. Citation2010; Goel et al. Citation2018). The second category consists of crowdsourced photos from platforms like Flickr and Mapillary, a form of volunteered geographic information (VGI; Goodchild Citation2007). As the volume of crowdsourced photos increases, it is anticipated to overtake map services as the primary source of street-level imagery due to its denser spatiotemporal coverage. The third category features custom image collections captured by individuals or researchers for specific studies. These custom collections, which can include a time series of images, are valuable for tracking changes in the physical environment and individual activities, complementing mapping services and crowdsourced imagery.
Figure 2. Sources of street-level imagery.
Compared to traditional urban study data sources, street-level imagery offers several advantages, including easy accessibility, extensive spatiotemporal coverage, and objective, standardized views from embedded vantage points (Rzotkiewicz et al. Citation2018; Ibrahim, Haworth, and Cheng Citation2020; Biljecki and Ito Citation2021). Additionally, street view imagery provides a distinct perspective compared to satellite imagery. Whereas satellite imagery presents an aerial view, street view imagery captures a human-level perspective, more closely aligned with people’s experiences and perceptions of cities. This perspective is particularly useful for examining visual cues at the human scale, offering valuable insights for urban planning and design. The recent standardization of images across cities and the advancement of visual analytic methodologies have further enhanced the utility of street-level imagery.
Street-level imagery has become one of the most valuable data sources for studying physical environments (Cinnamon and Jahiu Citation2021; N. He and Li Citation2021). Its applications extend across various research fields, including physical environment auditing (L. Zhang et al. Citation2020; S. Chen and Biljecki Citation2023; T. Zhao et al. Citation2023), public health (Nguyen et al. Citation2018; H. He et al. Citation2020; Keralis et al. Citation2020), urban mobility and transportation (Lu et al. Citation2019; Hong, McArthur, and Raturi Citation2020; Mooney et al. Citation2020), energy estimation (Z. Liu et al. Citation2019; Sun, Han, et al. Citation2022; K. Zhang et al. Citation2022), and real estate (Law, Paige, and Russell Citation2019; E. B. Johnson, Tidwell, and Villupuram Citation2020; Kang, Zhang, Peng, et al. Citation2020), among others.
Deriving Semantic Information from Street-Level Imagery
How can semantic information be derived from street-level imagery in a scene? The second level of the urban visual intelligence framework focuses on using deep learning and computer vision techniques to interpret semantic information from street-level imagery.
Deep Learning and Computer Vision.Traditionally, field surveys have relied on manual visual data analysis, a time-consuming and labor-intensive process that limits the scope of research. Although image processing techniques have been developed for mass analysis, they have predominantly focused on basic features such as color and texture, not complex information like objects and styles. Understanding high-level information is essential in linking a city’s appearance to human behavior.
Recent advancements in deep learning and computer vision have enabled the extraction of high-level features like semantic objects and scene understanding from images, overcoming traditional image processing limitations. Deep neural networks have empowered models with learning capabilities, interpretation, and decision-making akin to the human brain. The influence of deep learning spans various domains, including speech recognition (e.g., Wav2Vec; Baevski et al. Citation2020), natural language understanding (e.g., generative pre-trained transformer [GPT] models; Brown et al. Citation2020), strategic game playing (e.g., AlphaGo; Silver et al. Citation2016), and sophisticated image recognition and segmentation tasks (Radford et al. Citation2021).
A significant area of improvement is image segmentation, where models now delineate and classify different parts of an image with remarkable accuracy, crucial for autonomous driving (Kirillov et al. Citation2023). Additionally, large language models (LLMs) like ChatGPT have broadened natural language processing capabilities (Radford et al. Citation2021), enabling more intuitive, human-like AI interactions. These LLMs can generate coherent text, perform complex language tasks, and engage in meaningful conversations, showcasing deep learning’s potential in understanding both visual and textual content.
Geospatial Artificial Intelligence. Leveraging the progress in AI, geospatial artificial intelligence (GeoAI) technologies enrich classical methods by integrating spatial effects, focusing on factors such as spatial dependency, distance decay, and scale effects (Gao, Hu, and Li Citation2024; Zhu et al. Citation2020). Such integration shifts the focus from viewing samples in isolation to understanding their complex interrelations within a spatial context (Zhu et al. Citation2020). GeoAI integrates these spatial dimensions into analytical models, enhancing the capacity to interpret and predict geographic phenomena (Mai et al. Citation2023). By accounting for the spatial arrangement of objects and their interactions, it provides a more holistic understanding of urban environments. This spatial awareness is crucial when studying cities, where the arrangement of buildings, roads, and public spaces significantly affects human behavior and environmental dynamics.
Large-Scale Image Data Sets. Large-scale image data sets play a crucial role in deep learning, offering vast, labeled images to help models comprehend complex input–label relationships. A prime data set should cover a wide range of categories with extensive variety and depth, providing numerous images per category to capture its diversity (B. Zhou, Lapedriza, et al. Citation2017).
Creating a training set involves manual annotations, data association, and data generation. Manual annotation, streamlined by online platforms like LabelMe and Amazon Mechanical Turk, requires labeling images or marking object outlines (Russell et al. Citation2008; Sorokin and Forsyth Citation2008). Emerging AI-assisted labeling methods are simplifying this process (L. Chen et al. Citation2020). Data association connects images with labels based on patterns like occurrence or location. For example, house photos from real estate sites can be correlated with prices. In situations where direct label matching is not feasible, an alternative approach involves extracting information directly from the images. This method is particularly useful in tasks such as analyzing street scenes to identify font types on signage (Ma et al. Citation2019).
Key urban image data sets in urban studies and geospatial analytics include Places2 (B. Zhou, Lapedriza, et al. Citation2017) and ADE20K (B. Zhou, Zhao, et al. Citation2017). The Places2 data set, with approximately 10 million labeled images, represents various place types like residential neighborhoods, highways, and parks, aiding deep learning models in classifying scene types from street view images. The ADE20K data set, containing more than 20,000 labeled images, covers a diverse range of visual object categories such as plants, sky, vehicles, and buildings. Researchers are also compiling additional data sources to link images with ground-truth data for specific applications, like describing scene attributes (G. Patterson and Hays Citation2012), classifying architectural styles (Xu et al. Citation2014; Sun, Han, et al. Citation2022), tracking neighborhood change (Naik et al. Citation2017), and detecting informal settlements (Ibrahim, Haworth, and Cheng Citation2021).
In the era of large-scale models, the sheer volume of data required for training presents a challenge for manual image annotation. An emerging solution for large-scale visual tasks is leveraging LLMs to acquire knowledge, followed by applying multimodal transfer to adapt this knowledge to the visual domain, thus facilitating the execution of visual tasks.
Computer Vision Tasks for Urban Image Inference. The availability of large-scale image data sets has enabled the development of complex computer vision tasks with greater depth. In urban contexts, these models are employed for scene classification, object detection, and semantic segmentation, each differentiated by their final model layers, as illustrated in . Scene classification () assigns a label to the overall image, using architectures like ResNet (K. He et al. Citation2016), GoogLeNet (Szegedy et al. Citation2015), DenseNet (G. Huang et al. Citation2017), and the Vision-Transformer series (Z. Liu et al. Citation2021). Object detection () identifies and classifies objects, marking their positions with bounding boxes, using models such as Faster R-CNN (Ren et al. Citation2015), SSD (W. Liu et al. Citation2016), and the YOLO series (Ge et al. Citation2021). Semantic segmentation () divides the image into segments, creating pixel-level masks for each object, employing PSPNet (H. Zhao et al. Citation2017), Mask RCNN (K. He et al. Citation2017), HRNet (J. Wang et al. Citation2020), and the Deeplab series (L.-C. Chen et al. Citation2018).
Figure 3. Three typical computer vision tasks in urban applications: (A) scene classification, (B) object detection, and (C) semantic segmentation.
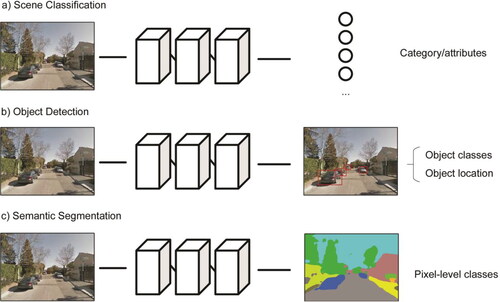
Scene Analysis and Understanding. Extracting elements from a scene is a common method used in analyzing physical environments. This analysis can be achieved through object detection or semantic segmentation. Object detection models provide details about detected objects along with their bounding boxes, facilitating the counting of different objects within an image. Conversely, semantic segmentation models predict the categories of objects for each pixel, allowing for the calculation of object proportions within a scene. Both types of models offer quantitative methods for scene measurement.
A notable example of semantic segmentation is the Treepedia project,Footnote2 which uses Google Street View to map tree canopies. This method offers a scalable alternative to manual surveys across thirty global cities (Seiferling et al. Citation2017). Other studies have integrated green canopy measurements with satellite imagery-derived green indexes to analyze how perceptions of the physical environment are influenced by different camera angles (R. Wang, Helbich, et al. Citation2019; Laumer et al. Citation2020; Biljecki et al. Citation2023).
Deep learning models have also been used to classify various street elements, including the sky, road, buildings, vegetation, vehicles, and pedestrians (F. Zhang, Zhang, et al. Citation2018; B. Zhou et al. Citation2019). High-quality imagery can be used to classify intricate aspects such as street signs, abandoned houses, sidewalk cracks, broken windows, and deteriorating walls (Less et al. Citation2015; Zou and Wang Citation2021). For example, Miranda et al. (Citation2021) used Google Street View to assess urban features attractive to pedestrians in Boston, quantifying elements like urban furniture, sidewalk dimensions, facade complexity, and visual enclosure.Footnote3 These metrics aid urbanists in identifying pedestrian-friendly environments (Zünd and Bettencourt Citation2021).
Computer vision also extends to image classification. Using 10 million social media photos and semantic labels, B. Zhou, Lapedriza, et al. (Citation2017) developed a model to classify place types (e.g., neighborhoods or bus stations) and attributes (e.g., man-made or sunny), setting a standard for understanding place functionality (Xiao, Fang, and Lin Citation2020; Ye et al. Citation2020). Similarly, Hu et al. (Citation2020) demonstrated that deep learning could classify street canyons from Google Street View images, eliminating the need for manual measurement and streamlining environmental analysis.
Scene inference models are capable of extracting nonvisible details like crime rates (Khosla et al. Citation2014), property values (Law, Paige, and Russell Citation2019), and changes in human activity (F. Zhang, Wu, et al. Citation2019). For instance, a model by Khosla et al. (Citation2014) predicts unseen aspects of a scene, such as proximity to grocery stores or hospitals. The models are trained using an end-to-end learning process, where a single model directly maps inputs to outputs without intermediate steps or feature engineering. This process allows the model to autonomously learn the complex relationships between the initial input image and the final output labels, such as crime rates and housing prices, based on a nonlinear correlation between built environments and socioeconomic factors.
Quantifying the Physical Environment of a Place
The term place encompasses a broad spectrum of elements, ranging from individual cognition to perceptual dimensions. In this study, we focus on the aspects of a place’s physical environment. We define the physical environment of a place as the aggregate of all visible natural and built elements within an urban landscape. This includes natural features such as trees, water bodies, and parks, as well as built structures like buildings, roads, and bridges. Dynamic elements such as human activity and vehicular movement are also integral to this definition, contributing to the character and functionality of urban spaces.
Quantifying the physical environment of a place poses challenges due to its complexity and inherent subjectivity. Although AI has been instrumental in objectively evaluating a place’s visual aspects, there remains a gap between algorithmic measurements and the human-centric essence of places (Tuan Citation1979). Recent research has, however, made strides in modeling various dimensions of a place, including human activities, cognitive regions, and semantics (Gao et al. Citation2017; Purves, Winter, and Kuhn Citation2019). This has resulted in the development of formal computational representations of a place, essential for interdisciplinary research (Janowicz et al. Citation2022).
In this context, our focus is on the quantitative analysis and representation of a place’s physical environment. We explore this through three perspectives: place identity, place structure, and place perception. These dimensions play are pivotal in determining a place’s “imageability,” a concept crucial in geography and urban planning (Lynch Citation1960; Morison Citation2002; M. E. Patterson and Williams Citation2005). Our aim is to shed new light on classic theories, such as those of Lynch, by incorporating recent AI and big-data-driven urban studies.
Place Identity. We use place identity to denote a place’s unique or common attributes, distinct from the psychological construct of place identity (Lewicka Citation2008). This focuses on aspects of “imageability” in urban spaces as proposed by Lynch (Citation1960).
Assessing the identity of a place is important to understand how people interact with their surroundings. Visual identity, representing a place’s unique or common attributes, plays a key role in its recognition. Traditionally, measuring place identity and similarity relied on subjective, qualitative insights, which lacked uniformity and scalability. AI, however, has revolutionized this process through representation learning (RL), a data-driven, quantitative approach. RL allows machines to autonomously identify essential features of a place, often encoded in numerical vectors.
For example, in RL, visual identity and similarity can be assessed using a classification task handled by a computer vision model. The model learns to recognize unique features of street-level images and classify the origin of the place. The misclassification rate essentially indicates similarity between places, with high misclassification suggesting similarity and high accuracy indicating distinctiveness. Confidence scores produced by the model for each image help rank the most representative scenes of a place. Higher scores reflect greater certainty and a more robust representation of place identity.
Several studies have used this approach to measure place identity and similarity. For instance, Doersch et al. (Citation2012) used an automated approach to identify the unique architectural features of cities. F. Zhang, Zhou, et al. (Citation2019) trained a deep learning model to recognize places among eighteen cities globally, measuring the visual similarity and distinctiveness of these cities and identifying unique visual cues. For indoor spaces, F. Zhang et al. (Citation2016) analyzed corridors and spaces in large interconnected buildings on the MIT campus to understand visual elements of indoor design and human cognition.
This method has also proven useful in routing, as shown by Z. Wang et al. (Citation2019), who evaluated the legibility of two train stations in Paris using a computer vision model. Furthermore, L. Liu et al. (Citation2016) used 2 million geotagged photos of twenty-six cities to reproduce the Image of the City, demonstrating how digital techniques can enhance our understanding of places across cities. Other studies have extended this digital approach to many other cities in recent years (Salesses, Schechtner, and Hidalgo Citation2013; Filomena, Verstegen, and Manley Citation2019; Y. Huang et al. Citation2023).
Place Structure. Place structure, as conceptualized by Lynch (Citation1960) in The Image of the City, refers to the physical layout and organization of urban spaces, which is crucial in shaping how people perceive and remember their environment. This concept includes identifying and understanding key elements such as paths, edges, districts, nodes, and landmarks, forming a coherent and memorable image of the city (Lynch Citation1960).
Recent advancements, as highlighted in works by G. Patterson and Hays (Citation2012) and F. Zhang, Zhang, et al. (Citation2018), offer complementary perspectives on organizing scene elements into hierarchical categories. For instance, F. Zhang, Zhang, et al. (Citation2018) categorized common urban objects into a hierarchical tree based on conceptual relationships, grouping “tree,” “flower,” and “grass” under “vegetation.” This, along with categories like “waterbody” and “sky,” forms a “natural” supercategory. This structure allows for qualitative and quantitative analysis of a place’s “structure” through element presence and abundance measured using a deep learning model.
Place Perception. Understanding how humans perceive their surrounding environment is crucial for assessing urban design quality. This topic, central to disciplines like human geography, urban planning, and environmental psychology, has been enriched by the use of street-level imagery and deep learning techniques (Lynch Citation1960; Tuan Citation1977; Nasar and Jones Citation1997). These technologies have opened new avenues for quantifying human perception, particularly through crowdsourced information, which allows for the analysis of preferences and perceptions on a massive scale. A prominent example is the Place Pulse platform, which collects online ratings to assess human perception (Salesses, Schechtner, and Hidalgo Citation2013). This platform has collected more than 1 million ratings on various aspects of Google Street Views from 80,000 volunteers across fifty-six cities in twenty-eight countries, surpassing the scope of traditional survey methods.
Platforms like Place Pulse have facilitated research on how humans visually evaluate their environments (Ordonez and Berg Citation2014; Dubey et al. Citation2016). Such studies revisit and extend classic urban theories about the relationship between the physical environment and human perceptions, which were previously constrained by the limited scale of sample sizes and geography. For example, F. Zhang, Zhou, et al. (Citation2018) explored the impact of street features on human perceptions in Beijing and Shanghai by analyzing 1 million street views through image segmentation. Their work evaluated the effects of physical disorder, such as litter, graffiti, and building conditions, on people’s feelings, providing a method to measure the “sense of place” in expansive urban areas. Similarly, Saiz, Salazar, and Bernard (Citation2018) harnessed the widespread sharing of photographs online to gauge how people value the aesthetic aspects of their environment. They demonstrated that street-level imagery could be a scalable tool for measuring subjective attractiveness, enhancing our comprehension of how individuals perceive urban spaces.
Moreover, researchers have used human perceptions derived from deep learning to assess the social and economic dynamics of cities. Studies have leveraged street-level imagery from Google Street View to measure changes in the physical appearance of neighborhoods. Naik et al. (Citation2017) connected changes in the physical appearance of five U.S. cities with economic and demographic data to document the underlying factors that predict neighborhood improvement. Additionally, F. Zhang et al. (Citation2020) characterized places by their physical appearance and popularity, uncovering many inconspicuous yet frequented restaurants in Beijing. These establishments, often situated in less visually appealing alleyways of old neighborhoods, are popular social areas, highlighting the complex relationship between appearance and social activity in urban settings.
Understanding the Fine-Grained Interactions Between Physical and Socioeconomic Environments
Exploring the interplay between the physical environment and the socioeconomic context is crucial for a variety of disciplines. This fourth level of the urban visual intelligence framework focuses on studying these interactions in detail. It underscores fields such as public health, transportation, and urban economics. These are not the only domains explored using visual information, but they represent significant areas where the framework’s applications are particularly innovative.
Public Health. Environmental health studies have traditionally relied on field surveys and questionnaires to gather data about the physical environment (Takano, Nakamura, and Watanabe Citation2002; Lawlor et al. Citation2003; Gullón et al. Citation2015). Although useful, these methods often face limitations in cross-place comparisons and capturing a human perspective. Street-level imagery and visual intelligence offer a complementary view, enhancing these established methods.
The physical environment significantly affects health outcomes, encompassing both physical aspects such as obesity and psychological factors like mental health (Mehrabian and Russell Citation1974; Ulrich Citation1984; Lee et al. Citation2012). Street-level imagery has been instrumental in quantifying visual elements associated with health, such as green spaces, sidewalks, and urban infrastructure, alongside food advertisements and indicators of physical disorder (J. Chen et al. Citation2023). For instance, the presence of greenery has been linked to active behaviors like walking and cycling, its effects on children’s body weight, mental well-being, soundscapes, and perceived safety (James et al. Citation2015; X. Li, Zhang, and Li Citation2015; Lu, Sarkar, and Xiao Citation2018; Svoray et al. Citation2018; Kang et al. Citation2019; Lu et al. Citation2019; Kruse et al. Citation2021; J. Huang et al. Citation2023; T. Zhao et al. Citation2023). Comparisons between greenery metrics from street view and remote sensing imagery have highlighted the unique advantage of street-level perspectives in capturing the eye-level greenery experience (Villeneuve et al. Citation2018; Helbich et al. Citation2019; Larkin and Hystad Citation2019; Lu et al. Citation2019; Kang, Zhang, Gao, et al. Citation2020).
Empirical studies have also uncovered correlations between visual aspects derived from street imagery and health outcomes. Streets with visual enclosure have been associated with higher quality environments, and the presence of pedestrian infrastructure like sidewalks and crosswalks correlates with increased walkability and enhanced mental health (Vargo, Stone, and Glanz Citation2012; Yin and Wang Citation2016; Nguyen et al. Citation2018; R. Wang, Lu, et al. Citation2019). Features such as food and beverage advertisements have been used to identify environments conducive to obesity (Feuillet et al. Citation2016; Roda et al. Citation2016; Egli et al. Citation2019), and other visual cues have served as proxies for various health-related metrics.
Transportation and Mobility. Street-level imagery serves as a valuable asset for comprehending the transportation context and its implications, informed by physical environmental features. These features facilitate virtual audits, aiding the identification of traffic hot spots and potential congestion areas (Qin et al. Citation2020; Tanprasert et al. Citation2020). This subsection concentrates on how attributes of roads and their surroundings extracted from street imagery inform transportation behavior.
Research using image-derived features has investigated transportation patterns. Characteristics such as traffic lights, speed bump density, and pedestrian crossings have been related to traffic volumes and route preferences (Verhoeven et al. Citation2018; den Braver et al. Citation2020). Additionally, attributes like the presence and condition of bicycle lanes, sidewalks, and road surfaces have been analyzed in relation to pedestrian safety incidents (N. S. Johnson and Gabler Citation2015; Isola et al. Citation2019; Kwon and Cho Citation2020; Mooney et al. Citation2020).
Deep learning models offer a nuanced approach to studying the connections between the physical environment and urban mobility. The visual appearance captured in images can reveal insights into function and land use (Y. Liu et al. Citation2012; Yuan, Zheng, and Xie Citation2012; Fan, Zhang, and Loo Citation2022). These models, through end-to-end training, can discern nonlinear associations between environmental aspects and movement patterns. For instance, F. Zhang, Wu, et al. (Citation2019) inferred hourly human activity levels from street view images, effectively predicting urban mobility fluctuations. Other studies have predicted spatial trends in cycling and walking through points of interest and street imagery (L. Chen et al. Citation2020; Hankey et al. Citation2021).
Computer vision and deep learning are promising avenues for researchers aiming to design physical environments that influence urban navigation. Mirowski et al. (Citation2018), for example, applied deep reinforcement learning to enable agents to navigate cities solely based on street view images. This research demonstrates the potential of visual cues in the physical environment to aid individuals in navigating the city.
Additionally, Salazar-Miranda et al. (Citation2023) presented a framework for real-time analysis of street activities using computer vision to classify pedestrian behaviors and transportation modes. This study leverages camera-equipped buses in Paris to capture diverse street activities, assisting in city planning and testing safety interventions.
Urban Economics. The physical appearance of a city offers insights into its socioeconomic fabric. Advances in street-level imagery and deep learning have led to a surge in studies characterizing the physical environment’s nuanced relationship with social and economic outcomes like income, housing prices, and crime (Ibrahim, Haworth, and Cheng Citation2020; Fan et al. Citation2023).
Crime is a prominent socioeconomic dimension that has been extensively studied using street-level imagery and deep learning techniques (H. Zhou et al. Citation2021). Research has sought to align community safety perceptions with actual crime statistics. F. Zhang et al. (Citation2021) introduced a “perception bias” metric to measure the discrepancy between perceived safety from Google Street View images and actual violent crime rates while also considering socioeconomic influences. Kang et al. (Citation2023) expanded this measure by surveying residents’ sense of safety in their neighborhoods.
The visual quality of neighborhoods has proven to be an effective predictor of real estate values and housing appreciation (Kang et al. Citation2021; Yang et al. Citation2021; Qiu et al. Citation2022). Elements captured in images, such as vehicle types, can predict demographics and political leanings (Gebru et al. Citation2017), and business amenity typefaces can be proxies for neighborhood income (Ma et al. Citation2019). Time-sequenced street view images allowed Naik et al. (Citation2017) to track urban changes, linking infrastructure improvements to educational and density metrics, with better looking neighborhoods showing more substantial progress.
Computer vision models trained on street-level imagery can predict socioeconomic characteristics, capturing the intricate interplay between the physical environment and socioeconomic factors. Such models have been applied to study job–housing patterns, social and environmental inequities, and urban deprivation (Suel et al. Citation2019; Suel et al. Citation2021; Yao et al. Citation2021). A comprehensive study by Fan et al. (Citation2023) used a computer vision model on 27 million street view images from U.S. counties, proving that visual features can precisely estimate neighborhood socioeconomic profiles. These estimations, which provide more explanatory power than traditional demographics or point of interest data, have shown consistency across different regions, confirming their reliability and wide applicability in diverse urban settings.
Discussion
Urban Visual Intelligence: Navigating the Edges of Sight and Insight
Although our proposed framework aims to address several fundamental issues, the adoption of the new data sources and methods introduces its own set of emerging challenges. Visual data alone might not fully encapsulate the complexity of urban life (Batty Citation2021). The following subsections discuss the challenges in this process, from the detailed analysis within single locations to the application of findings across diverse urban contexts, and the need to consider subjective interpretations and cultural aspects in the analyses.
Challenges in Within-Place and Between-Place Inference. In urban analysis, within-place inference is the process of extracting and interpreting information from images to understand various aspects of a specific place (Batty Citation2021). Traditional modeling approaches often struggle to capture the complex, nonlinear relationships inherent in a place. In contrast, deep learning and computer vision models excel in these environments, offering nonlinear modeling capabilities.
Conversely, between-place inference concerns the applicability of a model trained in one place and applied to another. This type of inference questions the adaptability and transferability of trained models across different urban settings, presenting a multifaceted challenge involving the heterogeneity of place, cross-domain generalizability, and spatial variability. From the perspective of human geography, the heterogeneous nature of place and varying cultural perceptions can significantly affect model performance. For example, a model trained on visual appearance from Asian countries might underperform in Western settings, owing to differences in urban design and human activity patterns (F. Zhang, Wu, et al. Citation2019). In GIScience, the challenge of between-place inference is compounded by spatial heterogeneity and nonstationarity. Such spatial variability often limits the ability of models to make consistent predictions across different locations (Goodchild et al. Citation2020; Goodchild and Li Citation2021; Kedron et al. Citation2021; W. Li, Hsu, and Hu Citation2021). Furthermore, in computer science, ensuring that a model’s performance is consistent across different domains involves addressing the domain shift challenge. Domain shift refers to the discrepancies in data distribution when a model, trained in one context, is applied to data from another context (Quiñonero-Candela et al. Citation2009; Neyshabur et al. Citation2017; M. Wang and Deng Citation2018). Such discrepancies can lead to reduced model accuracy because the patterns recognized in the training data might not be present or might manifest differently in the new data set.
These factors underline the importance of developing models that can adapt to new, varied data distributions to maintain their efficacy in diverse applications.
Challenges in Interpreting the Subjective and Culturally Significant Aspects of Place. The essence of a place transcends its physical attributes to include cultural significance and subjective interpretation, which together cultivate a unique cultural landscape. This is manifested in the varied experiences one might have when comparing visits to the Eiffel Tower in Paris with its replicas, or in the differing cultural narratives attached to architecturally similar rows of brick houses in Edinburgh and Boston.
Such uniqueness of place aligns with the principles of nomothetic geography and idiographic science (Warntz Citation1989), emphasizing the singularity of each location. This perspective challenges the generalizing nature of deep learning models, which typically infer broad rules from specific instances. Consequently, AI models often encounter difficulties in capturing the full scope of complex cultural landscapes through visual data alone.
Moreover, perceptions of place are deeply personal, shaped by an individual’s experiences, life stages, and preferences, contributing to a distinctive “sense of place” (Tuan Citation1977). The Temple Mount in Jerusalem, for instance, embodies various religious significances for different groups, illustrating subjective interpretation. Additionally, the practice of spatial ethnography, such as the examination of “time-sharing” within busy sidewalk environments (Kim Citation2015), illustrates how a place’s meaning can shift with time. A deep learning model might count the number of people on a sidewalk, but it cannot grasp the subtle variations in how these spaces are perceived and used by different demographic groups throughout the day or year.
Addressing these interpretative challenges requires innovative methods that integrate personal experiences, cultural context, and subjective perception. LLMs offer a promising solution. Trained on extensive textual data, LLMs acquire a broad understanding of cultural nuances and can tailor outputs based on individual input. This ability to apply knowledge from linguistic contexts to visual data interpretation promises to deepen AI models’ grasp of complex cultural landscapes, leading to richer and more nuanced decision-making.
Challenges in Analyzing Uncertainty in Street-Level Imagery. Street-level imagery is subject to various uncertainties that can affect the accuracy of the results (Biljecki et al. Citation2023). These uncertainties range from the modifiable areal unit problem (MAUP) and ecological fallacy to measurement issues and temporal changes.
The MAUP arises during the aggregation of point-based measurements into larger spatial units (Fotheringham and Wong Citation1991). In the context of street-level imagery, this issue is prevalent due to the nonuniform distribution of images, often constrained by road networks and the geographic spread of social media contributions. As a result, the aggregation process might obscure the true diversity of an area by presenting a misleadingly uniform characteristic along a street.
Another known challenge is the ecological fallacy, which occurs when aggregated data conclusions are applied to individual elements. For example, deducing that every segment of a street is equally aesthetically pleasing based on its overall high beauty rating ignores the potential for significant variations among individual segments.
Whereas ecological fallacy highlights errors in overgeneralizing group data to individuals, measurement uncertainty presents a different challenge that affects the scale at which urban features are perceived. This type of uncertainty arises from the variability in camera angles and distances in street-level imagery, which can alter the apparent proportions of visual elements, leading to potential misinterpretations in subsequent computer vision analyses. For example, images that capture only the lower sections of tall buildings fail to convey their full architectural context, resulting in a partial and potentially misleading representation.
Temporal changes introduce yet another layer of complexity. Just as measurement uncertainty can skew the perception of static images, the dynamic nature of urban environments means that features such as vegetation and pedestrian activity can vary widely over time. Most existing studies rely on data sets like Google Street View, which are updated infrequently, thus limiting the ability to analyze changes that occur over shorter periods. The advent of more granular and frequently updated data sources, like LiDAR point clouds and platforms such as Mapillary, is beginning to provide researchers with the tools needed for a more detailed and current exploration of urban spaces (Miranda et al. Citation2022).
Promising Avenues of Inquiry and Future Work
The integration of street-level imagery with deep learning presents exciting opportunities for urban studies. This section outlines potential research directions.
Discovering Hidden Visual Cues. Street-level imagery is rich in visual cues that offer insights into urban life. It captures elements such as written language in street names, business signs, and advertisements, which help identify points of interest and indicate linguistic or ethnic compositions. These images can also reveal subtle indicators of social disorder and psychosocial stress, such as the presence of graffiti, litter, and broken windows, which have been linked to neighborhood social disorder (Sampson and Raudenbush Citation2004).
Integrating Visual with Multimodal Information. Recent advances in LLMs have significantly improved AI’s capacity for understanding and organizing knowledge. Initially focused on text, these models are expanding to include visual and other modalities. For example, integrating visual information with text, sound, location, and other multimodal data can enhance AI’s understanding of urban environments. This integration allows AI systems to draw deeper connections between visual aspects and the broader cultural, social, and geographical contexts of cities, leading to more informed urban analysis and decision-making.
AI-Driven Generation of Urban Scenes. AI techniques in scene generation, such as variational autoencoders (VAEs), generative adversarial networks (GANs), and diffusion models, offer exciting possibilities for creating new urban environments. These models can generate realistic urban scenes based on both objective features and subjective perceptions, such as attractiveness and safety (Bau et al. Citation2020). Practical applications include urban design, scenario planning, and conceptualizing future cities (B. Zhao et al. Citation2021; Wu and Biljecki Citation2022). A notable example is a platform that allows users to create custom street scenes, integrating elements like land use and building density (Noyman and Larson Citation2020).
Development of Interpretable and Reliable AI Models. Developing interpretable and reliable AI models is crucial for urban studies. Such models can enhance scientific research by providing better predictions of human activities and socioeconomic profiles. For practitioners and policymakers, these models can identify confounding factors in causal analysis, aiding in the formulation of more informed policies. The interpretability of these models is essential for understanding and applying their findings in practical urban planning contexts.
Understanding the Hidden Laws of Cities. Investigating the fine-grained characteristics of urban environments through street-level imagery could shed light on spatial laws governing cities. Research could explore the existence of a fundamental spatial unit in urban spaces, examining how the computational representation of physical features varies with spatial scales. Understanding these patterns might reveal a consistent spatial scale that effectively represents the physical aspects of urban environments.
Conclusion
This article examined the role of AI and visual data in urban studies, highlighting their impact on enhancing the analysis of urban environments. The integration of these technologies facilitates a more detailed understanding of urban dynamics, both physical and socioeconomic, thus contributing to the evolution of urban theory and practice. The urban visual intelligence framework introduced serves as a conceptual model for guiding research in this domain. It advocates for the analysis of urban spaces through a lens that incorporates technological advancements in AI and visual data analysis, also drawing on established urban theories.
The overview of current work underscores the potential of AI to augment traditional urban analysis methods, enabling a deeper and more granular examination of urban phenomena. It also identifies challenges, though, particularly in ensuring that the interpretation of data adequately reflects the cultural and subjective nuances of urban life.
Looking ahead, the successful application of urban visual intelligence will depend on its ability to harmonize detailed, data-driven analysis with an understanding of the qualitative, human aspects of urban spaces. This approach promises to broaden the scope and depth of urban studies, offering insights that are both technically robust and contextually rich.
Disclosure Statement
No potential conflict of interest was reported by the authors.
Notes
Additional information
Funding
Notes on contributors
Fan Zhang
FAN ZHANG is an Assistant Professor at the Institute of Remote Sensing and Geographical Information System, School of Earth and Space Sciences, Peking University, Beijing 100871, China. E-mail: [email protected]. His research interests include geospatial AI and data-driven urban studies.
Arianna Salazar-Miranda
ARIANNA SALAZAR-MIRANDA is a researcher at the Senseable City Lab at MIT and an incoming Assistant Professor of Urban Planning and Data Science at the School of the Environment at Yale University, New Haven, CT 06511. E-mail: [email protected]. Her research focuses on the relationship between urban planning, the built environment, human behavior, and sustainability using computational methods and new sources of data.
Fábio Duarte
FÁBIO DUARTE is a Principal Research Scientist at the Massachusetts Institute of Technology Senseable City Lab, Cambridge, MA 02139. E-mail: [email protected]. His research work involves urban technologies and the social construction of technologies.
Lawrence Vale
LAWRENCE VALE is Ford Professor of Urban Design and Planning and Associate Dean of the School of Architecture and Planning at the Massachusetts Institute of Technology, Cambridge, MA 02139. E-mail: [email protected]. His research interests include urban and regional planning, applied economics, and public administration and policy.
Gary Hack
GARY HACK is a Professor Emeritus of Urban Design at the Massachusetts Institute of Technology, where he headed the Department of Urban Studies and Planning, Professor Emeritus and former Dean of the School of Design at the University of Pennsylvania. E-mail: [email protected]. He has studied, taught, and practiced site planning for more than forty years in the United States, Canada, and other countries.
Min Chen
MIN CHEN is a Professor and Vice Director of the Key Laboratory of Virtual Geographic Environment, Ministry of Education of PRC, School of Geography, Nanjing Normal University, Nanjing, 210023, PR China. E-mail: [email protected]. His research interests include geographic modeling and simulation, and virtual geographic environments.
Yu Liu
YU LIU is a Professor of GIScience at the Institute of Remote Sensing and Geographical Information Systems, School of Earth and Space Sciences, Peking University, Beijing 100871, China. E-mail: [email protected]. His research concentration is in GIScience and big geodata.
Michael Batty
MICHAEL BATTY is Bartlett Professor of Planning and Chair of the Centre for Advanced Spatial Analysis at University College London, Gower Street, London WC1E 6BT, UK. E-mail: [email protected]. His research work involves the development of computer models of cities and regions, big data, and smart cities, and simulating long-term structural change and dynamics in cities as well as their visualization.
Carlo Ratti
CARLO RATTI is a Professor and Director of the MIT Senseable City Lab at the Massachusetts Institute of Technology, Cambridge, MA 02139. E-mail: [email protected]. He is also a founding partner of the international design office Carlo Ratti Associati.
Notes
References
- Ahlfeldt, G., and A. Mastro. 2012. Valuing iconic design: Frank Lloyd Wright architecture in Oak Park, Illinois. Housing Studies 27 (8):1079–99. doi: 10.1080/02673037.2012.728575.
- Anguelov, D., C. Dulong, D. Filip, C. Frueh, S. Lafon, R. Lyon, A. Ogale, L. Vincent, and J. Weaver. 2010. Google Street View: Capturing the world at street level. Computer Magazine.43 (6):32–38. doi: 10.1109/MC.2010.170.
- Arnheim, R. 1965. Art and visual perception: A psychology of the creative eye. Berkeley: University of California Press.
- Baevski, A., Y. Zhou, A. Mohamed, and M. Auli. 2020. Wav2vec 2.0: A framework for self-supervised learning of speech representations. Advances in Neural Information Processing Systems 33:12449–60.
- Batty, M. 2021. Defining urban science. In Urban informatics, ed. W. Shi, M. F. Goodchild, M. Batty, M.-P. Kwan, and A. Zhang, 15–28. Singapore: Springer.
- Bau, D., J.-Y. Zhu, H. Strobelt, A. Lapedriza, B. Zhou, and A. Torralba. 2020. Understanding the role of individual units in a deep neural network. Proceedings of the National Academy of Sciences of the United States of America 117 (48):30071–78. doi: 10.1073/pnas.1907375117.
- Biljecki, F., and K. Ito. 2021. Street view imagery in urban analytics and GIS: A review. Landscape and Urban Planning 215:104217. doi: 10.1016/j.landurbplan.2021.104217.
- Biljecki, F., T. Zhao, X. Liang, and Y. Hou. 2023. Sensitivity of measuring the urban form and greenery using street-level imagery: A comparative study of approaches and visual perspectives. International Journal of Applied Earth Observation and Geoinformation 122:103385. doi: 10.1016/j.jag.2023.103385.
- Brown, T., B. Mann, N. Ryder, M. Subbiah, J. D. Kaplan, P. Dhariwal, A. Neelakantan, P. Shyam, G. Sastry, A. Askell, et al. 2020. Language models are few-shot learners. Advances in Neural Information Processing Systems 33:1877–1901.
- Chen, J., L. Chen, Y. Li, W. Zhang, and Y. Long. 2023. Measuring physical disorder in urban street spaces: A large-scale analysis using street view images and deep learning. Annals of the American Association of Geographers 113 (2):469–87. doi: 10.1080/24694452.2022.2114417.
- Chen, L., Y. Lu, Q. Sheng, Y. Ye, R. Wang, and Y. Liu. 2020. Estimating pedestrian volume using street view images: A large-scale validation test. Computers, Environment and Urban Systems 81:101481. doi: 10.1016/j.compenvurbsys.2020.101481.
- Chen, L.-C., Y. Zhu, G. Papandreou, F. Schroff, and H. Adam. 2018. Encoder-decoder with atrous separable convolution for semantic image segmentation. In Proceedings of the European Conference on Computer Vision (ECCV), ed. V. Ferrari, M. Hebert, C. Sminchisescu, and Y. Weiss, 801–18. Munich, Germany: Springer.
- Chen, S., and F. Biljecki. 2023. Automatic assessment of public open spaces using street view imagery. Cities 137:104329. doi: 10.1016/j.cities.2023.104329.
- Cinnamon, J., and L. Jahiu. 2021. Panoramic street-level imagery in data-driven urban research: A comprehensive global review of applications, techniques, and practical considerations. ISPRS International Journal of Geo-Information 10 (7):471. doi: 10.3390/ijgi10070471.
- Clifton, K. J., A. Livi Smith, and D. Rodriguez. 2007. The development and testing of an audit for the pedestrian environment. Landscape and Urban Planning 80 (1–2):95–110. doi: 10.1016/j.landurbplan.2006.06.008.
- Cullen, G. 1961. The concise townscape. London and New York: Routledge/Architectural Press London.
- den Braver, N. R., J. G. Kok, J. D. Mackenbach, H. Rutter, J.-M. Oppert, S. Compernolle, J. W. Twisk, J. Brug, J. W. Beulens, and J. Lakerveld. 2020. Neighbourhood drivability: Environmental and individual characteristics associated with car use across Europe. The International Journal of Behavioral Nutrition and Physical Activity 17 (1):8. doi: 10.1186/s12966-019-0906-2.
- Doersch, C., S. Singh, A. Gupta, J. Sivic, and A. Efros. 2012. What makes Paris look like Paris? ACM Transactions on Graphics 31 (4):1–9. doi: 10.1145/2185520.2185597.
- Duarte, F., and C. Ratti. 2021. What urban cameras reveal about the city: The work of the Senseable City Lab. In Urban informatics, ed. W. Shi, M. F. Goodchild, M. Batty, M.-P. Kwan, and A. Zhang, 491–502. Singapore: Springer.
- Dubey, A., N. Naik, D. Parikh, R. Raskar, and C. A. Hidalgo. 2016. Deep learning the city: Quantifying urban perception at a global scale. In European conference on computer vision, ed. B. Leibe, J. Matas, N. Sebe, and M. Welling, 196–212. Berlin: Springer.
- Egli, V., C. Zinn, L. Mackay, N. Donnellan, K. Villanueva, S. Mavoa, D. J. Exeter, S. Vandevijvere, and M. Smith. 2019. Viewing obesogenic advertising in children’s neighbourhoods using Google Street View. Geographical Research 57 (1):84–97. doi: 10.1111/1745-5871.12291.
- Fan, Z., F. Zhang, and B. P. Loo. 2022. Rhythm of transit stations—Uncovering the activity-travel dynamics of transit-oriented development in the US. IEEE Transactions on Intelligent Transportation Systems 23 (8):12503–17. doi: 10.1109/TITS.2021.3115103.
- Fan, Z., F. Zhang, B. P. Loo, and C. Ratti. 2023. Urban visual intelligence: Uncovering hidden city profiles with street view images. Proceedings of the National Academy of Sciences of the United States of America 120 (27):e2220417120. doi: 10.1073/pnas.2220417120.
- Feuillet, T., H. Charreire, C. Roda, M. Ben Rebah, J. Mackenbach, S. Compernolle, K. Glonti, H. Bárdos, H. Rutter, I. De Bourdeaudhuij, et al. 2016. Neighbourhood typology based on virtual audit of environmental obesogenic characteristics. Obesity Reviews 17(Suppl. 1):19–30. doi: 10.1111/obr.12378.
- Filomena, G., J. A. Verstegen, and E. Manley. 2019. A computational approach to “The image of the city.” Cities 89:14–25. doi: 10.1016/j.cities.2019.01.006.
- Fotheringham, A. S., and D. W. Wong. 1991. The modifiable areal unit problem in multivariate statistical analysis. Environment and Planning A: Economy and Space 23 (7):1025–44. doi: 10.1068/a231025.
- Freestone, R. 2011. Reconciling beauty and utility in early city planning: The contribution of John Nolen. Journal of Urban History 37 (2):256–77. doi: 10.1177/0096144210391594.
- Gao, S., Y. Hu, and W. Li, eds. 2024. Introduction to geospatial artificial intelligence (GeoAI). In Handbook of geospatial artificial intelligence, 3–16. Boca Raton, FL: CRC Press.
- Gao, S., K. Janowicz, D. R. Montello, Y. Hu, J.-A. Yang, G. McKenzie, Y. Ju, L. Gong, B. Adams, and B. Yan. 2017. A data-synthesis-driven method for detecting and extracting vague cognitive regions. International Journal of Geographical Information Science 31 (6):1–27. doi: 10.1080/13658816.2016.1273357.
- Ge, Z., S. Liu, F. Wang, Z. Li, and J. Sun. 2021. Yolox: Exceeding yolo series in 2021. arXiv preprint arXiv:2107.08430.
- Gebru, T., J. Krause, Y. Wang, D. Chen, J. Deng, E. L. Aiden, and L. Fei-Fei. 2017. Using deep learning and Google Street View to estimate the demographic makeup of neighborhoods across the United States. Proceedings of the National Academy of Sciences of the United States of America 114 (50):13108–13. doi: 10.1073/pnas.1700035114.
- Gehl, J. 1971. Life between buildings: Using public space. Washington, DC: Danish Architectural Press.
- Goel, R., L. M. Garcia, A. Goodman, R. Johnson, R. Aldred, M. Murugesan, S. Brage, K. Bhalla, and J. Woodcock. 2018. Estimating city-level travel patterns using street imagery: A case study of using Google Street View in Britain. PLoS ONE 13 (5):e0196521. doi: 10.1371/journal.pone.0196521.
- Goodchild, M. F. 2007. Citizens as sensors: The world of volunteered geography. GeoJournal 69 (4):211–21. doi: 10.1007/s10708-007-9111-y.
- Goodchild, M. F., A. S. Fotheringham, P. Kedron, and W. Li. 2020. Introduction: Forum on reproducibility and replicability in geography. Annals of the American Association of Geographers 111 (5):1271–74. doi: 10.1080/24694452.2020.1806030.
- Goodchild, M. F., and W. Li. 2021. Replication across space and time must be weak in the social and environmental sciences. Proceedings of the National Academy of Sciences 118 (35):e2015759118. doi: 10.1073/pnas.2015759118.
- Gullón, P., H. M. Badland, S. Alfayate, U. Bilal, F. Escobar, A. Cebrecos, J. Diez, and M. Franco. 2015. Assessing walking and cycling environments in the streets of Madrid: Comparing on-field and virtual audits. Journal of Urban Health: Bulletin of the New York Academy of Medicine 92 (5):923–39. doi: 10.1007/s11524-015-9982-z.
- Hankey, S., W. Zhang, H. T. Le, P. Hystad, and P. James. 2021. Predicting bicycling and walking traffic using street view imagery and destination data. Transportation Research Part DTransport and Environment 90:102651. doi: 10.1016/j.trd.2020.102651.
- He, H., X. Lin, Y. Yang, and Y. Lu. 2020. Association of street greenery and physical activity in older adults: A novel study using pedestrian-centered photographs. Urban Forestry & Urban Greening 55:126789. doi: 10.1016/j.ufug.2020.126789.
- He, K., G. Gkioxari, P. Dollár, and R. Girshick. 2017. Mask R-CNN. In Proceedings of the IEEE international conference on computer vision, ed. L. O’Conner, 2980–88. Danvers, MA: IEEE.
- He, K., X. Zhang, S. Ren, and J. Sun. 2016. Deep residual learning for image recognition. In Proceedings of the IEEE conference on computer vision and pattern recognition, ed. T. Tuytelaars, F-F. Li, and R. Bajcsy, 770–78. Las Vegas, NV: IEEE.
- He, N., and G. Li. 2021. Urban neighbourhood environment assessment based on street view image processing: A review of research trends. Environmental Challenges 4:100090. doi: 10.1016/j.envc.2021.100090.
- Helbich, M., Y. Yao, Y. Liu, J. Zhang, P. Liu, and R. Wang. 2019. Using deep learning to examine street view green and blue spaces and their associations with geriatric depression in Beijing, China. Environment International 126:107–17. doi: 10.1016/j.envint.2019.02.013.
- Hong, J., D. McArthur, and V. Raturi. 2020. Did safe cycling infrastructure still matter during a COVID-19 lockdown? Sustainability 12 (20):8672. doi: 10.3390/su12208672.
- Hu, C.-B., F. Zhang, F.-Y. Gong, C. Ratti, and X. Li. 2020. Classification and mapping of urban canyon geometry using Google Street View images and deep multitask learning. Building and Environment 167:106424. doi: 10.1016/j.buildenv.2019.106424.
- Huang, G., Z. Liu, K. Q. Weinberger, and L. van der Maaten. 2017. Densely connected convolutional networks. In Proceedings of the IEEE conference on computer vision and pattern recognition, ed. R. Chellappa, A. Hoogs, Z. Zhang, 2261–69. Honolulu, HI: IEEE.
- Huang, J., T. Fei, Y. Kang, J. Li, Z. Liu, and G. Wu. 2023. Estimating urban noise along road network from street view imagery. International Journal of Geographical Information Science 38 (1):128–55. doi: 10.1080/13658816.2023.2274475.
- Huang, Y., F. Zhang, Y. Gao, W. Tu, F. Duarte, C. Ratti, D. Guo, and Y. Liu. 2023. Comprehensive urban space representation with varying numbers of street-level images. Computers, Environment and Urban Systems 106:102043. doi: 10.1016/j.compenvurbsys.2023.102043.
- Ibrahim, M. R., J. Haworth, and T. Cheng. 2020. Understanding cities with machine eyes: A review of deep computer vision in urban analytics. Cities 96:102481. doi: 10.1016/j.cities.2019.102481.
- Ibrahim, M. R., J. Haworth, and T. Cheng. 2021. Urban-i: From urban scenes to mapping slums, transport modes, and pedestrians in cities using deep learning and computer vision. Environment and Planning B: Urban Analytics and City Science 48 (1):76–93. doi: 10.1177/2399808319846517.
- Isola, P. D., J. N. Bogert, K. M. Chapple, S. Israr, T. L. Gillespie, and J. A. Weinberg. 2019. Google Street View assessment of environmental safety features at the scene of pedestrian automobile injury. The Journal of Trauma and Acute Care Surgery 87 (1):82–86. doi: 10.1097/TA.0000000000002338.
- James, P., R. F. Banay, J. E. Hart, and F. Laden. 2015. A review of the health benefits of greenness. Current Epidemiology Reports 2 (2):131–42. doi: 10.1007/s40471-015-0043-7.
- Janowicz, K., R. Zhu, J. Verstegen, G. McKenzie, B. Martins, and L. Cai. 2022. Six GIScience ideas that must die. AGILE 3:1–8. doi: 10.5194/agile-giss-3-7-2022.
- Johnson, E. B., A. Tidwell, and S. V. Villupuram. 2020. Valuing curb appeal. The Journal of Real Estate Finance and Economics 60 (1–2):111–33. doi: 10.1007/s11146-019-09713-z.
- Johnson, N. S., and H. C. Gabler. 2015. Injury outcome in crashes with guardrail end terminals. Traffic Injury Prevention 16(Suppl. 2):S103–S108. doi: 10.1080/15389588.2015.1065976.
- Kang, Y., J. Abraham, V. Ceccato, F. Duarte, S. Gao, L. Ljungqvist, F. Zhang, P. Näsman, and C. Ratti. 2023. Assessing differences in safety perceptions using GeoAI and survey across neighbourhoods in Stockholm, Sweden. Landscape and Urban Planning 236:104768. doi: 10.1016/j.landurbplan.2023.104768.
- Kang, Y., Q. Jia, S. Gao, X. Zeng, Y. Wang, S. Angsuesser, Y. Liu, X. Ye, and T. Fei. 2019. Extracting human emotions at different places based on facial expressions and spatial clustering analysis. Transactions in GIS 23 (3):450–80. doi: 10.1111/tgis.12552.
- Kang, Y., F. Zhang, S. Gao, H. Lin, and Y. Liu. 2020. A review of urban physical environment sensing using street view imagery in public health studies. Annals of GIS 26 (3):261–75. doi: 10.1080/19475683.2020.1791954.
- Kang, Y., F. Zhang, S. Gao, W. Peng, and C. Ratti. 2021. Human settlement value assessment from a place perspective: Considering human dynamics and perceptions in house price modeling. Cities 118:103333. doi: 10.1016/j.cities.2021.103333.
- Kang, Y., F. Zhang, W. Peng, S. Gao, J. Rao, F. Duarte, and C. Ratti. 2020. Understanding house price appreciation using multi-source big geo-data and machine learning. Land Use Policy 111:104919. doi: 10.1016/j.landusepol.2020.104919.
- Kedron, P., W. Li, S. Fotheringham, and M. Goodchild. 2021. Reproducibility and replicability: Opportunities and challenges for geospatial research. International Journal of Geographical Information Science 35 (3):427–45. doi: 10.1080/13658816.2020.1802032.
- Keralis, J. M., M. Javanmardi, S. Khanna, P. Dwivedi, D. Huang, T. Tasdizen, and Q. C. Nguyen. 2020. Health and the built environment in United States cities: Measuring associations using Google Street View-derived indicators of the built environment. BMC Public Health 20 (1):215. doi: 10.1186/s12889-020-8300-1.
- Khosla, A., B. An An, J. J. Lim, and A Torralba. 2014. Looking beyond the visible scene. In Proceedings of the IEEE conference on computer vision and pattern recognition, ed. S. Dickinson, M. Turk, and D. Metaxas, 3710–17. Columbus, OH: IEEE.
- Kim, A. M. 2015. Sidewalk city: Remapping public space in Ho Chi Minh City. Chicago: University of Chicago Press.
- Kirillov, A., E. Mintun, N. Ravi, H. Mao, C. Rolland, L. Gustafson, T. Xiao, S. Whitehead, A. C. Berg, W.-Y. Lo, et al. 2023. Segment anything. arXiv preprint arXiv:2304.02643.
- Kruse, J., Y. Kang, Y.-N. Liu, F. Zhang, and S. Gao. 2021. Places for play: Understanding human perception of playability in cities using street view images and deep learning. Computers, Environment and Urban Systems 90:101693. doi: 10.1016/j.compenvurbsys.2021.101693.
- Kwon, J.-H., and G.-H. Cho. 2020. An examination of the intersection environment associated with perceived crash risk among school-aged children: Using street-level imagery and computer vision. Accident: Analysis and Prevention 146:105716. doi: 10.1016/j.aap.2020.105716.
- Larkin, A., and P. Hystad. 2019. Evaluating street view exposure measures of visible green space for health research. Journal of Exposure Science & Environmental Epidemiology 29 (4):447–56. doi: 10.1038/s41370-018-0017-1.
- Laumer, D., N. Lang, N. van Doorn, O. Mac Aodha, P. Perona, and J. D. Wegner. 2020. Geocoding of trees from street addresses and street-level images. ISPRS Journal of Photogrammetry and Remote Sensing 162:125–36. doi: 10.1016/j.isprsjprs.2020.02.001.
- Law, S., B. Paige, and C. Russell. 2019. Take a look around: Using street view and satellite images to estimate house prices. ACM Transactions on Intelligent Systems and Technology 10 (5):1–19. doi: 10.1145/3342240.
- Lawlor, D., C. Bedford, M. Taylor, and S. Ebrahim. 2003. Geographical variation in cardiovascular disease, risk factors, and their control in older women: British women’s heart and health study. Journal of Epidemiology and Community Health 57 (2):134–40. doi: 10.1136/jech.57.2.134.
- Lee, I.-M., E. J. Shiroma, F. Lobelo, P. Puska, S. N. Blair, and P. T. Katzmarzyk for the Lancet Physical Activity Series Working Group. 2012. Effect of physical inactivity on major non-communicable diseases worldwide: An analysis of burden of disease and life expectancy. Lancet 380 (9838):219–29. doi: 10.1016/S0140-6736(12)61031-9.
- Less, E. L., P. McKee, T. Toomey, T. Nelson, D. Erickson, S. Xiong, and R. Jones-Webb. 2015. Matching study areas using Google Street View: A new application for an emerging technology. Evaluation and Program Planning 53:72–79. doi: 10.1016/j.evalprogplan.2015.08.002.
- Lewicka, M. 2008. Place attachment, place identity, and place memory: Restoring the forgotten city past. Journal of Environmental Psychology 28 (3):209–31. doi: 10.1016/j.jenvp.2008.02.001.
- Li, W., C.-Y. Hsu, and M. Hu. 2021. Tobler’s first law in GeoAI: A spatially explicit deep learning model for terrain feature detection under weak supervision. Annals of the American Association of Geographers 111 (7):1–19. doi: 10.1080/24694452.2021.1877527.
- Li, X., C. Zhang, and W. Li. 2015. Does the visibility of greenery increase perceived safety in urban areas? Evidence from the Place Pulse 1.0 dataset. ISPRS International Journal of Geo-Information 4 (3):1166–83. doi: 10.3390/ijgi4031166.
- Liang, X., T. Zhao, and F. Biljecki. 2023. Revealing spatio-temporal evolution of urban visual environments with street view imagery. Landscape and Urban Planning 237:104802. doi: 10.1016/j.landurbplan.2023.104802.
- Liu, L., B. Zhou, J. Zhao, and B. D. Ryan. 2016. C-IMAGE: City cognitive mapping through geo-tagged photos. GeoJournal 81 (6):817–61. doi: 10.1007/s10708-016-9739-6.
- Liu, W., D. Anguelov, D. Erhan, C. Szegedy, S. Reed, C.-Y. Fu, and A. C. Berg. 2016. SSD: Single shot multibox detector. In European conference on computer vision, 21–37. Berlin: Springer.
- Liu, Y., F. Wang, Y. Xiao, and S. Gao. 2012. Urban land uses and traffic “source-sink areas”: Evidence from GPS-enabled taxi data in Shanghai. Landscape and Urban Planning 106 (1):73–87. doi: 10.1016/j.landurbplan.2012.02.012.
- Liu, Z., Y. Lin, Y. Cao, H. Hu, Y. Wei, Z. Zhang, S. Lin, and B. Guo. 2021. Swin transformer: Hierarchical vision transformer using shifted windows. In Proceedings of the IEEE/CVF international conference on computer vision, ed. L. O’Conner, 10012–22. Montreal: IEEE.
- Liu, Z., A. Yang, M. Gao, H. Jiang, Y. Kang, F. Zhang, and T. Fei. 2019. Towards feasibility of photovoltaic road for urban traffic-solar energy estimation using street view image. Journal of Cleaner Production 228:303–18. doi: 10.1016/j.jclepro.2019.04.262.
- Lu, Y., C. Sarkar, and Y. Xiao. 2018. The effect of street-level greenery on walking behavior: Evidence from Hong Kong. Social Science & Medicine 208:41–49. doi: 10.1016/j.socscimed.2018.05.022.
- Lu, Y., Y. Yang, G. Sun, and Z. Gou. 2019. Associations between overhead-view and eye-level urban greenness and cycling behaviors. Cities 88:10–18. doi: 10.1016/j.cities.2019.01.003.
- Lynch, K. 1960. The image of the city. Cambridge, MA: MIT Press.
- Lynch, K. 1984. Good city form. Cambridge, MA: MIT Press.
- Ma, R., W. Wang, F. Zhang, K. Shim, and C. Ratti. 2019. Typeface reveals spatial economic patterns. Scientific Reports 9 (1):15946. doi: 10.1038/s41598-019-52423-y.
- Mai, G., W. Huang, J. Sun, S. Song, D. Mishra, N. Liu, S. Gao, T. Liu, G. Cong, Y. Hu, et al. 2023. On the opportunities and challenges of foundation models for geospatial artificial intelligence. arXiv preprint arXiv:2304.06798.
- Mehrabian, A., and J. A. Russell. 1974. An approach to environmental psychology. Cambridge, MA: MIT Press.
- Milgram, S. 1970. The experience of living in cities: A psychological analysis. New York: Psychology and the Problems of Society.
- Miranda, A. S., G. Du, C. Gorman, F. Duarte, W. Fajardo, and C. Ratti. 2022. Favelas 4D: Scalable methods for morphology analysis of informal settlements using terrestrial laser scanning data. Environment and Planning B: Urban Analytics and City Science 49 (9):2345–62.
- Miranda, A. S., Z. Fan, F. Duarte, and C. Ratti. 2021. Desirable streets: Using deviations in pedestrian trajectories to measure the value of the built environment. Computers, Environment and Urban Systems 86:101563. doi: 10.1016/j.compenvurbsys.2020.101563.
- Mirowski, P., M. K. Grimes, M. Malinowski, K. M. Hermann, K. Anderson, D. Teplyashin, K. Simonyan, K. Kavukcuoglu, A. Zisserman, and R. Hadsell. 2018. Learning to navigate in cities without a map. arXiv preprint arXiv:1804.00168.
- Mooney, S. J., K. Wheeler-Martin, L. M. Fiedler, C. M. LaBelle, T. Lampe, A. Ratanatharathorn, N. N. Shah, A. G. Rundle, and C. J. DiMaggio. 2020. Development and validation of a Google Street View pedestrian safety audit tool. Epidemiology 31 (2):301–9. doi: 10.1097/EDE.0000000000001124.
- Morison, B. 2002. On location: Aristotle’s concept of place. Oxford, UK: Oxford University Press on Demand.
- Mulford, C. 1899. Improvement in city life: Aesthetic progress. New York and London: Routledge.
- Mulford, L. S. 1899. Plate design. Arts Education Policy Review 1 (6):126.
- Naik, N., S. D. Kominers, R. Raskar, E. L. Glaeser, and C. A. Hidalgo. 2017. Computer vision uncovers predictors of physical urban change. Proceedings of the National Academy of Sciences of the United States of America 114 (29):7571–76. doi: 10.1073/pnas.1619003114.
- Nasar, J. L. 1990. The evaluative image of the city. Journal of the American Planning Association 56 (1):41–53. doi: 10.1080/01944369008975742.
- Nasar, J. L. 1994. Urban design aesthetics: The evaluative qualities of building exteriors. Environment and Behavior 26 (3):377–401. doi: 10.1177/001391659402600305.
- Nasar, J. L. 1998. The evaluative image of the city. Thousand Oaks, CA: Sage.
- Nasar, J. L., and K. M. Jones. 1997. Landscapes of fear and stress. Environment and Behavior 29 (3):291–323. doi: 10.1177/001391659702900301.
- Neyshabur, B., S. Bhojanapalli, D. McAllester, and N. Srebro. 2017. Exploring generalization in deep learning. arXiv preprint arXiv:1706.08947.
- Nguyen, Q. C., M. Sajjadi, M. McCullough, M. Pham, T. T. Nguyen, W. Yu, H.-W. Meng, M. Wen, F. Li, K. R. Smith, et al. 2018. Neighbourhood looking glass: 360° automated characterisation of the built environment for neighbourhood effects research. Journal of Epidemiology and Community Health 72 (3):260–66. doi: 10.1136/jech-2017-209456.
- Noyman, A., and K. Larson. 2020. A deep image of the city: Generative urban-design visualization. Challenge 7:30.
- Ordonez, V., and T. L. Berg. 2014. Learning high-level judgments of urban perception. In European conference on computer vision, ed. D. Fleet, T. Pajdla, B. Schiele, T. Tuytelaars, 494–510. Zurich: Springer.
- Patterson, G., and J. Hays. 2012. Sun attribute database: Discovering, annotating, and recognizing scene attributes. In Proceedings of the IEEE conference on computer vision and pattern recognition, ed. R. Chellappa, B. Kimia, and S. Chun Zhu, 2751–58. Providence, RI: IEEE.
- Patterson, M. E., and D. R. Williams. 2005. Maintaining research traditions on place: Diversity of thought and scientific progress. Journal of Environmental Psychology 25 (4):361–80. doi: 10.1016/j.jenvp.2005.10.001.
- Purves, R. S., S. Winter, and W. Kuhn. 2019. Places in information science. Journal of the Association for Information Science and Technology 70 (11):1173–82. doi: 10.1002/asi.24194.
- Qin, K., Y. Xu, C. Kang, and M.-P. Kwan. 2020. A graph convolutional network model for evaluating potential congestion spots based on local urban built environments. Transactions in GIS 24 (5):1382–1401. doi: 10.1111/tgis.12641.
- Qiu, W., Z. Zhang, X. Liu, W. Li, X. Li, X. Xu, and X. Huang. 2022. Subjective or objective measures of street environment, which are more effective in explaining housing prices? Zhonghua Wai ke za Zhi 62 (3):202–10. doi: 10.1016/j.landurbplan.2022.104358.
- Quiñonero-Candela, J., M. Sugiyama, N. D. Lawrence, and A. Schwaighofer. 2009. Dataset shift in machine learning. Cambridge, MA: MIT Press.
- Radford, A., J. W. Kim, C. Hallacy, A. Ramesh, G. Goh, S. Agarwal, G. Sastry, A. Askell, P. Mishkin, J. Clark, et al. 2021. Learning transferable visual models from natural language supervision. In International conference on machine learning, ed. J. Langford, 8748–63. San Diego: PMLR.
- Rapoport, A. 1990. The meaning of the built environment: A nonverbal communication approach. Tucson: University of Arizona Press.
- Ren, S., K. He, R. Girshick, and J. Sun. 2015. Faster R-CNN: Towards real-time object detection with region proposal networks. In Advances in neural information processing systems, ed. C. Cortes, D. D. Lee, M. Sugiyama, and R. Garnett, 91–99. Cambridge, MA: MIT Press.
- Robinson, C. M. 1903. Modern civic art; or, the city made beautiful. New York: G. P. Putnam.
- Roda, C., H. Charreire, T. Feuillet, J. Mackenbach, S. Compernolle, K. Glonti, M. Ben Rebah, H. Bárdos, H. Rutter, M. McKee, et al. 2016. Mismatch between perceived and objectively measured environmental obesogenic features in European neighbourhoods. Obesity Reviews 17(Suppl. 1):31–41. doi: 10.1111/obr.12376.
- Russell, B. C., A. Torralba, K. P. Murphy, and W. T. Freeman. 2008. LabelMe: A database and Web-based tool for image annotation. International Journal of Computer Vision 77 (1–3):157–73. doi: 10.1007/s11263-007-0090-8.
- Rzotkiewicz, A., A. L. Pearson, B. V. Dougherty, A. Shortridge, and N. Wilson. 2018. Systematic review of the use of Google Street View in health research: Major themes, strengths, weaknesses and possibilities for future research. Health & Place 52:240–46. doi: 10.1016/j.healthplace.2018.07.001.
- Saiz, A., A. Salazar, and J. Bernard. 2018. Crowdsourcing architectural beauty: Online photo frequency predicts building aesthetic ratings. PLoS ONE 13 (7):e0194369. doi: 10.1371/journal.pone.0194369.
- Salazar-Miranda, A., F. Zhang, M. Sun, P. Leoni, F. Duarte, and C. Ratti. 2023. Smart curbs: Measuring street activities in real-time using computer vision. Landscape and Urban Planning 234:104715. doi: 10.1016/j.landurbplan.2023.104715.
- Salesses, P., K. Schechtner, and C. A. Hidalgo. 2013. The collaborative image of the city: Mapping the inequality of urban perception. PLoS ONE 8 (7):e68400. doi: 10.1371/journal.pone.0068400.
- Sampson, R. J., and S. W. Raudenbush. 1999. Systematic social observation of public spaces: A new look at disorder in urban neighborhoods. American Journal of Sociology 105 (3):603–51. doi: 10.1086/210356.
- Sampson, R. J., and S. W. Raudenbush. 2004. Seeing disorder: Neighborhood stigma and the social construction of “broken windows.” Social Psychology Quarterly 67 (4):319–42. doi: 10.1177/019027250406700401.
- Seiferling, I., N. Naik, C. Ratti, and R. Proulx. 2017. Green streets—Quantifying and mapping urban trees with street-level imagery and computer vision. Landscape and Urban Planning 165:93–101. doi: 10.1016/j.landurbplan.2017.05.010.
- Silver, D., A. Huang, C. J. Maddison, A. Guez, L. Sifre, G. van den Driessche, J. Schrittwieser, I. Antonoglou, V. Panneershelvam, M. Lanctot, et al. 2016. Mastering the game of Go with deep neural networks and tree search. Nature 529 (7587):484–89. doi: 10.1038/nature16961.
- Sitte, C. 1889. City building according to artistic principles. New York: Columbia University Press.
- Sorokin, A., and D. Forsyth. 2008. Utility data annotation with Amazon Mechanical Turk. In IEEE computer society conference on computer vision and pattern recognition workshops, ed. N. Ahuja and L. Shapiro, 1–8. Anchorage, AK: IEEE.
- Suel, E., S. Bhatt, M. Brauer, S. Flaxman, and M. Ezzati. 2021. Multimodal deep learning from satellite and street-level imagery for measuring income, overcrowding, and environmental deprivation in urban areas. Remote Sensing of Environment 257:112339. doi: 10.1016/j.rse.2021.112339.
- Suel, E., J. W. Polak, J. E. Bennett, and M. Ezzati. 2019. Measuring social, environmental and health inequalities using deep learning and street imagery. Scientific Reports 9 (1):6229. doi: 10.1038/s41598-019-42036-w.
- Sun, M., C. Han, Q. Nie, J. Xu, F. Zhang, and Q. Zhao. 2022. Understanding building energy efficiency with administrative and emerging urban big data by deep learning in Glasgow. Energy and Buildings 273:112331. doi: 10.1016/j.enbuild.2022.112331.
- Sun, M., F. Zhang, F. Duarte, and C. Ratti. 2022. Understanding architecture age and style through deep learning. Cities 128:103787. doi: 10.1016/j.cities.2022.103787.
- Svoray, T., M. Dorman, G. Shahar, and I. Kloog. 2018. Demonstrating the effect of exposure to nature on happy facial expressions via Flickr data: Advantages of non-intrusive social network data analyses and geoinformatics methodologies. Journal of Environmental Psychology 58:93–100. doi: 10.1016/j.jenvp.2018.07.006.
- Szegedy, C., W. Liu, Y. Jia, P. Sermanet, S. Reed, D. Anguelov, D. Erhan, V. Vanhoucke, and A. Rabinovich. 2015. Going deeper with convolutions. In Proceedings of the IEEE conference on computer vision and pattern recognition, ed. H. Bischof, D. Forsyth, C. Schmid, and S. Sclaroff, 1–9. Boston, MA: IEEE.
- Takano, T., K. Nakamura, and M. Watanabe. 2002. Urban residential environments and senior citizens’ longevity in megacity areas: The importance of walkable green spaces. Journal of Epidemiology and Community Health 56 (12):913–18. doi: 10.1136/jech.56.12.913.
- Talen, E., and C. Ellis. 2002. Beyond relativism: Reclaiming the search for good city form. Journal of Planning Education and Research 22 (1):36–49. doi: 10.1177/0739456X0202200104.
- Tanprasert, T., C. Siripanpornchana, N. Surasvadi, and S. Thajchayapong. 2020. Recognizing traffic black spots from street view images using environment-aware image processing and neural network. IEEE Access.8:121469–78. doi: 10.1109/ACCESS.2020.3006493.
- Tuan, Y.-F. 1977. Space and place: The perspective of experience. Minneapolis: University of Minnesota Press.
- Tuan, Y.-F. 1979. Landscapes of fear. Minneapolis: University of Minnesota Press.
- Ulrich, R. S. 1984. View through a window may influence recovery from surgery. Science 224 (4647):420–21. doi: 10.1126/science.6143402.
- Vargo, J., B. Stone, and K. Glanz. 2012. Google walkability: A new tool for local planning and public health research? Journal of Physical Activity & Health 9 (5):689–97. doi: 10.1123/jpah.9.5.689.
- Verhoeven, H., L. Van Hecke, D. Van Dyck, T. Baert, N. Van de Weghe, P. Clarys, B. Deforche, and J. Van Cauwenberg. 2018. Differences in physical environmental characteristics between adolescents’ actual and shortest cycling routes: A study using a Google Street View-based audit. International Journal of Health Geographics 17 (1):16. doi: 10.1186/s12942-018-0136-x.
- Villeneuve, P., R. Ysseldyk, A. Root, S. Ambrose, J. DiMuzio, N. Kumar, M. Shehata, M. Xi, E. Seed, X. Li, et al. 2018. Comparing the normalized difference vegetation index with the Google Street View measure of vegetation to assess associations between greenness, walkability, recreational physical activity, and health in Ottawa, Canada. International Journal of Environmental Research and Public Health 15 (8):1719. doi: 10.3390/ijerph15081719.
- Wang, J., K. Sun, T. Cheng, B. Jiang, C. Deng, Y. Zhao, D. Liu, Y. Mu, M. Tan, X. Wang, et al. 2020. Deep high-resolution representation learning for visual recognition. IEEE Transactions on Pattern Analysis and Machine Intelligence 43 (10):3349–64. doi: 10.1109/TPAMI.2020.2983686.
- Wang, M., and W. Deng. 2018. Deep visual domain adaptation: A survey. Neurocomputing 312:135–53. doi: 10.1016/j.neucom.2018.05.083.
- Wang, R., M. Helbich, Y. Yao, J. Zhang, P. Liu, Y. Yuan, and Y. Liu. 2019. Urban greenery and mental wellbeing in adults: Cross-sectional mediation analyses on multiple pathways across different greenery measures. Environmental Research 176:108535. doi: 10.1016/j.envres.2019.108535.
- Wang, R., Y. Lu, J. Zhang, P. Liu, Y. Yao, and Y. Liu. 2019. The relationship between visual enclosure for neighbourhood street walkability and elders’ mental health in China: Using street view images. Journal of Transport & Health 13:90–102. doi: 10.1016/j.jth.2019.02.009.
- Wang, Z., Q. Liang, F. Duarte, F. Zhang, L. Charron, L. Johnsen, B. Cai, and C. Ratti. 2019. Quantifying legibility of indoor spaces using deep convolutional neural networks: Case studies in train stations. Building and Environment 160:106099. doi: 10.1016/j.buildenv.2019.04.035.
- Warntz, W. 1989. Newton, the Newtonians, and the Geographia Generalis Varenii. Annals of the Association of American Geographers 79 (2):165–91. doi: 10.1111/j.1467-8306.1989.tb00257.x.
- Whyte, W. H. 1980. The social life of small urban spaces. Columbia, MO: Public Spaces.
- Wilson, W. H. 1964. City beautiful movement in Kansas City. Columbia: University of Missouri Press.
- Wohlwill, J. F. 1976. Environmental aesthetics: The environment as a source of affect. In Human behavior and environment, ed. I. Altman and J. F. Wohlwill, 37–86. Berlin: Springer.
- Wu, A. N., and F. Biljecki. 2022. GANmapper: Geographical data translation. International Journal of Geographical Information Science 36 (7):1394–1422. doi: 10.1080/13658816.2022.2041643.
- Xiao, X., C. Fang, and H. Lin. 2020. Characterizing tourism destination image using photos’ visual content. ISPRS International Journal of Geo-Information 9 (12):730. doi: 10.3390/ijgi9120730.
- Xu, Z., D. Tao, Y. Zhang, J. Wu, and A. C. Tsoi. 2014. Architectural style classification using multinomial latent logistic regression. In European conference on computer vision, ed. D. Fleet, T. Pajdla, B. Schiele, and T. Tuytelaars, 600–15. Berlin: Springer.
- Yang, J., H. Rong, Y. Kang, F. Zhang, and A. Chegut. 2021. The financial impact of street-level greenery on New York commercial buildings. Landscape and Urban Planning 214:104162. doi: 10.1016/j.landurbplan.2021.104162.
- Yao, Y., J. Zhang, C. Qian, Y. Wang, S. Ren, Z. Yuan, and Q. Guan. 2021. Delineating urban job–housing patterns at a parcel scale with street view imagery. International Journal of Geographical Information Science 35 (10):1927–50. doi: 10.1080/13658816.2021.1895170.
- Ye, C., F. Zhang, L. Mu, Y. Gao, and Y. Liu. 2020. Urban function recognition by integrating social media and street-level imagery. Environment and Planning B: Urban Analytics and City Science 48 (6):1430–44. doi: 10.1177/2399808320935467.
- Yin, L., and Z. Wang. 2016. Measuring visual enclosure for street walkability: Using machine learning algorithms and Google Street View imagery. Applied Geography 76:147–53. doi: 10.1016/j.apgeog.2016.09.024.
- Yuan, J., Y. Zheng, and X. Xie. 2012. Discovering regions of different functions in a city using human mobility and POIs. In Proceedings of the 18th ACM SIGKDD international conference on knowledge discovery and data mining, 186–94. Beijing: ACM. doi: 10.1145/2339530.2339561.
- Zhang, F., F. Duarte, R. Ma, D. Milioris, H. Lin, and C. Ratti. 2016. Indoor space recognition using deep convolutional neural network: A case study at MIT campus. arXiv preprint arXiv:1610.02414.
- Zhang, F., Z. Fan, Y. Kang, Y. Hu, and C. Ratti. 2021. “Perception bias”: Deciphering a mismatch between urban crime and perception of safety. Landscape and Urban Planning 207:104003. doi: 10.1016/j.landurbplan.2020.104003.
- Zhang, F., L. Wu, D. Zhu, and Y. Liu. 2019. Social sensing from street-level imagery: A case study in learning spatio-temporal urban mobility patterns. ISPRS Journal of Photogrammetry and Remote Sensing 153:48–58. doi: 10.1016/j.isprsjprs.2019.04.017.
- Zhang, F., D. Zhang, Y. Liu, and H. Lin. 2018. Representing place locales using scene elements. Computers, Environment and Urban Systems 71:153–64. doi: 10.1016/j.compenvurbsys.2018.05.005.
- Zhang, F., B. Zhou, L. Liu, Y. Liu, H. H. Fung, H. Lin, and C. Ratti. 2018. Measuring human perceptions of a large-scale urban region using machine learning. Landscape and Urban Planning 180:148–60. doi: 10.1016/j.landurbplan.2018.08.020.
- Zhang, F., B. Zhou, C. Ratti, and Y. Liu. 2019. Discovering place-informative scenes and objects using social media photos. Royal Society Open Science 6 (3):181375. doi: 10.1098/rsos.181375.
- Zhang, F., J. Zu, M. Hu, D. Zhu, Y. Kang, S. Gao, Y. Zhang, and Z. Huang. 2020. Uncovering inconspicuous places using social media check-ins and street view images. Computers, Environment and Urban Systems 81:101478. doi: 10.1016/j.compenvurbsys.2020.101478.
- Zhang, K., M. Chen, Y. Yang, T. Zhong, R. Zhu, F. Zhang, Z. Qian, G. Lü, and J. Yan. 2022. Quantifying the photovoltaic potential of highways in China. Applied Energy 324:119600. doi: 10.1016/j.apenergy.2022.119600.
- Zhang, L., T. Pei, X. Wang, M. Wu, C. Song, S. Guo, and Y. Chen. 2020. Quantifying the urban visual perception of Chinese traditional-style building with street view images. Applied Sciences 10 (17):5963. doi: 10.3390/app10175963.
- Zhao, B., S. Zhang, C. Xu, Y. Sun, and C. Deng. 2021. Deep fake geography? When geospatial data encounter artificial intelligence. Cartography and Geographic Information Science 48 (4):338–52. doi: 10.1080/15230406.2021.1910075.
- Zhao, H., J. Shi, X. Qi, X. Wang, and J. Jia. 2017. Pyramid scene parsing network. In Proceedings of IEEE conference on computer vision and pattern recognition, ed. R. Chellappa, Z. Zhang, and A. Hoogs, 2881–90. Honolulu, HI: IEEE.
- Zhao, T., X. Liang, W. Tu, Z. Huang, and F. Biljecki. 2023. Sensing urban soundscapes from street view imagery. Computers, Environment and Urban Systems 99:101915. doi: 10.1016/j.compenvurbsys.2022.101915.
- Zhou, B., A. Lapedriza, A. Khosla, A. Oliva, and A. Torralba. 2017. Places: A 10 million image database for scene recognition. IEEE Transactions on Pattern Analysis and Machine Intelligence 40 (6):1452–64. doi: 10.1109/TPAMI.2017.2723009.
- Zhou, B., H. Zhao, X. Puig, S. Fidler, A. Barriuso, and A. Torralba. 2017. Scene parsing through ADE20K dataset. In Proceedings of the IEEE conference on computer vision and pattern recognition, 5122–30.
- Zhou, B., H. Zhao, X. Puig, T. Xiao, S. Fidler, A. Barriuso, and A. Torralba. 2019. Semantic understanding of scenes through the ADE20K dataset. International Journal of Computer Vision 127 (3):302–21. doi: 10.1007/s11263-018-1140-0.
- Zhou, H., L. Liu, M. Lan, W. Zhu, G. Song, F. Jing, Y. Zhong, Z. Su, and X. Gu. 2021. Using Google Street View imagery to capture micro built environment characteristics in drug places, compared with street robbery. Computers, Environment and Urban Systems 88:101631. doi: 10.1016/j.compenvurbsys.2021.101631.
- Zhu, D., F. Zhang, S. Wang, Y. Wang, X. Cheng, Z. Huang, and Y. Liu. 2020. Understanding place characteristics in geographic contexts through graph convolutional neural networks. Annals of the American Association of Geographers 110 (2):408–20. doi: 10.1080/24694452.2019.1694403.
- Zou, S., and L. Wang. 2021. Detecting individual abandoned houses from Google Street View: A hierarchical deep learning approach. ISPRS Journal of Photogrammetry and Remote Sensing 175:298–310. doi: 10.1016/j.isprsjprs.2021.03.020.
- Zünd, D., and L. M. A. Bettencourt. 2021. Street view imaging for automated assessments of urban infrastructure and services. In Urban informatics, ed. W. Shi, M. F. Goodchild, M. Batty, M.-P. Kwan, and A. Zhang. Singapore: Springer.