
 ?Mathematical formulae have been encoded as MathML and are displayed in this HTML version using MathJax in order to improve their display. Uncheck the box to turn MathJax off. This feature requires Javascript. Click on a formula to zoom.
Abstract
Evidence on public acceptability can support policy makers in their decision making around which urban interventions to implement. We compare the degree of acceptability for five built environment interventions targeted at active travel and quantify individual- and neighbourhood-level factors associated with greater acceptability of these interventions. We draw on cross-sectional data from the Targeting Healthy Eating and Physical Activity (THEPA) survey of 27,162 participants living in 17 Census Metropolitan Areas in Canada. Our study focuses on the extent to which participants agreed with: increasing the number of curb extensions at intersections; building protected bicycle lanes; redistributing road space to pedestrians and cyclists; implementing traffic calming measures; and closing street segments to motor vehicles. Agreement with interventions ranged from a low of 44.3% for closing streets to a high of 73.5% for increasing the number of curb extensions. Across all interventions, people who were younger, women, born outside of Canada, had lower incomes, and used alternative modes to driving were more likely to express agreement with implementation of the interventions. There were few associations with neighbourhood-level variables. Our results provide evidence on levels of acceptability of selected transportation interventions in urban Canada as well as insight into determinants of greater acceptability.
1. Introduction
Built environments that support people to get around by active modes of transportation have the potential for health and environmental benefits by increasing physical activity (Smith et al., Citation2017), reducing the risk of injuries from traffic collisions (Stoker et al., Citation2015), shifting travel to less polluting modes (de Nazelle et al., Citation2011), and by supporting the travel needs of those who do not drive or have access to a car. Active travel is “travel in which the sustained physical exertion of the traveler contributes to their motion” (Cook, Stevenson, Aldred, Kendall, & Cohen, Citation2022). The most common modes are walking and cycling, but this definition also extends to skateboarding, scooting, and using a wheelchair, amongst other modes. Recognizing the potential for intersectoral benefits, researchers and policy makers have placed greater attention to active transportation over the past two decades (Cook et al., Citation2022). This is evidenced by both the rapid increase in the number of research articles published on active transportation and by growing investments in active transportation across all levels of government. Although the political will for taking action is increasing, a continued challenge for decision makers is identifying and prioritizing interventions that will increase active travel (Winters, Buehler, & Götschi, Citation2017).
To promote active travel, decision makers have a range of policy options – from less intrusive policies such as messaging to more intrusive policies such as restricting motor vehicle traffic. In this paper, we adopt the Nuffield intervention ladder framework for conceptualizing interventions along a continuum of intrusiveness (Nuffield Council on Bioethics, Citation2007). The eight rungs of the intervention ladder, ordered from least to most intrusive, are: do nothing, provide information, enable choice, guide choice through changing the default, guide choice through incentives, guide choice through disincentives, restrict choice, and eliminate choice (Nuffield Council on Bioethics, Citation2007). This framework proposes that more intrusive interventions are more likely to elicit resistance from populations. Another way researchers have categorized interventions is according to their targets, that is, interventions can target individuals (e.g., cycling education programs), routes (e.g., infrastructure design, re-allocating road-space to pedestrians and cyclists), cities (e.g., city level land use planning), or society (e.g., federal transportation policies) (Winters et al., Citation2017). In this paper, we focus on route-level built environment interventions that facilitate active travel, such as physically separated bicycle lanes and traffic calming measures.
In choosing which interventions to implement, decisions makers must weigh different factors including cost, effectiveness, impacts to different population groups, and the acceptability of interventions (Diepeveen, Ling, Suhrcke, Roland, & Marteau, Citation2013). The bulk of academic literature on route-level built environment interventions targeted at active travel estimates the potential effectiveness of interventions on outcomes such as physical activity (Smith et al., Citation2017), travel behaviour (Scheepers et al., Citation2014; Smith et al., Citation2017), and traffic injuries and fatalities (Winters et al., Citation2017). Far less attention has been devoted to understanding acceptability of these interventions by residents, which is an important component for successful implementation (Diepeveen et al., Citation2013). In keeping with the larger investigation within which this study is embedded (Gauvin et al., 2024), we define acceptability as the level of agreement for a specific policy intervention. A low level of public agreement with a proposed policy can dissuade elected officials and city staff from implementing an intervention, even when there may be strong evidence for the effectiveness of the intervention.
Although there is little evidence on acceptability of active transportation interventions, we can draw on literature pertaining to acceptability of other health interventions designed to influence tobacco and alcohol control, food consumption, and physical activity (Diepeveen et al., Citation2013). In general, interventions that are less intrusive (e.g., messaging, educational campaigns) tend to be rated as more acceptable than policies that are more intrusive. Support for interventions also varies according to an individual’s demographics, their own behaviours, knowledge and experience with the intervention, and political ideology (Diepeveen et al., Citation2013; Klein, Ralph, Thigpen, & Brown, Citation2022). The social and physical environments in which people live can also influence acceptability of policies. This is evidenced by large differences in acceptability of proposed policies across and also within countries (Diepeveen et al., Citation2013; Sunstein, Reisch, & Rauber, Citation2018). For the most part, previous studies on acceptability focus on a single city or policy, which is useful for specific decisions but limits the ability to compare acceptability across a range of geographic contexts or interventions.
We build on this evidence base by comparing the degree of acceptability for five built environment interventions intended to support active travel in Canadian metropolitan areas and by quantifying the individual- and neighbourhood-level predictors of acceptability of these interventions. This can provide municipal decision makers and planners with evidence on levels of acceptability for particular interventions in their specific context, and provide insight into the various determinants of acceptability. We draw on data from the Targeting Healthy Eating and Physical Activity (THEPA) survey. This cross-sectional survey collected information on acceptability of 45 built environment interventions targeted at improving healthy eating and physical activity from a representative sample of urban dwelling adults living in the 17 largest Census Metropolitan Areas (CMAs) in Canada.
2. Methods
We focus on a subset of five route-level built environment interventions that aimed to create more favourable environments for active travel: increasing the number of curb extensions at intersections, building protected bicycle lanes, implementing traffic calming measures, redistributing road space to pedestrians and cyclists, and closing street segments to motor vehicles.
2.1. Setting
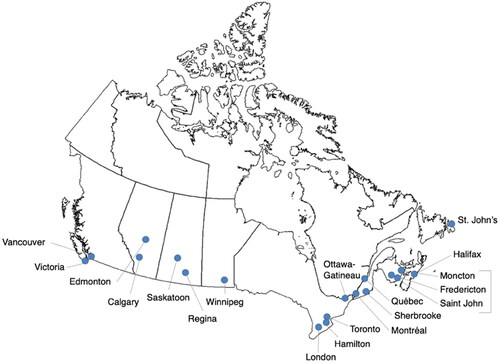
Participants were sampled from one of 17 CMAs located in Canada (). These regions are home to approximately 17 million people − representing just under half (47.5%) of the Canadian population (Statistics Canada, 2017). The share of home-to-work trips made by active modes of transportation ranges from 4.7-16.9% in the CMAs sampled. However, within CMAs, city-wide active travel mode shares range from 0.0-36.8% (Statistics Canada, 2017).
Figure 1. Locations of the 17 CMAs included in the analysis.
Note: Moncton, Fredericton, and Saint John were combined into one CMA for sampling purposes.
2.2. Survey data
The THEPA survey is described in detailed elsewhere (Gauvin et al., 2024). Briefly, between October 6 and December 23, 2020, individuals living in one of 17 CMAs were invited to participate in an online or telephone survey. Online respondents were recruited from existing panels whereas telephone respondents were recruited through random digit dialing. Recruitment resulted in a sample of 27,162 participants aged 18 years and over. The sample sizes across CMAs ranged from 1,020 (St. John’s) to 4,801 (Toronto). For study participants who provided a 6-digit postal code (n = 21,565), we linked their survey data with neighbourhood data from CANUE, including data on active living environments (Ross, Wasfi, Herrmann, & Gleckner, Citation2018) and area-level socio-economic status (DMTI Spatial Inc., 2015; Pampalon et al., Citation2012). The procedures for data collection were approved by the Comité d’éthique à la recherche du Centre Hospitalier de l’Université de Montréal (CÉR #19.258). Secondary use of data was also approved by the Simon Fraser University Research Ethics Board (SFU #30000754).
The survey invited participants to indicate the extent to which they agreed or disagreed with the implementation of 45 different interventions related to the active living environment (n = 26 interventions), the food environment (n = 12 interventions), and COVID-19 accommodations to city environments (n = 7 interventions) in their residential neighbourhood, defined as the area within a 15-minute walking distance of where they lived. To determine which interventions to include in the survey, the research team reviewed the academic and grey literatures to identify an initial list of over 150 potential interventions, and after eliminating duplicates and interventions beyond the purview of municipal government, classified the remaining 67 interventions as a function of the Nuffield Intervention Ladder, and conducted an online Delphi process to identify a reduced number of interventions that were of particular interest to decision makers and researchers. For each intervention, participants were asked “To what extent would you agree with the implementation of each of the following in the area where you live?” using a 4-point scale: completely agree, somewhat agree, somewhat disagree, completely disagree.
2.3. Interventions of interest
The 26 active living environment interventions related to education and messaging campaigns, improving access to and quality of green spaces and parks, increasing the access and efficiency of public transit, implementing built environment changes that would support pedestrians and cyclists, increasing fines for and enforcement of drivers and bicyclists, reducing speed limits, and bans on motor vehicles in certain areas or times. The current study focuses on a subset of five of the active living environment interventions that were route-level built environment interventions intended to support active travelers:
Develop safer street intersections by increasing the number of curb extensions
Build protected bicycle infrastructure like separated bike lanes
Redistribute road space to make more room for pedestrians and cyclists
Implement traffic calming measures like making streets narrower and adding speed bumps
Close off entire street segments to motor vehicles
The interventions are listed here and throughout the results according to the Nuffield Intervention Ladder, from least to most intrusive (Nuffield Council on Bioethics, Citation2007). The bold font is the shorthand we use to refer to the interventions in the text, tables, and figures that follow.
2.4. Measures
For each of the five interventions, we constructed a binary outcome measure of agreement. All participants who indicated they somewhat or strongly agreed were categorized as “agreeing”, and all participants who indicated they somewhat or strongly disagreed were categorized as “disagreeing”. We conducted additional sensitivity analyses with binary outcome measures for complete agreement (completely agree versus all other response options) and complete disagreement (completely disagree versus all other response options). Participants who selected “I don’t know” or “I prefer not to answer” were excluded from the analysis of that specific intervention. We considered variables measured at the individual- and neighbourhood-level as potential explanatory variables of acceptability of interventions (). These variables were selected based on our review of the literature, and what was available in the survey or through open data sources. At the individual-level, we considered variables related to socio-demographics and travel behaviour. At the neighbourhood-level, we obtained a measure for the active living environment of the participants’ residential neighbourhoods from the Canadian Active Living Environments (Can-ALE) database (Ross et al., Citation2018) and a measure for the area-level socioeconomic status from the National Material and Social Deprivation Index (MSDI) (DMTI Spatial Inc., 2015; Pampalon et al., Citation2012).
Table 1. Hypothesized explanatory variables of acceptability that were included in statistical models.
2.5. Data cleaning and approach for dealing with missing data
From the 27,162 participants who completed the THEPA survey, we included those who indicated their level of agreement with at least one of the five interventions of interest (weighted n = 26,534, 97.7%). The weighted analysis samples for each of five interventions ranged from 23,462 to 25,315.
Across explanatory variables, the percentage of missing data ranged from 0.3% to 24.1%. The percentage of missing data for each variable was as follows: 2.2% for age (unweighted n = 586), 0.3% for gender (unweighted n = 93), 4.4% for country of birth (unweighted n = 1,181), 1.7% for Indigenous identity (unweighted n = 456), 1.0% for education (unweighted n = 257), 11.1% for household income (unweighted n = 2,946), 4.8% for home-to-work travel (unweighted n = 1,267), 20.5% for active living environment (unweighted n = 5,471), and 24.1% for area-level socioeconomic status (unweighted n = 6,408). Variables for the active living environment and area-level socioeconomic status had high numbers of missing data because survey respondents either did not provide their six-digit postal code, a survey item that typically has a high rate of non-response, or the data for the participant’s postal code was missing from the Can-ALE database or the Material Deprivation Index. In total, 8,578 (32.2%) out of 26,637 eligible participants had incomplete individual- or neighbourhood-level data. Participants with incomplete data were more likely to be 55 years or older, have been born in Canada, self-identify as Indigenous, and have lower levels of education attainment. Importantly, distributions in the outcome variables were comparable between participants with incomplete and complete data.
We used a multiple imputation approach to address missing values in regression modelling. Specifically, we used the multivariate imputation by chained equations (MICE) technique using fully conditional specification and the default settings of the mice 3.14 package in R. We used this MICE algorithm to create 10 imputed datasets based on the notion that the number of imputations should approximate the average missing data rate, which in our case was 7.8% across explanatory variables (van Burren, Citation2018). We calculated descriptive statistics using the non-imputed datasets and conducted statistical models using the imputed datasets. The statistical models were combined using Rubin’s rules (Rubin, Citation1988).
2.6. Data analysis
We applied sex-, age-, and education-adjusted weights for each CMA and then post-stratification weights to adjust for the relative size of populations across CMAs in all descriptive and statistical analyses. This allowed us to account for the unequal selection probabilities across CMAs, and to adjust the survey data to age, sex, education strata in the CMAs. To assess sample representativeness after weighting, we compared distributions of socio-demographic data from the weighted sample to distributions from the 2016 census data for the population living in the 17 CMAs (Statistics Canada, Citation2016). We compared the sample to 2016 census data since the sampling and weighting were based on 2016 census data.
For the main analysis, we conducted descriptive statistics on the acceptability of the five interventions, overall and by CMA. We created Likert plots to visually show differences in agreement across the 17 CMAs. To determine associations between individual- and neighbourhood-level characteristics and acceptability of the interventions, we used a multi-level logistic regression modelling approach that nested individuals (level 1) within CMAs (level 2). This approach recognizes the hierarchical structure of the data and accounts for the fact that agreement with the implementation of a particular intervention may be influenced by the regional context in which people live. We constructed the models incrementally for each of the five interventions. We first fit a null model that included a random intercept. We tested the significance of the random effect using a likelihood ratio test. Next, we added all individual-level variables to the model as level-1 fixed effects. Finally, we entered the neighbourhood-level variables into the models, also as level-1 fixed effects. For comparison, we performed the analysis on the subset of complete cases; and obtained similar results to the imputed analysis. We also calculated generalized variance inflation factors at each step to check for multi-collinearity. The inflation factors for variables across models did not exceed 5, the threshold below which inflation factors are deemed to be in an acceptable range (Shrestha, Citation2020). Thus, multicollinearity was not a concern in our models. We repeated these analyses with the binary measures for complete agreement and complete disagreement to explore whether individual- and neighbourhood-level predictors of acceptability differed for those with the strongest opinions. Results from models with outcomes for complete agreement and complete disagreement are presented in Appendix A. All analyses were competed in R version 4.0.5.
3. Results
Of the 27,162 participants who completed the THEPA survey, 26,637 (weighted n = 26,534) provided a valid response for at least one of the five interventions. provides the unweighted and weighted characteristics of participants by CMA and individual- and neigbourhood-level characteristics, as well as distributions from the 2016 Canadian census data for the 17 metropolitan areas. After applying weights, the sample was representative of the underlying population based on CMA, age, gender, education levels, and household income, but over-represented Indigenous peoples (5.5% compared to 2.5% in the census) and people born in Canada (79.1% compared to 68.0% from the census). Note that not all census variables could be separated out for the population aged 18 years and over, the target population for THEPA study; therefore, some differences in distributions between our sample and the census may also be due to the different underlying populations.
Table 2. Descriptive statistics of THEPA survey participants by CMA and individual- and neighbourhood-level characteristics, compared to distributions from the 2016 Canadian census.
and provide a descriptive summary of the level of agreement for the five built environment interventions in the overall sample. The degree of agreement tracked with the level of intrusiveness of the intervention, with greater agreement for less intrusive interventions (increasing the number of curb extensions, building protected bicycle infrastructure) and lower agreement for more intrusive interventions (implementing traffic calming, closing off entire street segments). The percentage of participants that agreed with the proposed interventions ranged from a low of 44.4% for closing street segments to motor vehicles to a high of 73.5% for increasing the number of curb extensions at intersections. Closing street segments to motor vehicles was the only intervention where less than half (44.4%) of participants agreed with its implementation. The intervention with the strongest agreement was building protected bicycle infrastructure (31.7% completely agreed) and the intervention with the strongest disagreement was closing off street segments to motor vehicles (25.5% completely disagreed).
Figure 2. Level of agreement with five built environment interventions examined THEPA survey, weighted n = 26,534, fall 2020.
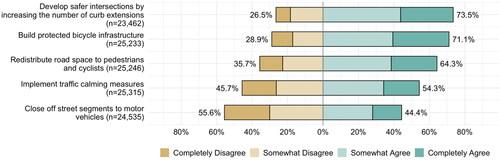
Table 3. Weighted counts and percentages of agreement with five built environment interventions examined in the THEPA survey, weighted n = 26,534, fall of 2020.
3.1. Acceptability of interventions across CMAs
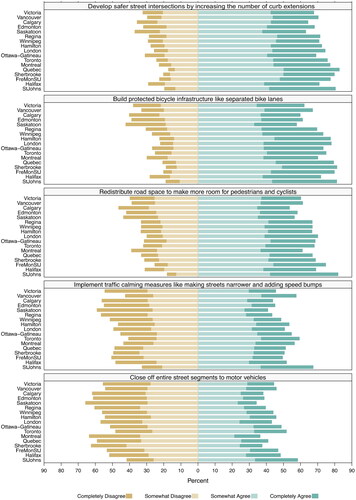
presents the level of agreement for the five built environment interventions stratified by the 17 CMAs, with CMAs listed from western to eastern Canada. Most CMAs followed a similar trajectory with higher levels of agreement for less intrusive interventions (increasing the number of curb extensions, building protected bicycle infrastructure) and lower levels of agreement for more intrusive interventions (implementing traffic calming, closing off entire street segments). Across CMAs, there was the narrowest range in the level of agreement for increasing the number of curb extensions, with the level of agreement ranging from 63.1% in Saskatoon to 82.7% in Québec City (range: 19.6%). The widest range in agreement was for redistributing road space to pedestrians and cyclists, with responses ranging from a low of 53.5% in Calgary to a high of 81.9% in Québec City (range: 28.4%). Participants living in Calgary, Edmonton, and Saskatoon consistently expressed the lowest levels of agreement for each intervention, and participants in St. John’s consistently expressed the highest levels of agreement for each intervention. There were also some patterns that could be observed across geographically proximal CMAs. For example, the levels of agreement tracked similarly across interventions for CMAs in Manitoba and Ontario (Winnipeg, London, Hamilton, Toronto). A similar level of agreement was also observed across interventions for CMAs in Québec (Montréal, Sherbrooke, Québec City).
Figure 3. Weighted Likert plots showing level of agreement with five built environment interventions across 17 CMAs in Canada.
Note: CMAs are ordered from east to west.
3.2. Multilevel models for associations with acceptability of interventions
presents the results of the final multilevel models of individual- and neighbourhood-level associations with acceptability of the interventions. Across interventions, there were consistent patterns with regards to age, gender place of birth, household income, and people’s travel behaviour. Older people had lower odds of expressing agreement with the interventions: across each of the models, people aged 75 years and older had 0.8 times the odds of agreeing with the intervention, as compared to those between the ages of 35 and 54 years. As compared to men, women had higher odds of expressing agreement with increasing the number of curb extensions, building protected bicycle lanes, redistributing road space, and implementing traffic calming, and lower odds of agreeing with closing streets to motor vehicles. People reporting “other” for gender identity had over twice the odds of expressing agreement with increasing the number of curb extensions and building protected bicycle lanes as compared to men. People who were born in countries outside of Canada had higher odds of expressing agreement with all five types of interventions, compared to people who were born in Canada. Those in the lowest income category were more likely to express agreement with the interventions, compared to those who had household incomes between $40,000-$79,000. People who reported taking public transit, walking, or cycling as their main mode of transportation consistently had higher odds of expressing agreement with the interventions as compared to those who drove. For those who reported walking or cycling as their main mode, the magnitude of association was the highest for the following three interventions: building protected bicycle lanes (OR = 1.63; 95% CIs: 1.42, 1.88), redistributing road space (OR = 1.88; 95% CIs: 1.65, 2.15), and closing street segments to motor vehicles (OR = 1.76; 95% CIs: 1.58, 1.97). For other individual-level variables such as Indigenous identity and education, patterns of acceptability across the five interventions were more variable. People who identified as Indigenous had higher odds of expressing agreement with redistributing road space, implementing traffic calming, and closing street segments to motor vehicles. Those with university degrees had higher odds of expressing agreement with building protected bicycle lanes, redistributing road space, and closing street segments to motor vehicles, compared to those who had trade or college certificates.
Table 4. Final multilevel logistic regression models with imputed data showing odds ratios and 95% confidence intervals for expressing agreement (somewhat or completely) with the implementation of five built environment interventions.
Adjusted for all individual-level characteristics, there were no substantial differences or consistent trends in acceptability of interventions across neighbourhood-level variables. Notable associations were between the active living environment and building protected bicycle lanes, and also for closing street segments to motor vehicles. People who lived in more favourable active living environments had lower odds of expressing agreement with building protected bicycle lanes (OR = 0.88; 95% CIs: 0.81, 0.97); however, this group had higher odds of expressing agreement with implementing traffic calming measures (OR: 1.10, 95% CI: 1.01, 1.20) and closing street segments to motor vehicles (OR = 1.24; 95% CIs: 1.15, 1.35).
Multilevel models of individual- and neighbourhood-level associations of complete agreement and complete disagreement with the inventions are presented in and in the Appendix. On the whole, the trends in associations across individual and neighbourhood-level variables aligned with those discussed above. For example, across all five interventions, older people had lower odds of expressing complete agreement and higher odds of expressing complete disagreement. People who used alternative modes of transportation to driving consistently expressed higher odds of complete agreement with the interventions and lower odds of complete disagreement. A few associations became more consistent across interventions. For example, people who identified as Indigenous, had household incomes below $40,000, and were born outside of Canada had higher odds of expressing complete agreement across all interventions (rather than having higher odds for select interventions only) and lower odds of complete disagreement. Similar to the models reported in , there were more consistent trends in associations for individual-level variables than for neighbourhood-level variables.
4. Discussion
We conducted an in-depth analysis on acceptability of five route-level built environment interventions intended to support active travel. We compared acceptability across interventions and metropolitan areas, and quantified patterns in agreement according to people’s individual and neighbourhood characteristics.
Overall, there was a high level of agreement for built environment interventions targeted at active travel. For example, seven in ten (71.1%) participants agreed with the implementation of protected bicycle lanes in their neighbourhood, and over half (54.3%) agreed with implementing traffic calming measures such as making streets narrower or adding speed bumps. These results align with previous studies in the US and Australia which also reported high levels of support for interventions targeted at active travel (Cradock et al., Citation2018; Gase, Barragan, Simon, Jackson, & Kuo, Citation2015; Rissel et al., Citation2018). Closing street segments to motor vehicles was the only intervention where less than half (44.4%) of participants expressed agreement with implementation.
When we stratified levels of agreement by metropolitan area, we saw the narrowest range in agreement across metropolitan areas for increasing the number of curb extensions (from 63.1% in Saskatoon to 80.4% in Québec City) and the widest range for redistributing road space (from 53.5% in Calgary to 81.9% in Saint John’s). The wider range in agreement for redistributing road space to pedestrians and cyclists could be in part due to varying interpretations for how this intervention would be implemented. Multilevel models showed notable patterns in agreement with interventions by age, gender, place of birth, household income, and people’s travel behaviour. Across all types of interventions, those who were younger, identified as a woman, were born outside of Canada, had lower incomes, and used alternative modes of transportation to driving had higher odds of expressing agreement with implementation of the built environment interventions. In fully adjusted models, neighbourhood-level variables were not as important for explaining variations in agreement with the interventions as we had expected a priori; there were only a few significant associations.
Our findings were generally consistent with previous research on acceptability of health and transport-related interventions in terms of patterns across the intervention’s intrusiveness and respondent characteristics. We found higher support for less intrusive interventions, aligned with findings from two previous systematic reviews (Diepeveen et al., Citation2013; Xiao, van Sluijs, Ogilvie, Patterson, & Panter, Citation2022). Across all five interventions, those who drove to work expressed the lowest levels of agreement with the interventions, relative to those who walked, cycled, or used public transport. Again, this aligns with previous research around perceived personal benefits: people are generally less agreeable to interventions they perceive will negatively impact them, and more supportive of interventions that will benefit them (Diepeveen et al., Citation2013; Reynolds et al., Citation2019).
It is more challenging to situate our results for associations with socio-demographic characteristics because there is little evidence on acceptability of the specific transport interventions included in this study. We expected to see higher levels of support for active travel interventions among younger people, women, people born outside of Canada, and those with lower incomes because these populations typically have higher active transport mode shares (Butler, Orpana, & Wiens, Citation2007; Hosford & Winters, Citation2021; Preston, McLafferty, & Maciejewska, Citation2022), and in the case of women, have stronger preferences for separated cycling infrastructure (Aldred, Elliott, Woodcock, & Goodman, Citation2017). In terms of age, we were surprised to observe the lowest levels of support for active travel interventions amongst the oldest age group, particularly for increasing the number of curb extensions at intersections. A strength of our study is the large sample which allowed us to retain certain socio-demographic characteristics in regression models that are sometimes excluded because of small sample sizes, including participants who selected “other” for their gender identity and who identified as Indigenous. Our results showed there was higher levels of agreement with selected built environment interventions in these populations. Further qualitative research can complement these findings to explore why there are differences in agreement of built environment interventions across certain segments of the population.
We expected participants’ neighbourhood environments to bear a stronger association with acceptability of interventions than was observed in our regression models. The survey asked participants to consider the potential implementation of interventions in the context of their residential neighbourhood, which was defined in the survey as the area within a 15-minute walking distance, or 8 to 10 city blocks. In particular, we anticipated that there would be higher levels of acceptability for active travel interventions in more favourable active living environments; however, an association in the opposite direction was observed for agreement with protected bicycle lanes. Further, sensitivity analyses showed that people in more favourable active living environments had the highest odds of expressing complete disagreement with building protected bicycle lanes (). This may be a function of the Can-ALE measure we used, which categorizes favorability of the active living environment according to intersection density, dwelling density, and points of interest measures (Ross et al., Citation2018). People who live in higher density areas may be more hesitant to add additional bicycle infrastructure that could be perceived to make it more difficult to get around by other modes, such as driving, walking, or public transit. Alternatively, people living in favourable active living environments may already view their neighbourhoods as having sufficient bicycle infrastructure, thus, less likely to agree that more bicycle infrastructure is needed. Stratifying the results by metropolitan area showed lower levels of acceptability for protected bicycle lanes in Victoria and Vancouver, two metropolitan areas in Canada widely recognized for their networks of protected bicycle lanes. Conversely, St. John’s, a metropolitan area with very little protected bicycle infrastructure, had the highest levels of acceptability for protected bicycle infrastructure across CMAs (Winters et al., Citation2022). Further qualitative research comparing acceptability of bicycle infrastructure in neighbourhoods and regions with differing levels of protected bicycle infrastructure could help clarify this relationship.
The five built environment interventions included in our study are commonly considered by decision makers and planners to help cities meet transport and climate goals. Certain interventions may align more strongly with particular policy goals or political motivations. For example, traffic calming measures can help cities meet vision zero goals by reducing speeds of motor vehicles, and thus, the likelihood of traffic collisions resulting in severe injury or fatality. On the other hand, street closures for motor vehicles were commonly implemented by cities during the pandemic to accommodate for the increased volumes of pedestrians and cyclists (NACTO, Citation2020). Although these interventions may be implemented with different underlying motivations, they are all examples of built environment interventions with potential to increase the safety and comfort of travelling by active modes and thus, increase the share of trips made by active travel. We also note that typically interventions are not implemented in isolation, but rather as a suite of interventions (Pucher, Dill, & Handy, Citation2010). Previous reviews suggest that comprehensive policy packages are more effective than single interventions (Winters et al., Citation2017; Xiao et al., Citation2022), especially policy packages that combine carrot-and-stick interventions (Xiao et al., Citation2022). Our analysis investigated public acceptability for interventions that could be categorized as carrots to encourage active travel (increasing the number of curb extensions, building protected bicycle infrastructure), sticks to discourage driving (traffic calming, close off street segments), or combined carrot-and-stick (redistributing road space to pedestrians and cyclists). Thus, the evidence on public acceptability of the interventions provided in this study, in concert with evidence on effectiveness, cost, and equity impacts, can provide helpful information to decision makers and planners around which populations to invite for further democratic exchange.
4.1. Strengths and limitations
We leveraged a large pan-Canadian dataset on acceptability to understand how residents perceive built environment interventions that support active travel. The contribution of our paper is timely from a policy perspective. In 2021, the Federal Government released Canada’s first ever national strategy and announced the Active Transportation Fund. Over the five-year period from 2021 to 2026, the Fund will provide $400 million to support the expansion and enhancement of active transportation infrastructure across Canada (Infrastructure Canada, Citation2021).
Our findings are most applicable to the urban contexts where we gathered data, which consists of 17 metropolitan areas that cover nearly 50% of Canada’s population. There may be different active travel needs and public preferences in smaller towns and rural and remote areas. Secondly, the survey was cross-sectional, capturing participant’s opinions at one point in time. Previous research on acceptability of transport pricing policies indicates that public acceptability of interventions often changes from pre- to post- implementation as people experience the actual benefits and/or consequences of the intervention (Jagers, Matti, & Nilsson, Citation2017; Schuitema, Steg, & Forward, Citation2010). Participants’ knowledge and familiarity with the interventions could also influence their acceptability of the intervention. The specific interventions we included are in many urban contexts in Canada. Detailed built environment data are not available nationally, thus, we were not able to capture the extent to which each of the five built environment interventions have been implemented in the 17 CMAs, or measure individual participants’ exposure to the interventions. This type of work may be more feasible for studies at smaller geographic scales. A third limitation is the potential for survey design to influence participant responses. Participants were asked to state their levels of agreement for 45 interventions targeted at healthy eating, physical activity, and COVID-19 accommodations in their neighbourhood. We only included five of these interventions in the current study because of our interest in built environment changes specifically supporting active travel. The responses for these five interventions are likely affected by the other types of interventions that were listed in the survey. Further, the specifics of language matter. A previous study reported potential for large framing effects in transportation policy surveys: in that study that 63% of respondents supported “shifting trips” to active modes of transportation, while only 34% supported “reducing driving” (Ralph, Klein, Thigpen, & Brown, Citation2021). Even with the possibility of framing effects, a majority of respondents expressed agreement with four of the five interventions, suggesting there is widespread support for making the built environment more favourable for active travel.
5. Conclusion
Our study showed there is broad support in Canadian metropolitan areas for built environment interventions targeted at active travel, particularly for increasing the number of curb extensions at intersections and building protected bicycle lanes. Agreement with interventions ranged from a low of 44.3% for closing streets to a high of 73.5% for increasing the number of curb extensions at intersections, however, these numbers varied considerably when we stratified the results by metropolitan area. Although responses for individual interventions were wide-ranging across metropolitan areas, there was a similar pattern of acceptability across interventions, with higher levels of agreement for less intrusive interventions (increasing the number of curb extensions, building protected bicycle infrastructure) and lower levels of agreement for more intrusive interventions (implementing traffic calming, closing off entire street segments). Across all types of interventions, those who were younger, women, born outside of Canada, had lower incomes, and used alternative modes to driving had higher odds of agreement. These findings provide practitioners and decision makers with evidence on acceptability for interventions targeted at active travel in their specific context, as well as evidence on how support may vary across segments of the population. Combining this information with evidence on the interventions’ effectiveness for increasing active travel, the potential equity impacts, and costs can be used by decision makers and planners to inform which active travel interventions to implement, which population groups may resist such changes in their neighbourhoods, and which populations to invite for further democratic debate to achieve greater collective consensus and adapt interventions to different needs and preferences.
Acknowledgements
We would like to acknowledge Audrey Plante and Jany St-Cyr who assisted with the implementation of the Delphi process and THEPA survey. Material and Social Deprivation Indices (MSDI) and the Canadian Active Living Environments Index (Can-ALE), indexed to DMTI Spatial Inc. postal codes, were provided by CANUE (Canadian Urban Environmental Health Research Consortium). This paper was earlier presented in track F-4 (Liveability and Non-Motorized Transport) of World Conference on Transport Research (WCTR-2023) held at Montreal, Canada, during 17th to 21st July 2023. We thank the Track Chair for giving opportunity to submit our paper to the partner journal TSTL, Taylor & Francis (T&F).
Disclosure statement
No potential conflict of interest was reported by the author(s).
Additional information
Funding
References
- Aldred, R., Elliott, B., Woodcock, J., & Goodman, A. (2017). Cycling provision separated from motor traffic: A systematic review exploring whether stated preferences vary by gender and age. Transport Reviews, 37(1), 1–26. https://doi.org/10.1080/01441647.2016.1200156
- Butler, G. P., Orpana, H. M., & Wiens, A. J. (2007). By your own two feet. Canadian Journal of Public Health = Revue Canadienne de Sante Publique, 98(4), 259–264. https://doi.org/10.1007/BF03405399
- Cook, S., Stevenson, L., Aldred, R., Kendall, M., & Cohen, T. (2022). More than walking and cycling: What is ‘active travel’? Transport Policy, 126, 151–161. https://doi.org/10.1016/j.tranpol.2022.07.015
- Cradock, A. L., Barrett, J. L., Chriqui, J. F., Evenson, K. R., Goins, K. V., Gustat, J., Heinrich, K. M., Perry, C. K., Scanze, M., Schmid, T. L., Tabak, R. G., Umstattd Meyer, M. R., & Valko, C. (2018). Driven to support: Individual- and county-level factors associated with public support for active transportation policies. American Journal of Health Promotion: AJHP, 32(3), 657–666. https://doi.org/10.1177/0890117117738758
- de Nazelle, A., Nieuwenhuijsen, M. J., Antó, J. M., Brauer, M., Briggs, D., Braun-Fahrlander, C., Cavill, N., Cooper, A. R., Desqueyroux, H., Fruin, S., Hoek, G., Panis, L. I., Janssen, N., Jerrett, M., Joffe, M., Andersen, Z. J., van Kempen, E., Kingham, S., Kubesch, N., … Lebret, E. (2011). Improving health through policies that promote active travel: A review of evidence to support integrated health impact assessment. Environment International, 37(4), 766–777. https://doi.org/10.1016/j.envint.2011.02.003
- Diepeveen, S., Ling, T., Suhrcke, M., Roland, M., & Marteau, T. M. (2013). Public acceptability of government intervention to change health-related behaviours: a systematic review and narrative synthesis. BMC Public Health, 13(1), 756. https://doi.org/10.1186/1471-2458-13-756
- DMTI Spatial Inc. (2015). CanMap Postal Code Suite v2015.3.
- Gase, L. N., Barragan, N. C., Simon, P. A., Jackson, R. J., & Kuo, T. (2015). Public awareness of and support for infrastructure changes designed to increase walking and biking in Los Angeles County. Preventive Medicine, 72, 70–75. https://doi.org/10.1016/j.ypmed.2014.12.033
- Gauvin, L., Muhajarine, M., Saint-Onge, K., St-Cyr, J., Ramamoorthy, S., Lambert-De Francesch, J., & Neudorf, C. (2024). Understanding the acceptability of local built environment transformations to promote healthy eating and physical activity: New Canadian evidence from THEPA. forthcoming.
- Hosford, K., & Winters, M. (2021). How the Canadian population gets to work. Retrieved November 11, 2022, from https://mobilizingjustice.ca/how-the-canadian-population-gets-to-work/.
- Infrastructure Canada. (2021). Active transportation fund. Retrieved August 8, 2022, from https://www.infrastructure.gc.ca/trans/index-eng.html.
- Jagers, S. C., Matti, S., & Nilsson, A. (2017). How exposure to policy tools transforms the mechanisms behind public acceptability and acceptance—The case of the Gothenburg congestion tax. International Journal of Sustainable Transportation, 11(2), 109–119. https://doi.org/10.1080/15568318.2016.1197348
- Klein, N. J., Ralph, K., Thigpen, C., & Brown, A. (2022). Political partisanship and transportation reform. Journal of the American Planning Association, 88(2), 163–178. https://doi.org/10.1080/01944363.2021.1965495
- NACTO. (2020). Streets for pandemic response & recovery. https://nacto.org/publication/streets-forpandemic-response-recovery/
- Nuffield Council on Bioethics. (2007). Public health: Ethical issues. Retrieved August 26, 2022, from https://apps.who.int/adolescent/second-decade/section/section_8/level8_8.php.
- Pampalon, R., Hamel, D., Gamache, P., Philibert, M. D., Raymond, G., & Simpson, A. (2012). An area-based material and social deprivation index for public health in Québec and Canada. Canadian Journal of Public Health = Revue Canadienne de Sante Publique, 103(8 Suppl 2), S17–S22. https://doi.org/10.1007/BF03403824
- Preston, V., McLafferty, S., & Maciejewska, M. (2022). Gender, immigration and commuting in metropolitan Canada. Tijdschrift Voor Economische en Sociale Geografie, 113(4), 348–364. https://doi.org/10.1111/tesg.12521
- Pucher, J., Dill, J., & Handy, S. (2010). Infrastructure, programs, and policies to increase bicycling: an international review. Preventive Medicine, 50 (Suppl. 1), S106–S125. https://doi.org/10.1016/j.ypmed.2009.07.028
- Ralph, K., Klein, N. J., Thigpen, C., & Brown, A. (2021). Public support for transport reform: Does it matter if we ‘Reduce Driving’ or ‘Shift Trips’? Findings, https://doi.org/10.32866/001c.29897
- Reynolds, J. P., Archer, S., Pilling, M., Kenny, M., Hollands, G. J., & Marteau, T. M. (2019). Public acceptability of nudging and taxing to reduce consumption of alcohol, tobacco, and food: A population-based survey experiment. Social Science & Medicine, 236, 112395. https://doi.org/10.1016/j.socscimed.2019.112395
- Rissel, C., Crane, M., Standen, C., Wen, L. M., Ellison, R., & Greaves, S. (2018). Public support for bicycling and transport policies in inner Sydney, Australia: A cross-sectional survey. Australian and New Zealand Journal of Public Health, 42(3), 309–314. https://doi.org/10.1111/1753-6405.12791
- Ross, N., Wasfi, R., Herrmann, T., & Gleckner, W. (2018). Canadian active living environments database (Can-ALE) User Manual & Technical Document. https://canue.ca/wpcontent/uploads/2018/03/CanALE_UserGuide.pdf
- Rubin, D. B. (1988). An overview of multiple imputation [Paper presentation]. Proceedings of the Survey Research Methods Section of the American Statistical Association.
- Scheepers, C. E., Wendel-Vos, G. C. W., den Broeder, J. M., van Kempen, E. E. M. M., van Wesemael, P. J. V., & Schuit, A. J. (2014). Shifting from car to active transport: A systematic review of the effectiveness of interventions. Transportation Research Part A: Policy and Practice, 70, 264–280. https://doi.org/10.1016/j.tra.2014.10.015
- Schuitema, G., Steg, L., & Forward, S. (2010). Explaining differences in acceptability before and acceptance after the implementation of a congestion charge in Stockholm. Transportation Research Part A: Policy and Practice, 44(2), 99–109. https://doi.org/10.1016/j.tra.2009.11.005
- Shrestha, N. (2020). Detecting multicollinearity in regression analysis. American Journal of Applied Mathematics and Statistics, 8(2), 39–42. https://doi.org/10.12691/ajams-8-2-1
- Smith, M., Hosking, J., Woodward, A., Witten, K., MacMillan, A., Field, A., Baas, P., & Mackie, H. (2017). Systematic literature review of built environment effects on physical activity and active transport - an update and new findings on health equity. The International Journal of Behavioral Nutrition and Physical Activity, 14(1), 158. https://doi.org/10.1186/s12966-017-0613-9
- Statistics Canada. (2017). 2016 Census of Population. Retrieved from: https://mountainmath.github.io/cancensus/
- Stoker, P., Garfinkel-Castro, A., Khayesi, M., Odero, W., Mwangi, M. N., Peden, M., & Ewing, R. (2015). Pedestrian safety and the built environment: A review of the risk factors. Journal of Planning Literature, 30(4), 377–392. https://doi.org/10.1177/0885412215595438
- Sunstein, C. R., Reisch, L. A., & Rauber, J. (2018). A worldwide consensus on nudging? Not quite, but almost. Regulation & Governance, 12(1), 3–22. https://doi.org/10.1111/rego.12161
- van Burren, S. (2018). Flexible imputation of missing data, second edition. Retrieved November 7, 2022, from https://stefvanbuuren.name/fimd/sec-howmany.html
- Winters, M., Beairsto, J., Ferster, C., Labaree, K., Manaugh, K., & Nelson, T. (2022). The Canadian Bikeway Comfort and Safety metrics (Can-BICS): National measures of the bicycling environment for use in research and policy. Health Reports, 33(10), 3–13. https://doi.org/10.25318/82-003-x202201000001-eng
- Winters, M., Buehler, R., & Götschi, T. (2017). Policies to promote active travel: Evidence from reviews of the literature. Current Environmental Health Reports, 4(3), 278–285. https://doi.org/10.1007/s40572-017-0148-x
- Xiao, C., van Sluijs, E., Ogilvie, D., Patterson, R., & Panter, J. (2022). Shifting towards healthier transport: carrots or sticks? Systematic review and meta-analysis of population-level interventions. The Lancet. Planetary Health, 6(11), e858–e869. https://doi.org/10.1016/S2542-5196(22)00220-0
Appendix A.
Sensitivity analyses
A.1. Multilevel logistic regression models for expressing complete agreement
Table A1. Final multilevel logistic regression models with imputed data showing odds ratios and 95% confidence intervals for expressing complete agreement with the implementation of five built environment interventions.
A.2. Multilevel logistic regression models for expressing complete disagreement
Table A2. Final multilevel logistic regression models with imputed data showing odds ratios and 95% confidence intervals for expressing complete disagreement with the implementation of five built environment interventions.