Figures & data
Figure 1. The diagram shows the three different sources responsible for cider aroma. Source ‘A’ encompasses metabolites generated by yeast as part of primary metabolism during fermentation regardless of the starting product (i.e., would be expected from the fermentation of apples, grapes, or a pure sucrose solution). Source ‘B’ are yeast-mediated metabolites, precursors, chemicals that are changed from their original form found in the apple as part of yeast metabolism. Source ‘C’ are volatiles compounds originating from the fruit that remain unchanged in the final cider. This figure is not considered to be a comprehensive list but a visual representation of the source of the chemicals found in cider. The figure was adapted from Dzialo et al., 2017.[Citation18]
![Figure 1. The diagram shows the three different sources responsible for cider aroma. Source ‘A’ encompasses metabolites generated by yeast as part of primary metabolism during fermentation regardless of the starting product (i.e., would be expected from the fermentation of apples, grapes, or a pure sucrose solution). Source ‘B’ are yeast-mediated metabolites, precursors, chemicals that are changed from their original form found in the apple as part of yeast metabolism. Source ‘C’ are volatiles compounds originating from the fruit that remain unchanged in the final cider. This figure is not considered to be a comprehensive list but a visual representation of the source of the chemicals found in cider. The figure was adapted from Dzialo et al., 2017.[Citation18]](/cms/asset/df9ac627-4aef-4aec-9371-69329a88837f/ujbc_a_2319931_f0001_c.jpg)
Table 1. The contents of volatiles (ng/mL) with cultivars x treatments interaction in year 2019 (n = 3).
Table 2. The contents of volatiles (ng/mL) without cultivars x treatments interaction in year 2019 (n = 3).
Table 3. The profile of apple fruits and musts obtained from different apple cultivars at different fermenting years.
Figure 2. Scores plot from PCA of apple cider volatile features separated by cultivars for 2018 and 2019. A and B are the plots for ciders made from pressed juice (treatment ‘C’) in 2018 and 2019, (i.e., traditionally produced cider). C and D are the plots for ciders made with maceration of apple pomace (treatment ‘M’) in 2018 and 2019. PCA was performed using log-transformed and auto-scaled significant features. Cultivar abbreviations refer to AB, ‘Arkansas Black’, B, ‘Braeburn’, F, ‘Yataka Fuji’, G, ‘Galaxy Gala’, GD, ‘Golden Supreme Golden Delicious’, GS, ‘Granny Smith’, J, ‘UltraRed Jonathan’, JG, ‘Jonagold’, PL, ‘Pink Lady’, RD, ‘Starkspur Supreme Red Delicious’, W, ‘Winesap’.
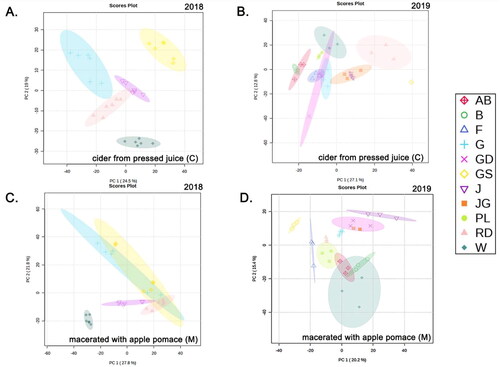
Figure 3. Comparison of cider volatile concentrations observed in in ciders produced from dessert apples in 2019 in our work compared to the concentration observed in heirloom apples by others.[Citation43,Citation44] To allow factors to be plotted in a manner that allows comparison, concentrations have been log transformed. The volatile compounds and compound classes correspond with our data presented in and . Abbreviations of compounds presented are as follows: E5, ethyl 2-methylbutanoate, E1, ethyl hexanoate, E6, hexyl acetate, H1, 2-Phenylethanol, H2, 1-hexanol, H3, 1-octanol, V2, eugenol, and V1, 4-ethyl-2-methoxyphenol. Data from 2018 was not included as it was not quantitative.
![Figure 3. Comparison of cider volatile concentrations observed in in ciders produced from dessert apples in 2019 in our work compared to the concentration observed in heirloom apples by others.[Citation43,Citation44] To allow factors to be plotted in a manner that allows comparison, concentrations have been log transformed. The volatile compounds and compound classes correspond with our data presented in Tables 1 and 2. Abbreviations of compounds presented are as follows: E5, ethyl 2-methylbutanoate, E1, ethyl hexanoate, E6, hexyl acetate, H1, 2-Phenylethanol, H2, 1-hexanol, H3, 1-octanol, V2, eugenol, and V1, 4-ethyl-2-methoxyphenol. Data from 2018 was not included as it was not quantitative.](/cms/asset/a1355e27-5a5e-4763-a048-8c8c1485b3ff/ujbc_a_2319931_f0003_c.jpg)
Figure 4. PLS-DA models for cider samples in 2018/2019 classified using the specific volatile compounds as X data (n = 19/22) and cultivars as Y-data (n = 5/11) measured by GC-MS. The volatile compounds are measured as relative response in 2018 (plots A. and C.) and concentrations in 2019 (plots B and D). Cultivar abbreviations refer to AB, ‘Arkansas Black’, B, ‘Braeburn’, F, ‘Yataka Fuji’, G, ‘Galaxy Gala’, GD, ‘Golden Supreme Golden Delicious’, GS, ‘Granny Smith’, J, ‘UltraRed Jonathan’, JG, ‘Jonagold’, PL, ‘Pink Lady’, RD, ‘Starkspur Supreme Red Delicious’, W, ‘Winesap’. Abbreviations of volatiles in the loading plots refer to Table S1 (e.g., E1, ethyl hexanoate, H1, phenylethyl alcohol, A1, octanoic acid, T1, linalool, V1, 4-ethyl-2-methoxyphenol, K1, ß-damascenone).
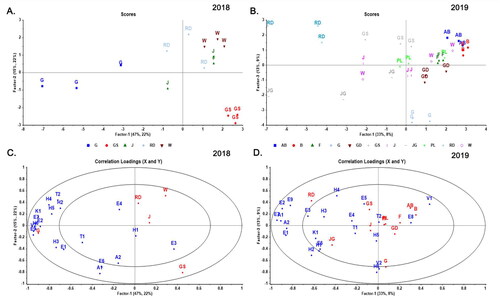
Figure 5. Total volatile concentrations segmented into compound classes (K, ketone, V, volatile phenol, T, monoterpenes, A, fatty acids, H, higher alcohols, and E, esters) for two treatments (shown in top line of x axis) and eleven cultivars (in bottom line of x axis) in 2019. Treatment abbreviation ‘C’ denotes traditionally made ciders from pressed juice and ‘M’ denotes ciders that included maceration of apple pomace. Cultivar abbreviations refer to AB, ‘Arkansas Black’, B, ‘Braeburn’, F, ‘Yataka Fuji’, G, ‘Galaxy Gala’, GD, ‘Golden Supreme Golden Delicious’, GS, ‘Granny Smith’, J, ‘UltraRed Jonathan’, JG, ‘Jonagold’, PL, ‘Pink Lady’, RD, ‘Starkspur Supreme Red Delicious’, W, ‘Winesap’. Different letters above bars indicate significant differences at α = 0.05 by Tukey HSD compared with the sum of the concentration from each class of compounds measured. The significant difference (p < 0.05) between each compound class is included in the Table S5. Data from 2018 is presented in Figure S1.
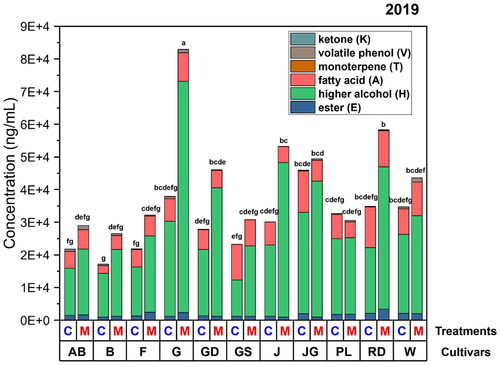
Figure 6. The scores plot of PLS-DA models for the impact of maceration during fermentation on cider volatile compound measured by GC-MS for all cultivars compared by treatment only in (A) 2018 and (B) 2019. ‘C’ denotes traditionally made ciders from pressed juice and ‘M’ denotes ciders that included maceration of apple pomace.
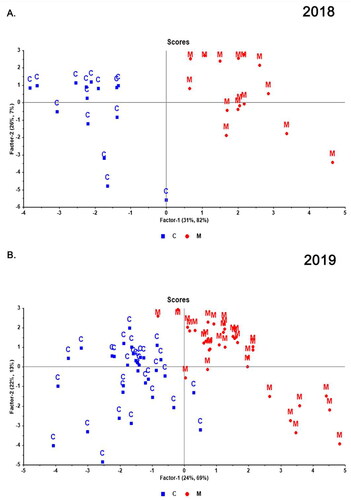
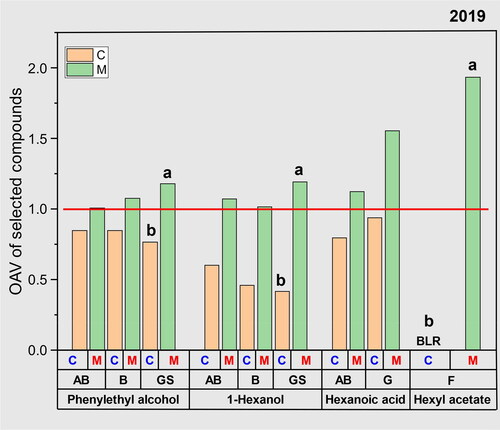
Figure 7. The odor activity value (OAV) of a subset of volatile compounds and cultivars in 2019. A paired t-test was conducted for the OAVs within cultivars to assess the treatment effects of each compound. Different letters indicate significant differences at a level of 0.05 by Tukey HSD. The use of letters is omitted in cases where no significant differences were observed. Abbreviations of cultivars refer to AB ‘Arkansas Black’, B, ‘Braeburn’, GS, ‘Granny Smith’, G, ‘Galaxy Gala’, F, ‘Yataka Fuji’. ‘C’ denotes traditionally made ciders from pressed juice and ‘M’ denotes ciders that included maceration of apple pomace. “BLR” represents “below linear range” when concentration of the compound was below the linear range to calculate the OAV. The compounds above the red line have an OAV larger than 1. Data of 2018 was not available to calculate the OAV because data was presented as the relative response.