
Figures & data
Figure 1. The dextrin reducing enzyme activity of Cascade hops expressed as the concentration of glucose and maltose produced during a dry-hopping assay. Cascade hops were selected from 8 fields in Oregon (CO) and 8 fields in Washington (CW) in harvest years 2020 and 2021.
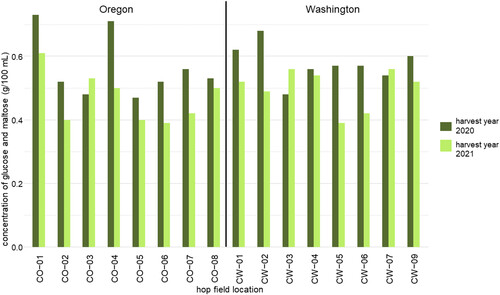
Figure 2. The dextrin reducing enzyme activity of Mosaic® hops expressed as the concentration of glucose and maltose produced during a dry-hopping assay. Mosaic® hops were selected from 8 fields in Oregon (MO) and 11 fields in Washington (MW) in harvest years 2020 and 2021.
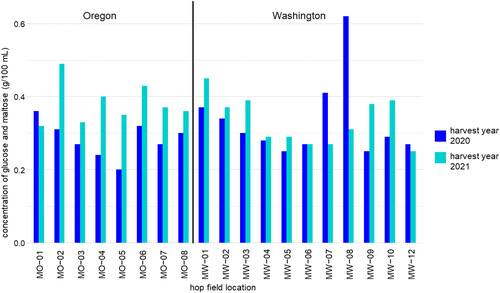
Figure 3. Box and whisker plots showing the hop enzyme activity (expressed as the concentration of glucose and maltose produced during a dry-hopping assay) by variety, state, and harvest year. The average activity for each variety (green representing Cascade, whereas blue represents Mosaic®) is displayed as dotted ⋅⋅⋅⋅⋅ (2020) or dashed—(2021) lines per harvest year. Solid thick lines centered within each box indicate the median activity for each variety × state × harvest year and individual points represent the respective data for each field location.
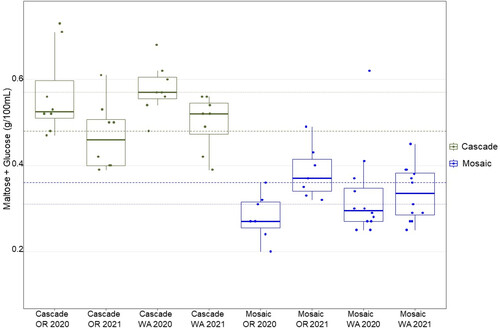
Table 1. Analysis of Variance (ANOVA) p-values for state, farm, harvest year, state-by-year interactions, and year-by-farm interactions.
Table 2. Summary of Pearson correlation coefficients showing strong correlations (r > 0.500) between dextrin-reducing enzyme activity and soil, management, climate, and chemistry relationships.