
Figures & data
Figure 1. Daily 14-day case notification rate per 10,000 population by region and country. Note: The grey area indicates the survey data collection period. Daily minimum and maximum incidence values highlighted via dashed lines. The solid non-transparent line indicates the country mean.
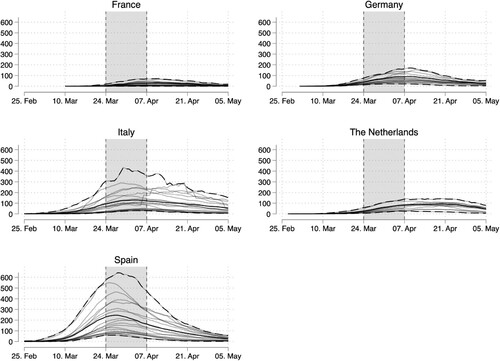
Table 1. Descriptive statistics by country.
Table 2. Conjoint experiment – wording of the conjoint dimensions.Footnote17
Figure 2. Marginal means of package support by conjoint dimensions and excess mortality rate, with 95% confidence intervals.
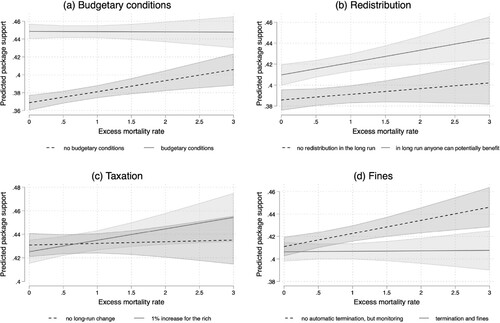
Figure 3. Marginal means of package support by conjoint dimensions and regional GDP drop (2008–2019 vs. 2000–2007), with 95% confidence intervals.
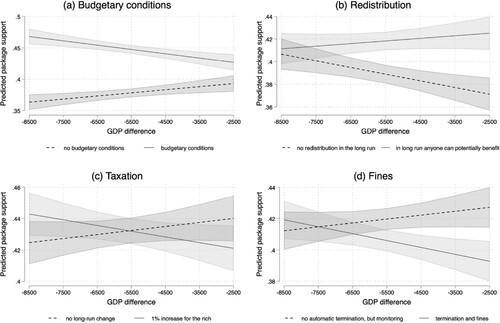
Figure 4. Marginal means of package support by conjoint dimensions and regional net migration rate change (2013–2016 vs. 2010–2012), with 95% confidence intervals.
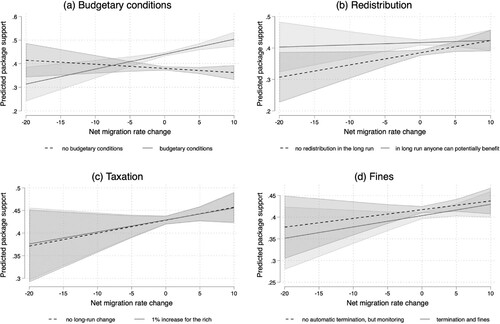
Figure 5. Marginal means of package support by conjoint dimensions and regional composite measure, with 95% confidence intervals.
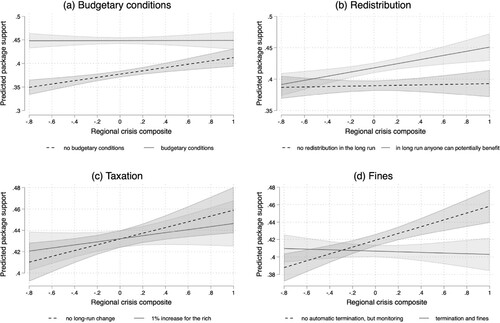
Table 3. Standardised interaction coefficients from the linear multilevel regressions explaining package support.