
Figures & data
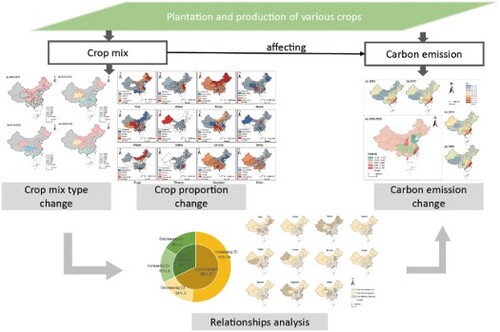
Figure 1. Geographical divisions and main grain-producing provinces of China. Note: it is produced by authors in ArcGIS 10.4.
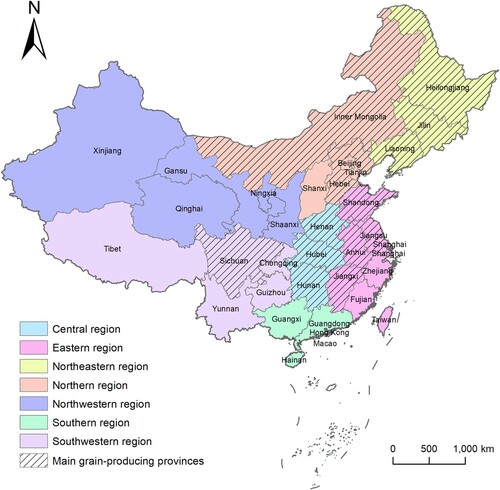
Table 1. Description of the data used.
Figure 2. Flowchart of analyzing crop-mix type changes. Note: it is produced by authors in Visio 2019.
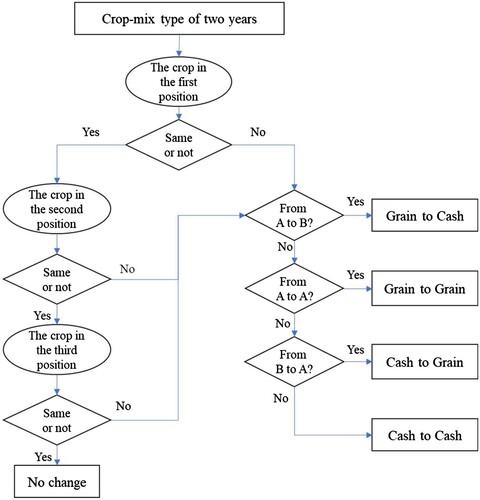
Table 2. Carbon emission factors of different sources.
Figure 3. Provincial crop-mix types in China. (a) and (b) are the distribution of crop-mix types in 2005 and 2020, respectively. (c) depicts the changes in the numbers of crop-mix types. (d) to (f) show the numbers of crops at the first, second, and third positions, respectively. Note: it is produced by authors in ArcGIS 10.4.
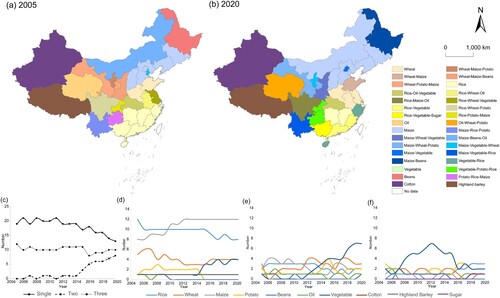
Figure 4. Changes in crop-mix types in China from 2005 to 2020. Note: it is produced by authors in ArcGIS 10.4.
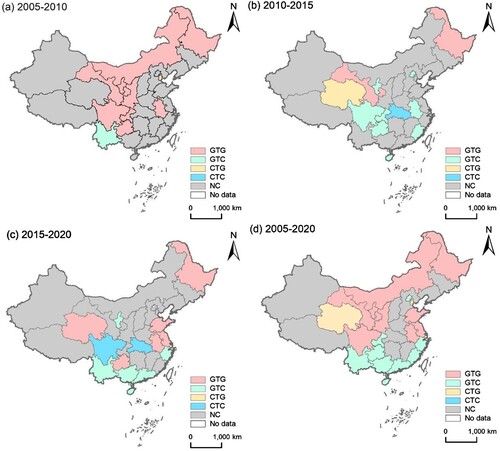
Figure 5. Trends of proportions of various crops from 2005 to 2020. Note: it is produced by authors in ArcGIS 10.4.
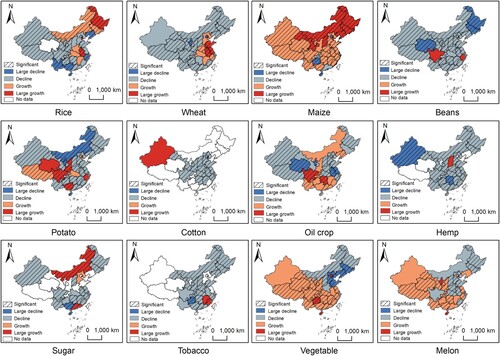
Table 3. Carbon emission intensity of cropping systems in China (t/ha).
Figure 6. Spatial pattern of CI from cropping systems in China. (a) to (d) are the CIs in 2005, 2010, 2015, and 2020, respectively. (e) is the trend of CIs from 2005 to 2020. Note: it is produced by authors in ArcGIS 10.4.
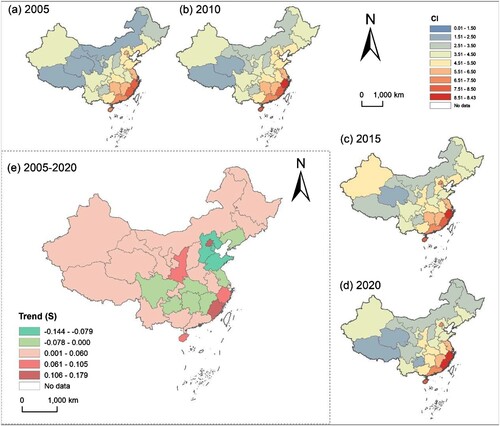
Figure 7. Percentage and number of changes in crop mix type and CI. Note: it is produced by authors in Excel 2019.
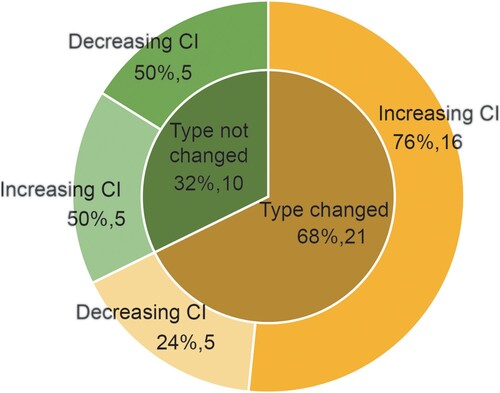
Table 4. Correlation between crops and carbon emissions in China.
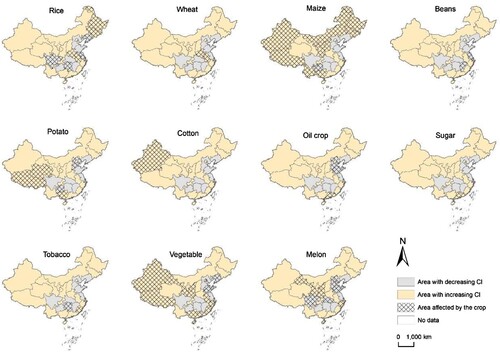
Figure 8. Spatial pattern of correlations between various crops and CI from 2005 to 2020. Note: it is produced by authors in ArcGIS 10.4.